NZD/USD BEST PLACE TO SELL FROM|SHORT
Hello, Friends!
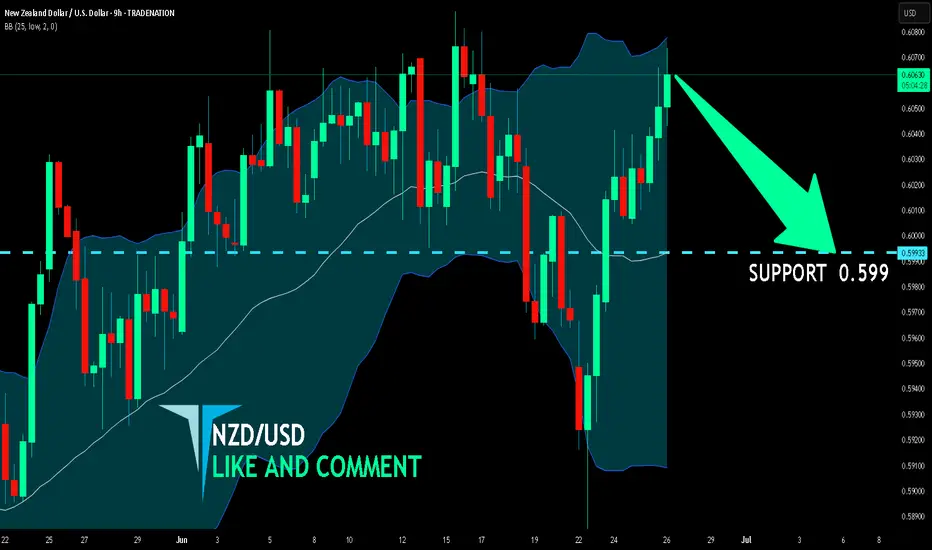
NZD/USD is trending down which is evident from the red colour of the previous weekly candle. However, the price has locally surged into the overbought territory. Which can be told from its proximity to the BB upper band. Which presents a classical trend following opportunity for a short trade from the resistance line above towards the demand level of 0.983.
Disclosure: I am part of Trade Nation's Influencer program and receive a monthly fee for using their TradingView charts in my analysis.
✅LIKE AND COMMENT MY IDEAS✅
USDNZD trade ideas
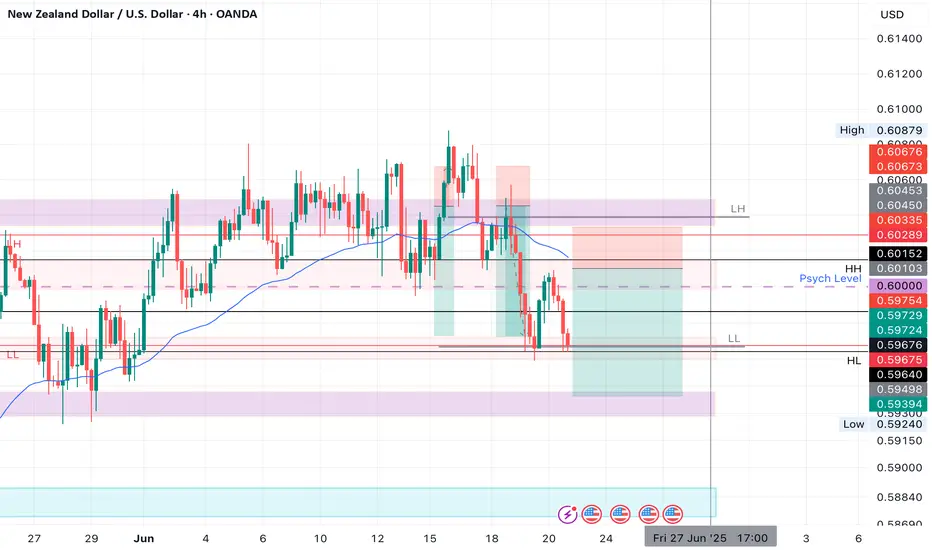
NZDUSD SHORT Market structure bearish on HTFs DH
Entry at Daily AOi
Weekly Rejection At AOi
Daily Rejection At AOi
Previous Structure point Daily
Around Psychological Level 0.60000
H4 EMA retest
H4 Candlestick rejection
Rejection from Previous structure
Levels 3.06
Entry 90%
REMEMBER : Trading is a Game Of Probability
: Manage Your Risk
: Be Patient
: Every Moment Is Unique
: Rinse, Wash, Repeat!
: Christ is King.
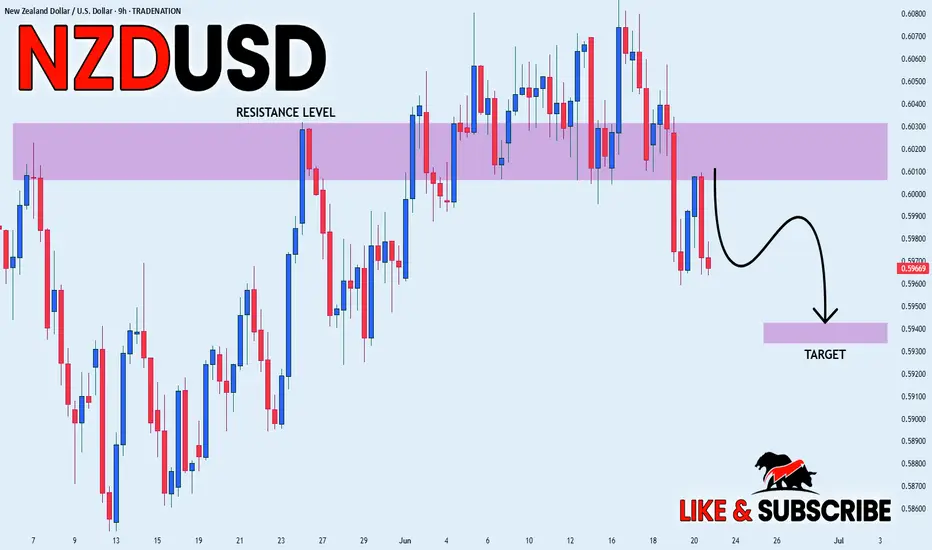
NZD/USDPrice action trading is a methodology in financial markets where traders make decisions based on the actual price movements of an asset over time, rather than relying heavily on technical indicators or fundamental analysis. It involves observing and interpreting patterns and trends in price charts to predict future price movements.
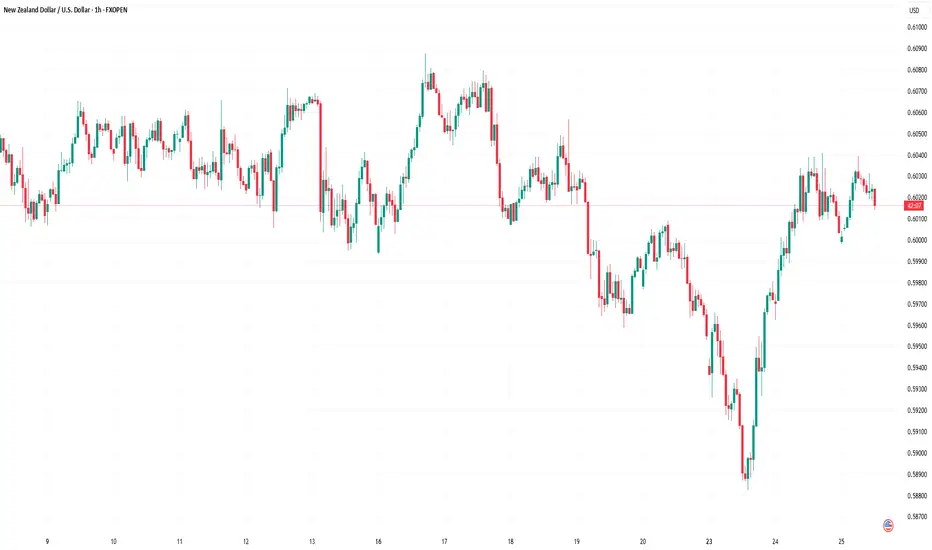
NZD/USD Shows Bullish Hints, Can Gains Be Sustained?Market Analysis: NZD/USD Shows Bullish Hints, Can Gains Be Sustained?
NZD/USD is also rising and might aim for more gains above 0.6040.
Important Takeaways for NZD/USD Analysis Today
- NZD/USD is consolidating gains above the 0.6000 zone.
- There was a break above a major bearish trend line with resistance at 0.5970 on the hourly chart of NZD/USD at FXOpen.
NZD/USD Technical Analysis
On the hourly chart of NZD/USD at FXOpen, the pair started a steady increase from the 0.5880 zone. The New Zealand Dollar broke the 0.5920 resistance to start the recent increase against the US Dollar.
There was a break above a major bearish trend line with resistance at 0.5970. The pair settled above 0.5960 and the 50-hour simple moving average. It tested the 0.6040 zone and is currently consolidating gains.
The pair tested the 23.6% Fib retracement level of the upward move from the 0.5882 swing low to the 0.6040 high. However, the bulls are active above the 0.6000 level.
The NZD/USD chart suggests that the RSI is stable near 60. On the upside, the pair might struggle near 0.6040. The next major resistance is near the 0.6090 level.
A clear move above the 0.6090 level might even push the pair toward 0.6120. Any more gains might clear the path for a move toward the 0.6200 resistance zone in the coming days.
On the downside, immediate support is near the 0.5980 level. The first key support is near 0.5960. It is close to the 50% Fib retracement level.
The next major support is near 0.5920. If there is a downside break below the 0.5920 support, the pair might slide toward 0.5880. Any more losses could lead NZD/USD in a bearish zone to 0.5850.
This article represents the opinion of the Companies operating under the FXOpen brand only. It is not to be construed as an offer, solicitation, or recommendation with respect to products and services provided by the Companies operating under the FXOpen brand, nor is it to be considered financial advice.
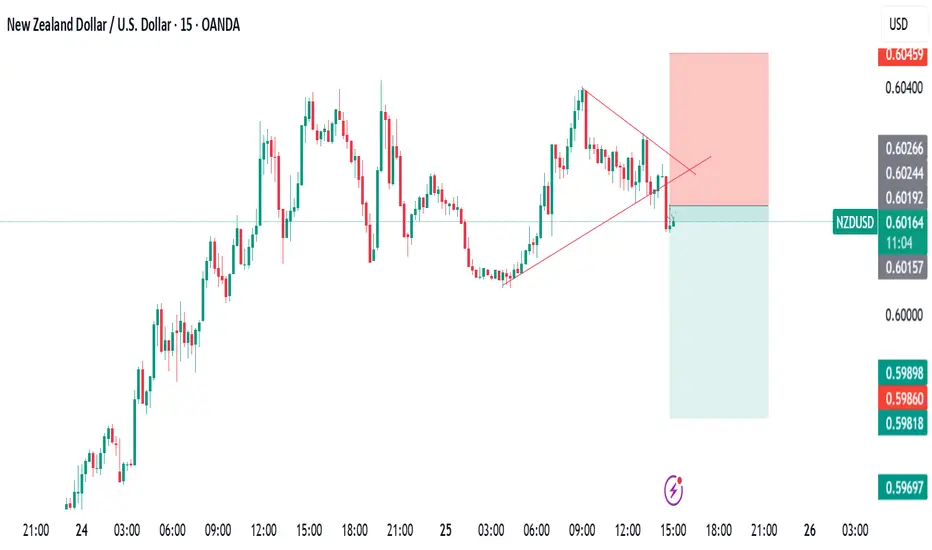
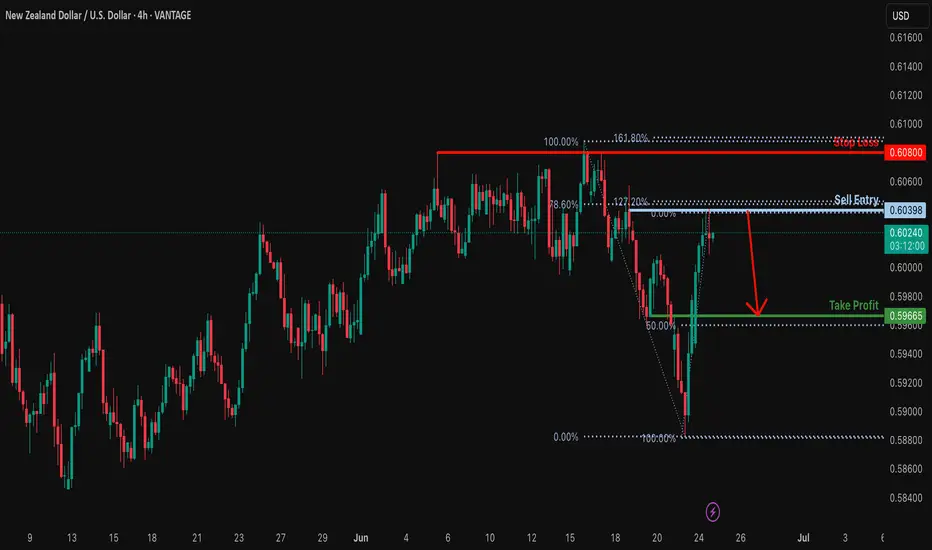
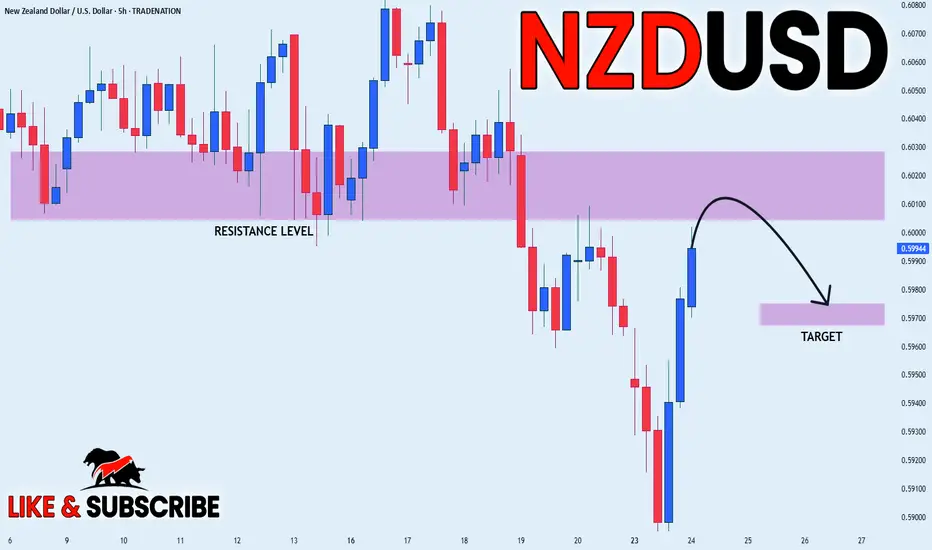
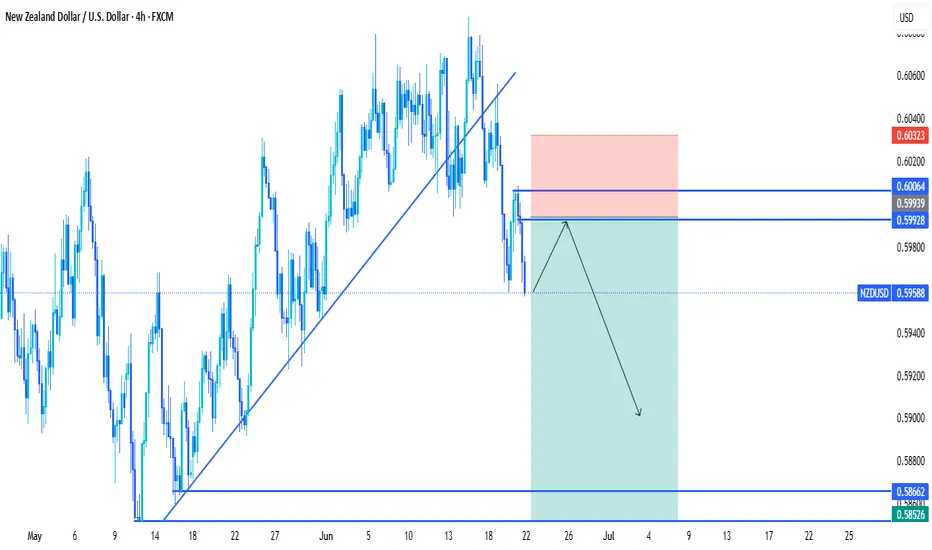
Bearish reversal off pullback resistance?NZD/USD is reacting off the reistance level which is a pullback resistance that lines up with the 127.2% Fibonacci extension and the 78.6% Fibonacci retracement and could drop from this level to our take profit.
Entry: 0.6039
Why we like it:
There is a pullback resistance level that lines up with the 78.6% Fibonacci retracement and the 127.2% Fibonacci extension.
Stop loss: 0.6060
Why we like it:
There is a pullback resistance level that is slightly below the 161.8% Fibonacci extension.
Take profit: 0.5966
Why we like it:
There is a pullback support that lines up with the 50% Fibonacci retracement.
Enjoying your TradingView experience? Review us!
Please be advised that the information presented on TradingView is provided to Vantage (‘Vantage Global Limited’, ‘we’) by a third-party provider (‘Everest Fortune Group’). Please be reminded that you are solely responsible for the trading decisions on your account. There is a very high degree of risk involved in trading. Any information and/or content is intended entirely for research, educational and informational purposes only and does not constitute investment or consultation advice or investment strategy. The information is not tailored to the investment needs of any specific person and therefore does not involve a consideration of any of the investment objectives, financial situation or needs of any viewer that may receive it. Kindly also note that past performance is not a reliable indicator of future results. Actual results may differ materially from those anticipated in forward-looking or past performance statements. We assume no liability as to the accuracy or completeness of any of the information and/or content provided herein and the Company cannot be held responsible for any omission, mistake nor for any loss or damage including without limitation to any loss of profit which may arise from reliance on any information supplied by Everest Fortune Group.
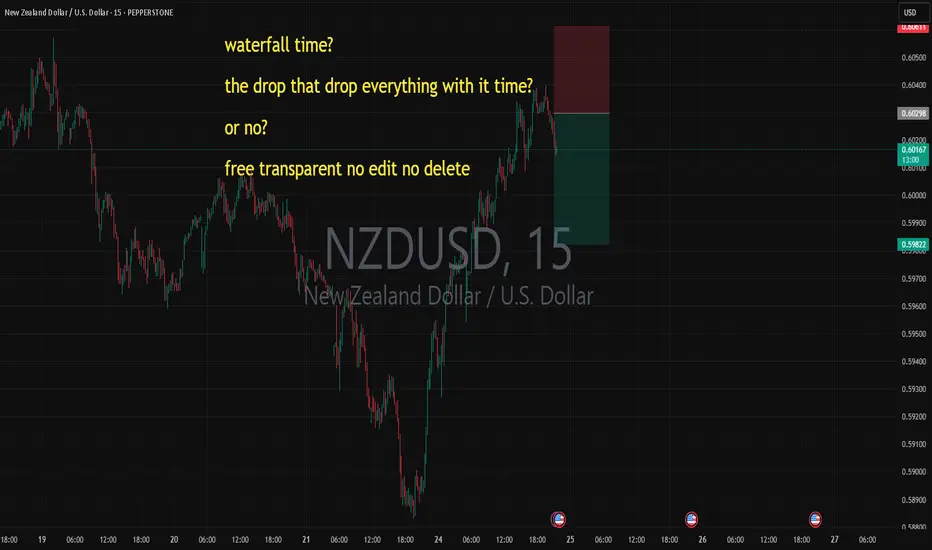
waterfall time? the drop that drop everything with it time? waterfall time?
the drop that drop everything with it time?
or no?
free transparent no edit no delete
let us know!
free transparent no edit no delete
🐉We value full transparency. All wins and fails fully publicized, zero edit, zero delete, zero fakes.🐉
🐉Check out our socials for some nice insights.🐉
information created and published doesn't constitute investment advice!
NOT financial advice
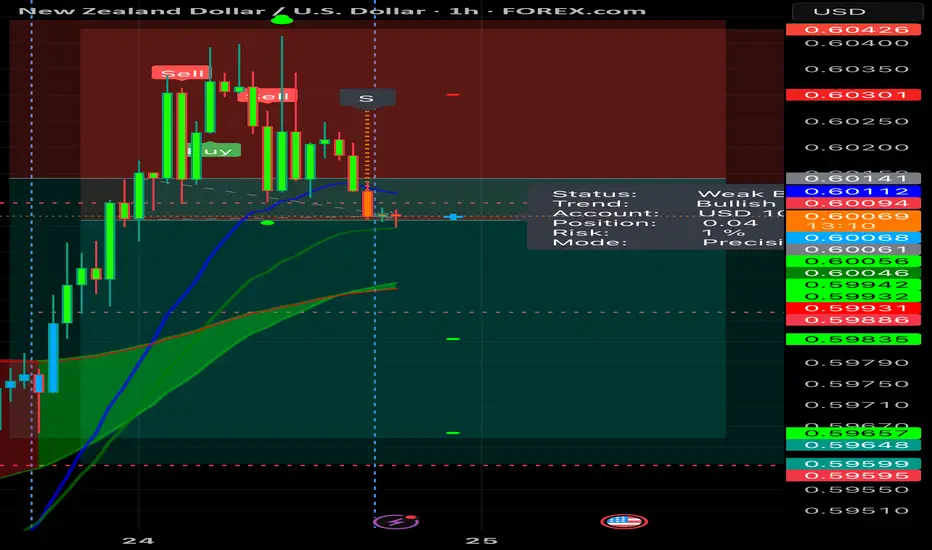
NzdusdThis is my bias on NU
Apply proper risk management pls
I’m not a financial advisor. 1% risk is only
NZDUSD Crazy RR on this, look for confluence to enter dont just hop on it
Apply proper risk management 1% is enough

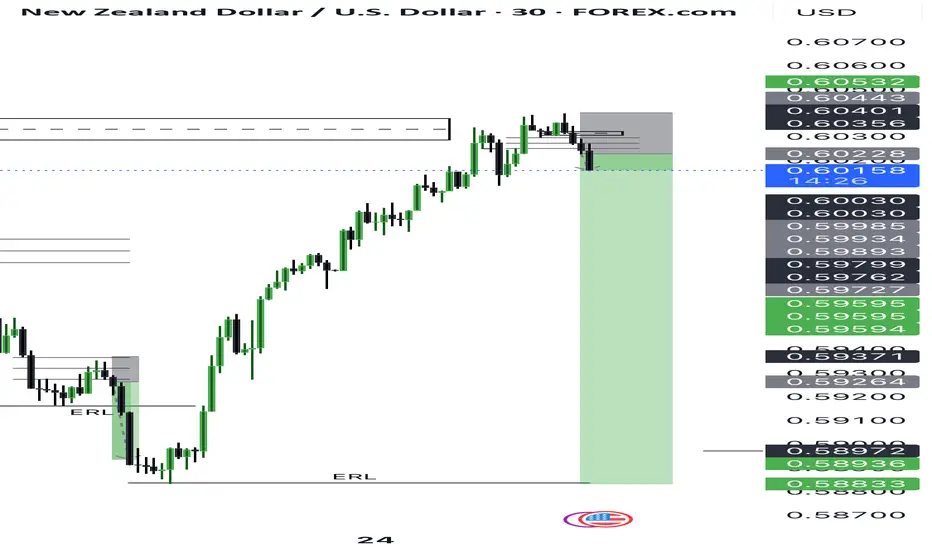
NZDUSD I Monthly CLS I Model 1 I TR Liqudity as TargetHey, Market Warriors, here is another outlook on this instrument
If you’ve been following me, you already know every setup you see is built around a CLS Footprint, a Key Level, Liquidity and a specific execution model.
If you haven't followed me yet, start now.
My trading system is completely mechanical — designed to remove emotions, opinions, and impulsive decisions. No messy diagonal lines. No random drawings. Just clarity, structure, and execution.
🧩 What is CLS?
CLS is real smart money — the combined power of major investment banks and central banks moving over 6.5 trillion dollars a day. Understanding their operations is key to markets.
✅ Understanding the behavior of CLS allows you to position yourself with the giants during the market manipulations — leading to buying lows and selling highs - cleaner entries, clearer exits, and consistent profits.
📍 Model 1
is right after the manipulation of the CLS candle when CIOD occurs, and we are targeting 50% of the CLS range. H4 CLS ranges supported by HTF go straight to the opposing range.
"Adapt what is useful, reject what is useless, and add what is specifically your own."
— David Perk aka Dave FX Hunter ⚔️
👍 Hit like if you find this analysis helpful, and don't hesitate to comment with your opinions, charts or any questions.
NZD_USD RIKSY SHORT|
✅NZD_USD has been growing recently
And the pair seems locally overbought
So as the pair is approaching a horizontal resistance of 0.6020
Price decline is to be expected
SHORT🔥
✅Like and subscribe to never miss a new idea!✅
Disclosure: I am part of Trade Nation's Influencer program and receive a monthly fee for using their TradingView charts in my analysis.
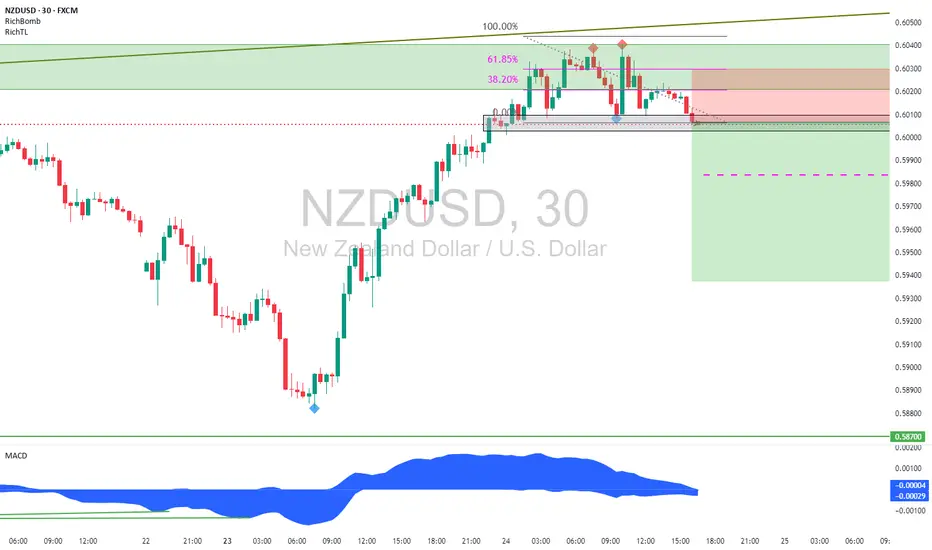
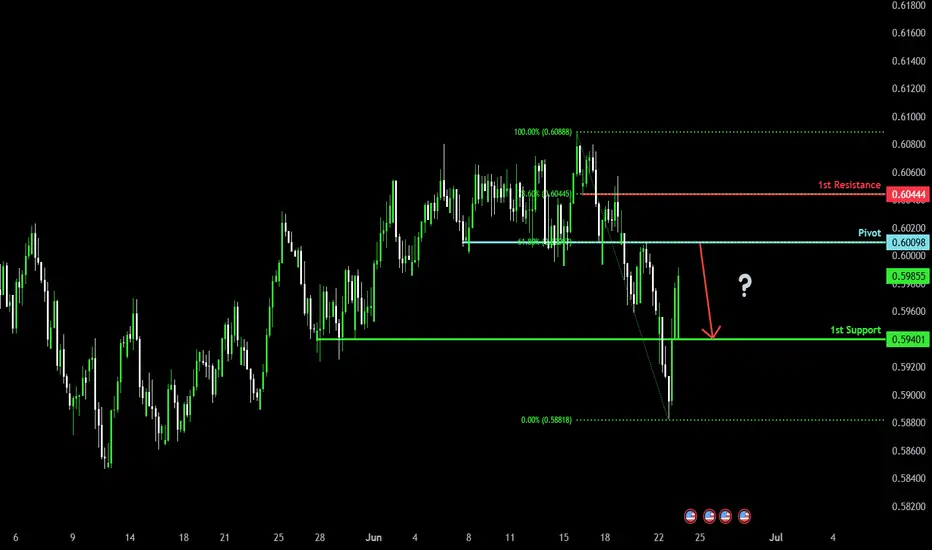
Heading into overlap resistance?The Kiwi (NZD/USD) is rising towards the pivot which has been identified as an overlap resistance that aligns with the 61.8% Fibonacci retracement and could reverse to the 1st support which is a pullback support.
Pivot: 0.6009
1st Support: 0.5940
1st Resistance: 0.6044
Risk Warning:
Trading Forex and CFDs carries a high level of risk to your capital and you should only trade with money you can afford to lose. Trading Forex and CFDs may not be suitable for all investors, so please ensure that you fully understand the risks involved and seek independent advice if necessary.
Disclaimer:
The above opinions given constitute general market commentary, and do not constitute the opinion or advice of IC Markets or any form of personal or investment advice.
Any opinions, news, research, analyses, prices, other information, or links to third-party sites contained on this website are provided on an "as-is" basis, are intended only to be informative, is not an advice nor a recommendation, nor research, or a record of our trading prices, or an offer of, or solicitation for a transaction in any financial instrument and thus should not be treated as such. The information provided does not involve any specific investment objectives, financial situation and needs of any specific person who may receive it. Please be aware, that past performance is not a reliable indicator of future performance and/or results. Past Performance or Forward-looking scenarios based upon the reasonable beliefs of the third-party provider are not a guarantee of future performance. Actual results may differ materially from those anticipated in forward-looking or past performance statements. IC Markets makes no representation or warranty and assumes no liability as to the accuracy or completeness of the information provided, nor any loss arising from any investment based on a recommendation, forecast or any information supplied by any third-party.
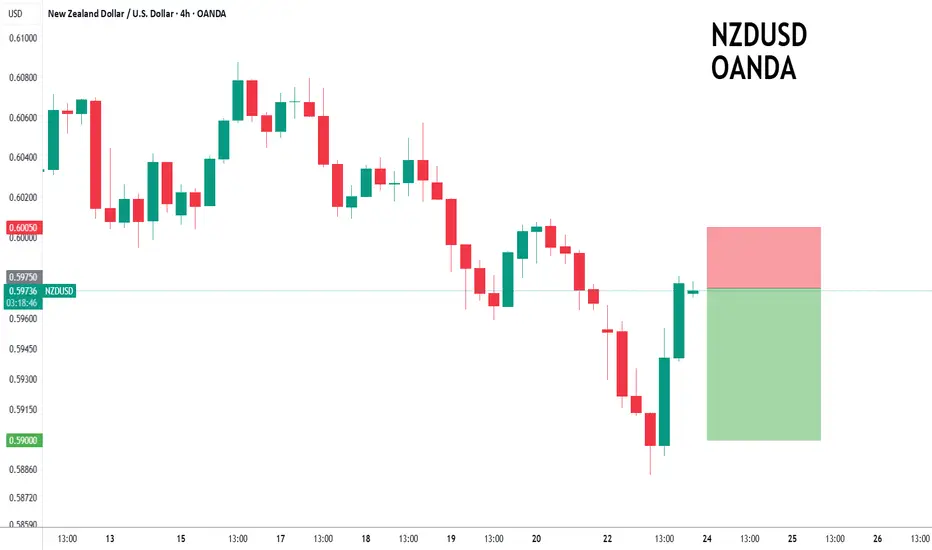
NZDUSD to find sellers at market price?NZDUSD - 24h expiry
Price action looks to be forming a top.
Further downside is expected.
Risk/Reward is ample to call a sell from current levels.
A move through 0.5910 will confirm the bearish momentum.
The measured move target is 0.5875.
We look to Sell at 0.5975 (stop at 0.6005)
Our profit targets will be 0.5900 and 0.5875
Resistance: 0.5950 / 0.5960 / 0.5975
Support: 0.5910 / 0.5900 / 0.5875
Risk Disclaimer
The trade ideas beyond this page are for informational purposes only and do not constitute investment advice or a solicitation to trade. This information is provided by Signal Centre, a third-party unaffiliated with OANDA, and is intended for general circulation only. OANDA does not guarantee the accuracy of this information and assumes no responsibilities for the information provided by the third party. The information does not take into account the specific investment objectives, financial situation, or particular needs of any particular person. You should take into account your specific investment objectives, financial situation, and particular needs before making a commitment to trade, including seeking advice from an independent financial adviser regarding the suitability of the investment, under a separate engagement, as you deem fit.
You accept that you assume all risks in independently viewing the contents and selecting a chosen strategy.
Where the research is distributed in Singapore to a person who is not an Accredited Investor, Expert Investor or an Institutional Investor, Oanda Asia Pacific Pte Ltd (“OAP“) accepts legal responsibility for the contents of the report to such persons only to the extent required by law. Singapore customers should contact OAP at 6579 8289 for matters arising from, or in connection with, the information/research distributed.
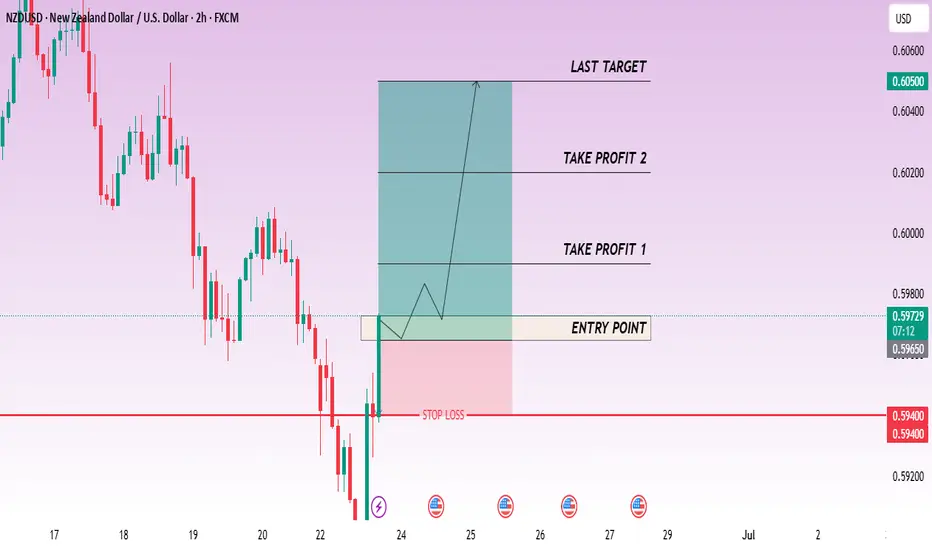
CHECK NUZUSD SIGNAL READ CAPTAINnuzusd buy now ✅
entry point (0.59730) (0.59650)
TAKE PROFIT 1: (0.59900)
TAKE PROFIT 2: (0.60200)
LAST TARGET(0.60500)
STOP LOSS (0.59400)
NzdUsd Trade IdeaNzdUsd is another bearish pair. There is a level of resistance on the higher time frame where price could potentially respect and flip structures at that specific level. If all goes well we could expect some sort of bearish range. I'll be looking to short the pair for a 1:3rr if the set up plays out as planned.
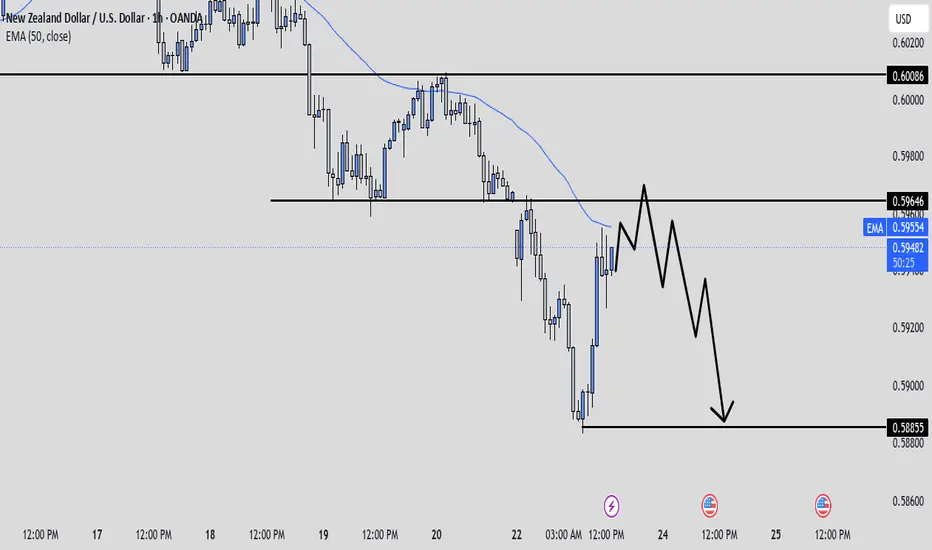
NZDUSD Aiming LowerHi there,
NZDUSD on the M30 chart shows a bearish trend toward 0.58976 with one price target.
If the price breaks above 0.60419, then that will invalidate the setup.
Happy trading, and have a great weekend,
Khiwe
Not trading advice

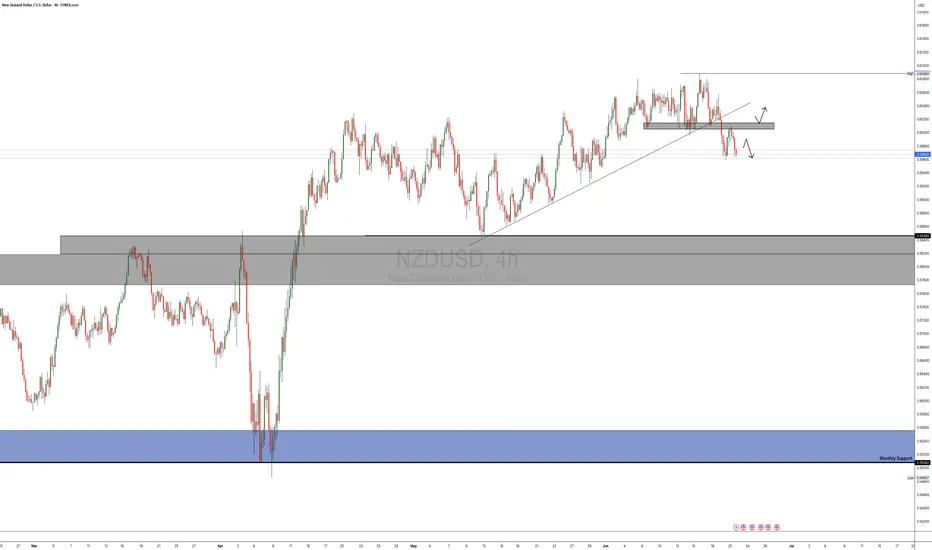
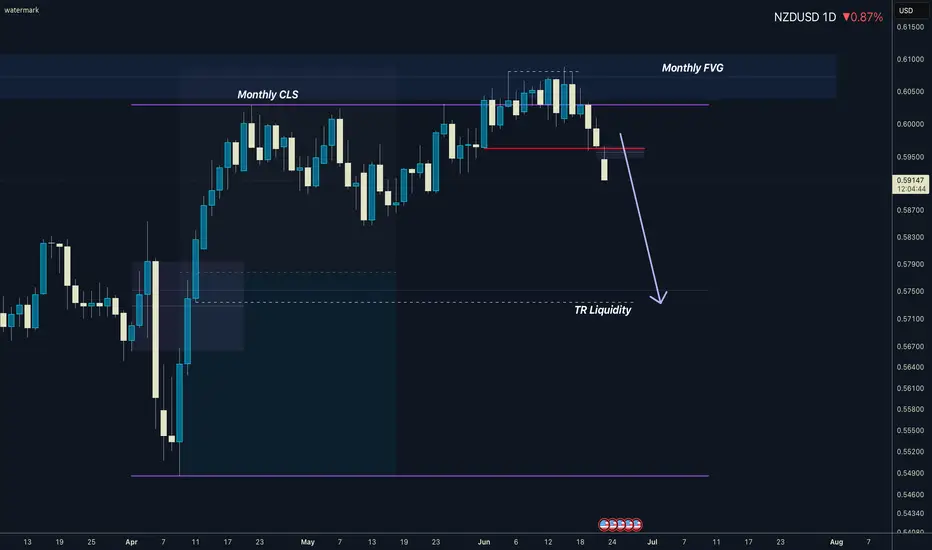
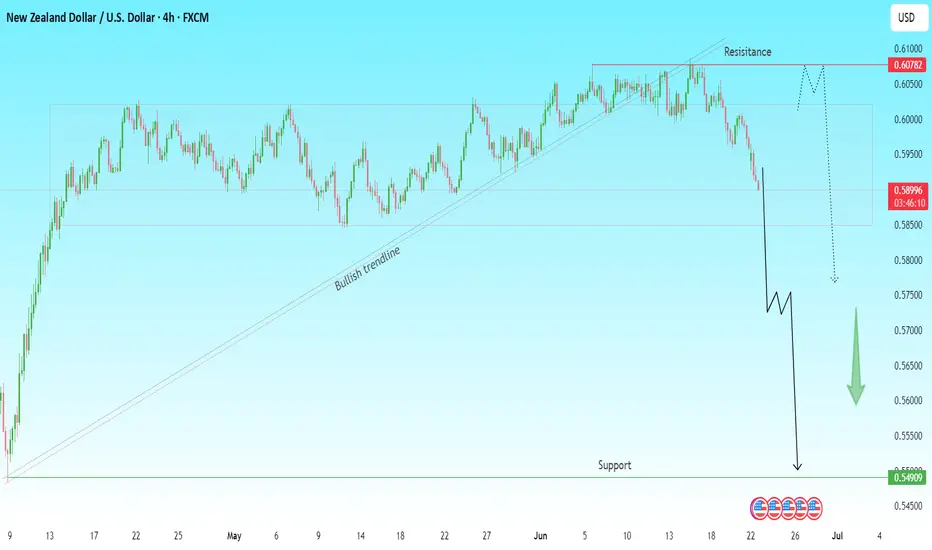
NZDUSD Breakout Alert | Bearish Wave Incoming?The bullish trendline that supported NZD/USD for over a month has finally been broken decisively, signaling a potential bearish reversal.
🔍 Technical Breakdown:
Price has rejected strong resistance around 0.6078 – 0.6100
Clean breakdown below the bullish trendline support
Market structure shift confirmed on the 4H chart
Bearish momentum is gaining strength with no signs of slowdown
📊 Bearish Scenario:
Expecting a minor pullback toward 0.5950–0.5980 zone (potential retest)
If resistance holds, likely continuation toward major support at 0.5490
✅ Trade Idea:
📍 Sell on pullback below 0.5980–0.6000 zone
🎯 Target: 0.5700 → 0.5550 → 0.5490
❌ SL above 0.6100
🔔 Watch closely for price action confirmation before committing – momentum is key.
#NZDUSD #ForexAnalysis #Breakdown #TrendReversal #TechnicalAnalysis #BearishSetup #TradingView #PriceAction
NZDUSD BUY OPPORTUNITY There is a buy trade Opportunity on NZDUSD
Entry: 0.59200
Stoploss: 0.59100
Takeprofit: 0.59990
Comment your opinion
For Fund management. Dm on X @shajudeakinoba1

NZDUSD TRADE SETUPWait for retest the entry level and bearish momentum then take a trade for Sell otherwise skip this setup
NZD_USD WILL GO DOWN|SHORT|
✅NZD_USD is going down currently
As the pair broke the key structure level of 0.6030
Which is now a resistance, and has made a pullback
And the retest, so I think the price will keep going down on Monday
SHORT🔥
✅Like and subscribe to never miss a new idea!✅
Disclosure: I am part of Trade Nation's Influencer program and receive a monthly fee for using their TradingView charts in my analysis.
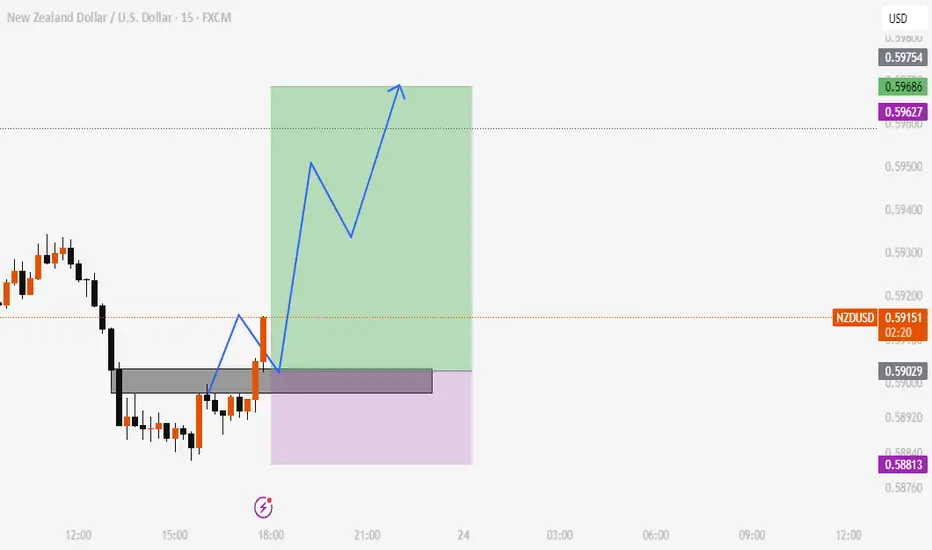
NZDUSD POSSIBLE TRADE SETUPPotential Trade Setup on NZDUSD
NZDUSD is on a strong 3-week rally correction that almost got broken to the downside last week and successfully retested on Friday
That said, I am still quite anticipating for a possible continuation of the bearish trajectory that started last week to continue towards the MAY low at 0.5880
Trading Plan:
1. SELL: is currently in play, and a further downside movement can be well followed through in the 4H chart.
2. BUY: if the resistance is broken and the retest is successful.
Targets:
1. Can be 1:2 for either entry.