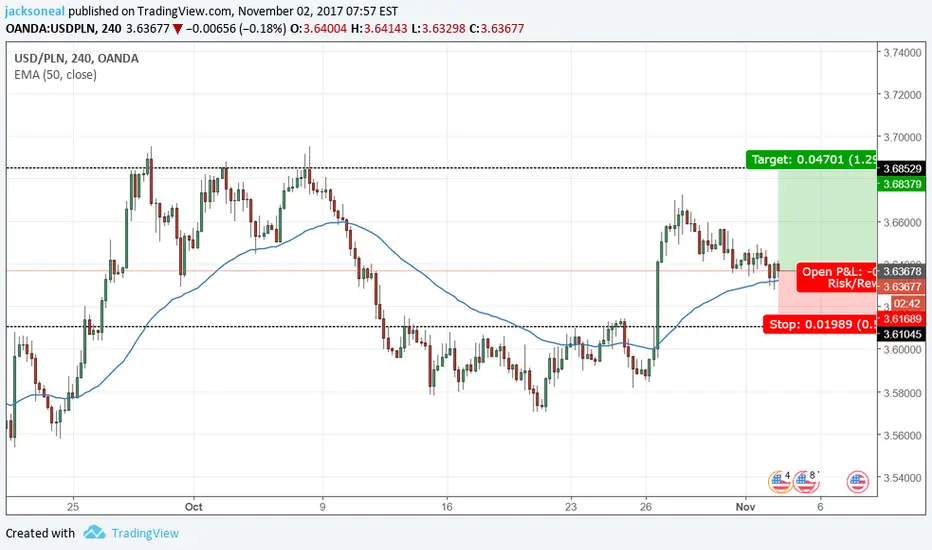
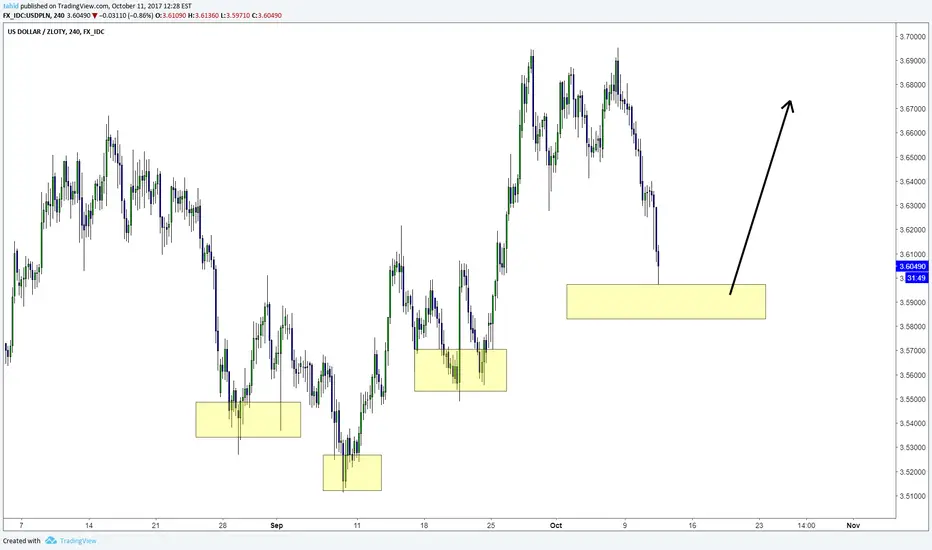
This is the support ?The cross seems to have a good support at this point.
The USD is getting stronger and this price maybe a good point to entering long after some more confirmations.
The long term market pressure still light negative -4.0 but the higher value of short term market pressure -3.2
is tipical of a reversal point.
This analysis is based on Market pressure value, you can find the long term value value for each cross in my twitter profile.
USDPLN trade ideas

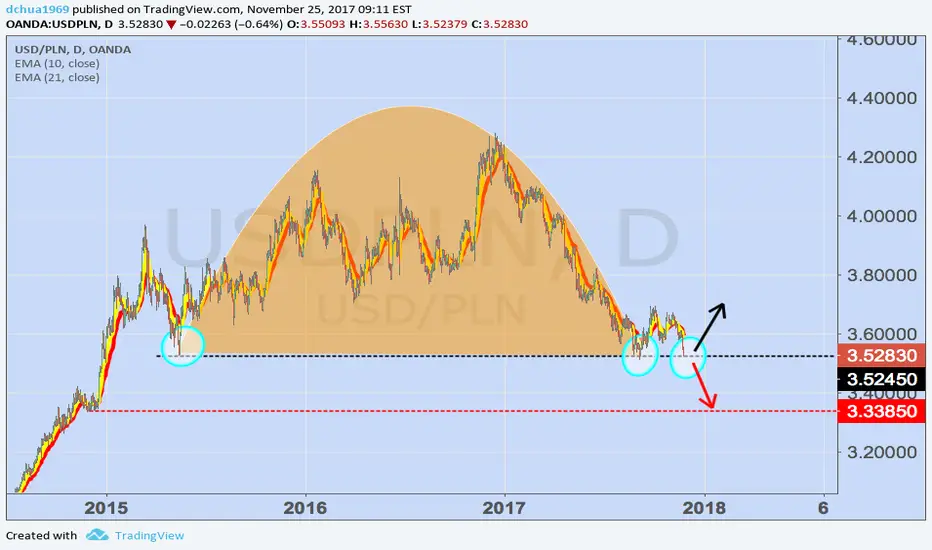
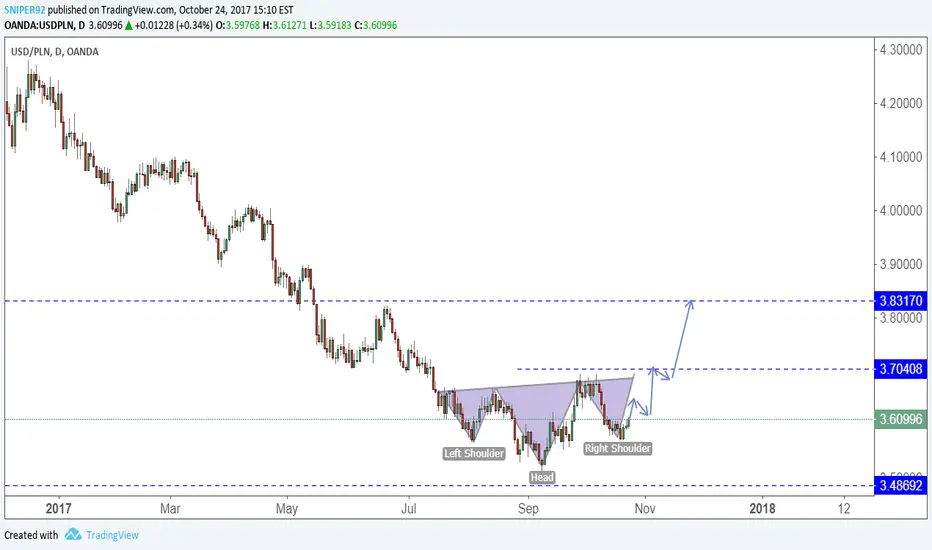
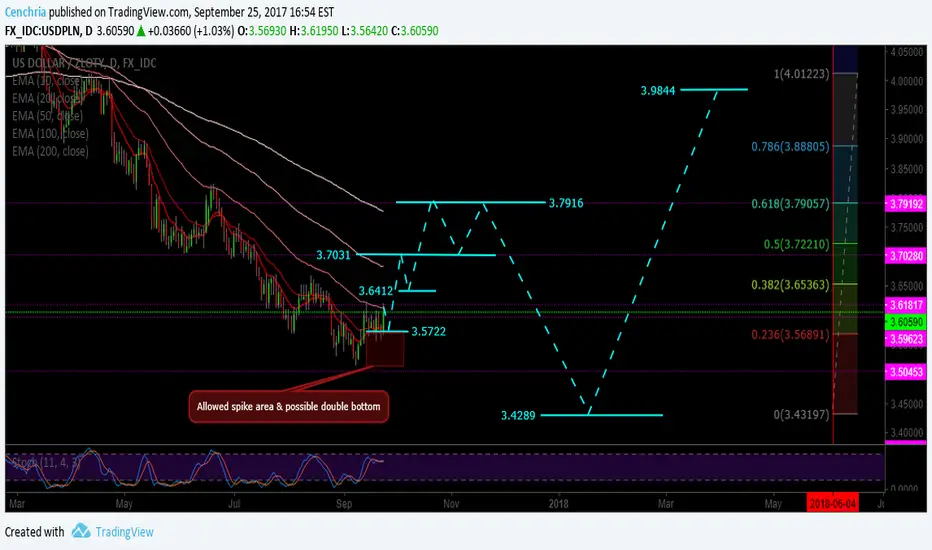
USDPLN @ crossroadsNow this pair is at its cross roads. It can either break below the support line (red dotted line) and heads towards 3.338 then rebound or from current price , it heads for a pull back and goes up to 3.698. Notice that twice the price action hits 3.528 and rebound? See, it is between 50% and 61.8% FIB zone so it need not be precisely touching this two points before it can have a pullback. Now it is the 3rd attempt, will it continue the prior pattern of retracement or disappoint the traders and head further south? If it is, then it is likely to hit 3.426 which is the lower end of the ascending channel. The weekly chart shows a continuing uptrend for this pair.
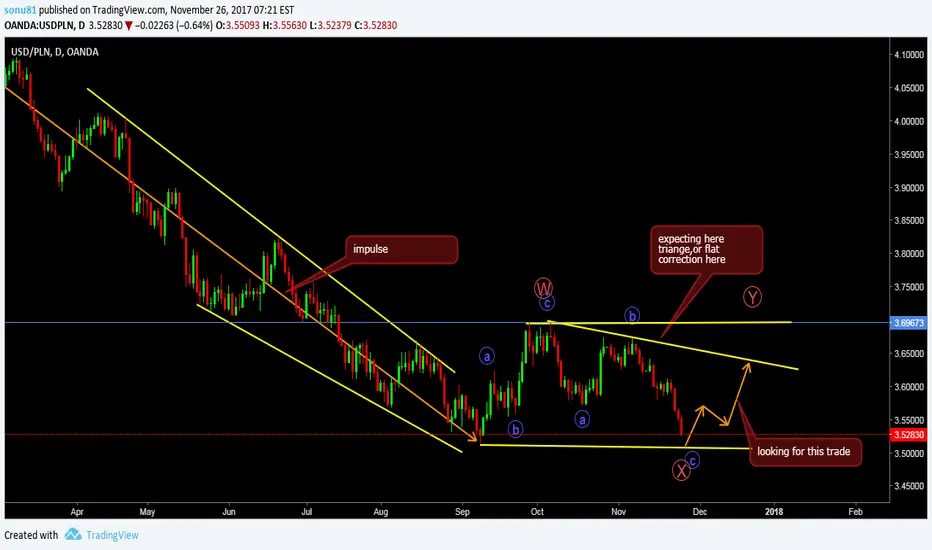
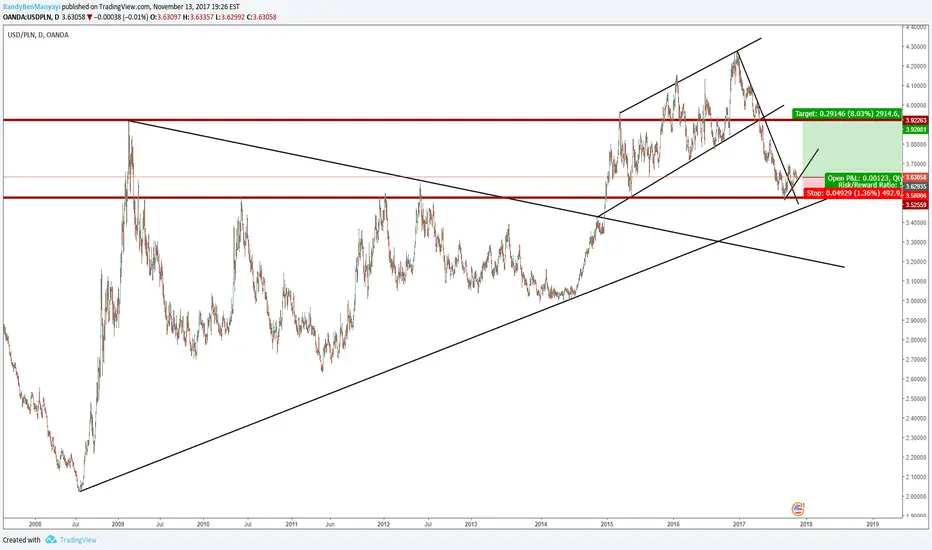
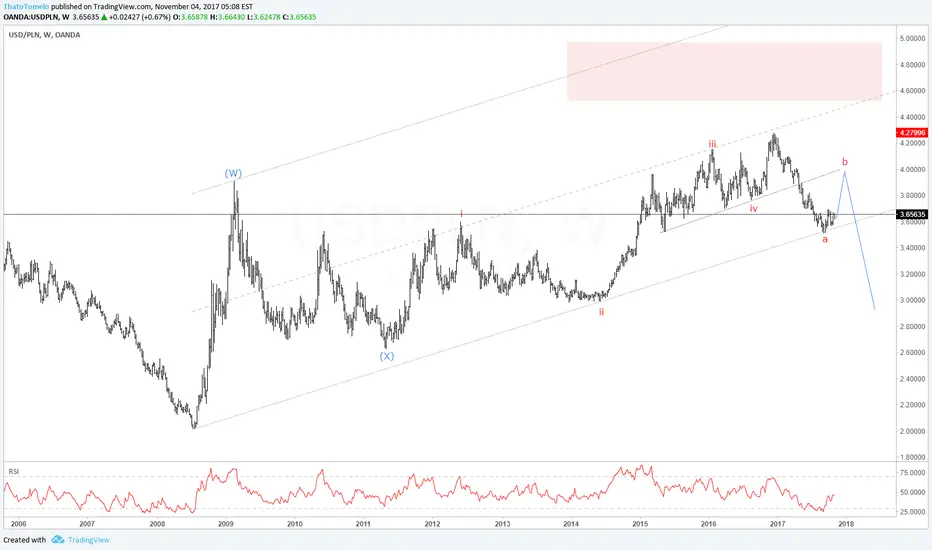
LONG TERM VIEWThis is my long term view on this pair based on wave structure analysis. and chart patterns.
I consider two options at moment with much higher probability of one more up wave within channel.
As we are almost at bottom of channel watch for buy setups on lower time frames.
If last up wave develops we should have at least 1 year of increases witch final target around 4.5000 level.
You will be able to trade number of opportunities going along with higher time frame trend.


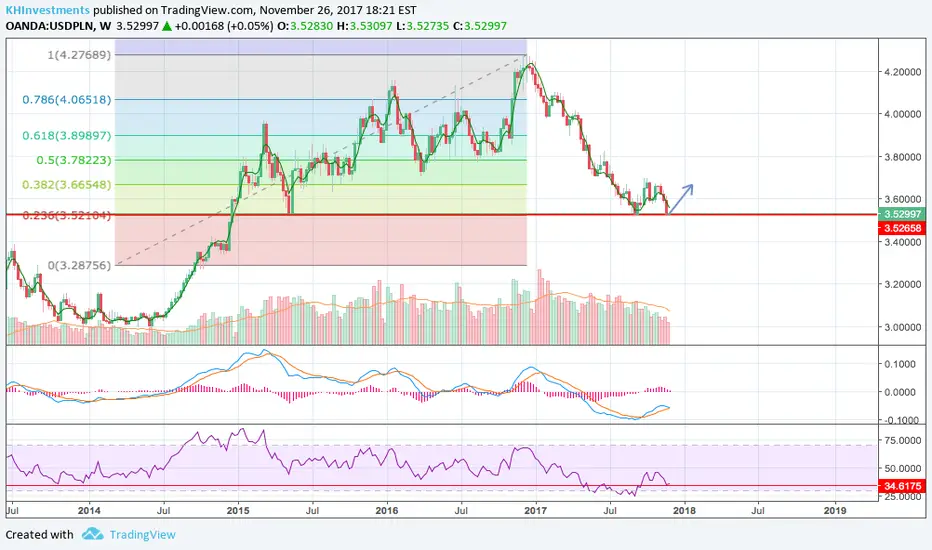
EURPLZ great long option! EURPLZ at really strong support at FIB 0.236 (3.52104). -> Target now at Fib 0.382 (3.66548).
USD/PLN 1H Chart: Greenback tended southwardsThe US Dollar is trading in three channels simultaneously against the Polish Zloty. The senior pattern has confined the rate for the last seven months.
If looking at the pair’s movement two weeks ago, it is apparent that the senior channel took the upper hand over a more junior formation, as the rate halted near the 3.67 mark, thus failing to reach the upper boundary of the medium-term channel near 3.72.
Currently, the rate is trading in a three-week channel down. Technical indicators signal that the Greenback might still edge slightly higher within the following two sessions, but reverse near the 200-hour SMA circa 3.62/63.
The subsequent movement should be tended south in the short term down to the 3.57 mark where the weekly and monthly S1s and the lower boundary of the medium channel are located. This area could mark a minor correction upwards.

Rebound and up !Maybe the worst period for USD is at the end .
the cross bounce on the resistance and try to rise
The short term market pressure confirm the new direction.


USDPLN LongThis chart is yelling for a Long isnt it? Probability of the price testing the Daily Resistance is high imo.

USD/PLN 1H Chart: US Dollar breaches long-term channelUSD/PLN had been trading in a descending channel in force since mid-November, 2016. After breaching this pattern last week, the Greenback retraced from its upper boundary early on Monday.
Thus, the dominant pattern now is an ascending channel which was formed mid-July. The rate’s trading range within this pattern has diminished, as it has failed to touch the bottom channel boundary on two separate occasions.
From theoretical point of view, the breakout from the senior channel should be followed by a surge. This is likewise supported by the pair’s upward-sloping movement in the junior channel.
The rate is supported by the 100– and 200-hour SMAs, the weekly and monthly PP and the weekly S1 in the 3.64/3.60 territory.
In general, it is likely that one of these levels pressures the US Dollar for a reversal, thus paving the way for a surge in the medium-term.


USD/PLN 1H Chart: Channel UpUSD/PLN 1H Chart: Channel Up
The American Dollar is trading against the Polish Zloty in two week long ascending channel that started to form after the currency exchange rate changed a direction and jumped through the 55- and 100-hour SMAs to the top.
By the moment, it consists of four confirmation points, which means that it has reached maturity and might be broken in the nearest future.
The breakout might occur even earlier, as the currency pair is simultaneously moving in a junior descending channel whose existence became evident after the buck failed to pass through the monthly PP at 3.6490 yesterday.
On the other hand, the road downstairs is secured by the 200-hour SMA and the weekly PP at 3.6252.
On the gradual surge to the top additionally point out traders’ mood, which is 72% bullish.


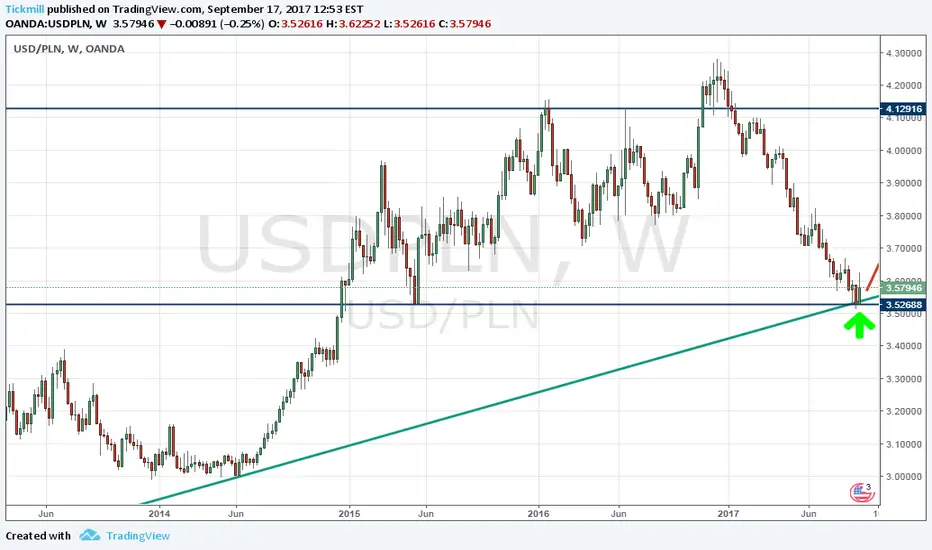
Interesting position on the Polish zloty (USD/PLN)!On a monthly chart, the price pushed away from point 3 of the rising channel and on the weekly chart was closed by takeover. Also the price rebounded from the horizontal support 3.52688.
There are two options. The first is buying when the market opens. The second is buying from the middle of the takeover: Buy Limit 3.5500, SL = 3.4900, TP1 = 3.7000, TP2 = 4.1000.
Oleg Svirgun