USDT DOMINANACE ANALYSIS (12H)This analysis is an update of the analysis you see in the "Related publications" section
First of all you should know that "USDT Dominance" is always moving inverse of BTCUSDT .
I correctly identified the upward movement in Tether Dominance in the previous analysis, but with the news of war in the
Key data points
Previous close
—
Open
—
Day's range
—
About Market Cap USDT Dominance, %
Coin
Tether is considered a pioneer of the stablecoin model. As such, it's pegged to an external asset, US dollar, which lets it combine the stability of the real-world investment tools and the earning potential of a cryptocurrency. Looks reliable (if you can call any crypto assets that), which is probably why its share on the market has been growing since its launch way back in 2014. You can see for yourself, just look at the USDT dominance chart we've prepared — it reflects the ratio of Tether market cap to the cumulative market cap of the crypto market.

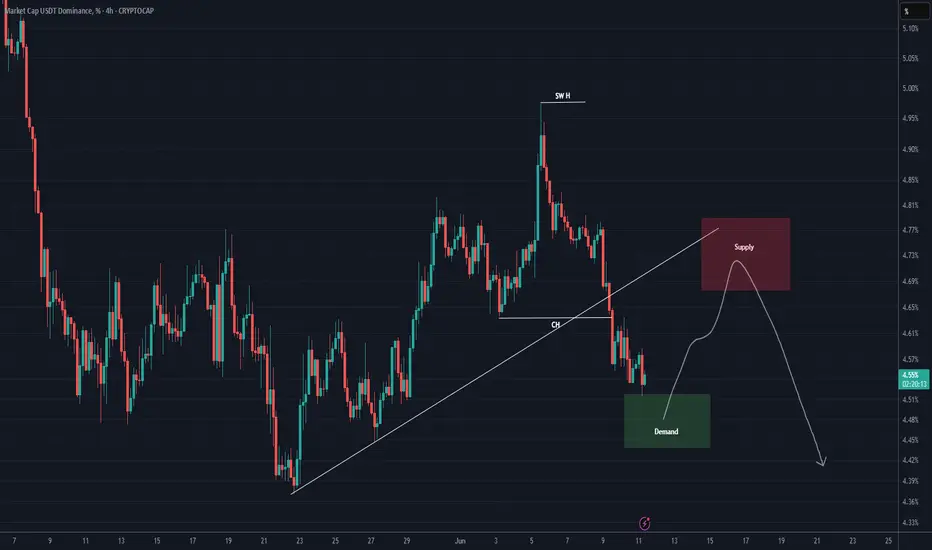
USDT DOMINANCE NEW UPDATE (4H)The price is now approaching an important support zone and hasn’t yet pulled back to the broken trendline.
It’s expected that the price will soon recover from the green box, move toward the red box as a symbolic move, and then get rejected downward again from the red box.
For risk management, plea
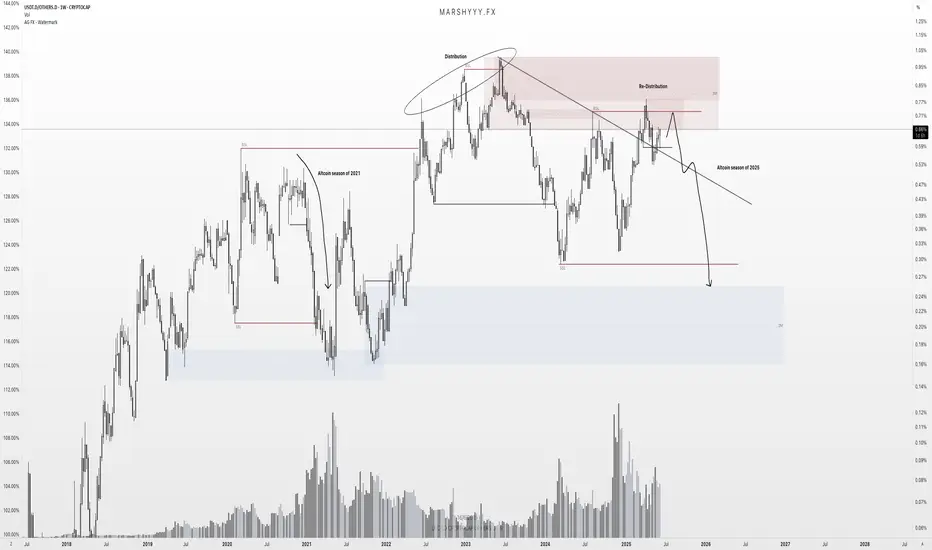
USDT.D/OTHERS.D - Altcoin Season IndicatorPrice rejected from the 3M HTF supply and major BSL on the prior highs. Price has now gave a confirmed 1W bearish market shift, indicating a market wide altcoin reversal is playing out and the next bullish impulse higher isnt far off....
Watching for rejections in this weekly supply on this pair as
#ALTCOIN UPDATE: URGENT!CRYPTOCAP:USDT Dominance Update: Didn't quite expect this move to be honest. I was only half right.
4.65% acted as a strong support.
Bulls are losing steam, bears are stepping in, but there's a catch:
USDT Dominance is now testing a key trendline resistance after multiple clean rejections in the p
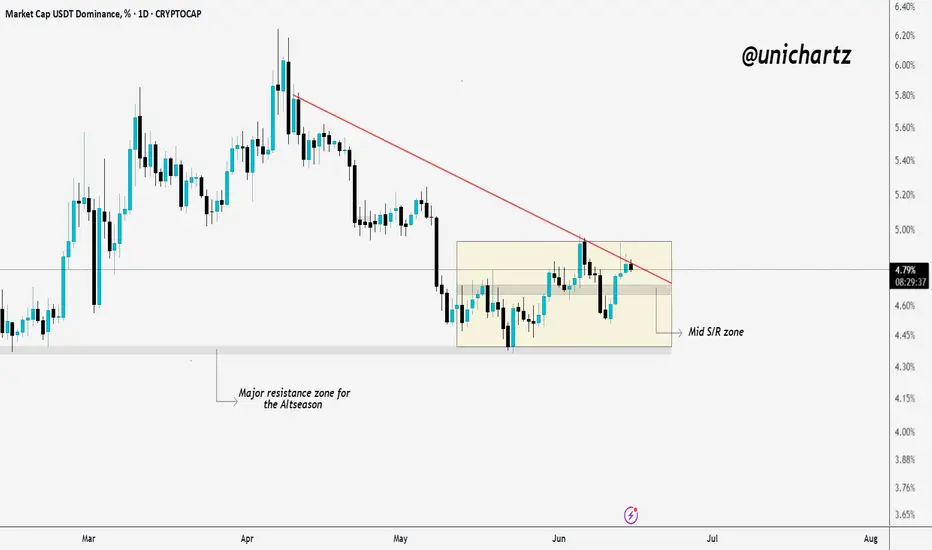
USDT.D Consolidation Near Breakout Zone – Eyes on the Next MoveHello traders, here is the USDT.D update:
The chart is currently hovering near a major resistance zone, one that historically plays a key role in triggering altseason.
After a period of consolidation inside the mid-range S/R zone, price is now testing the downtrend line from above. A clear rejecti
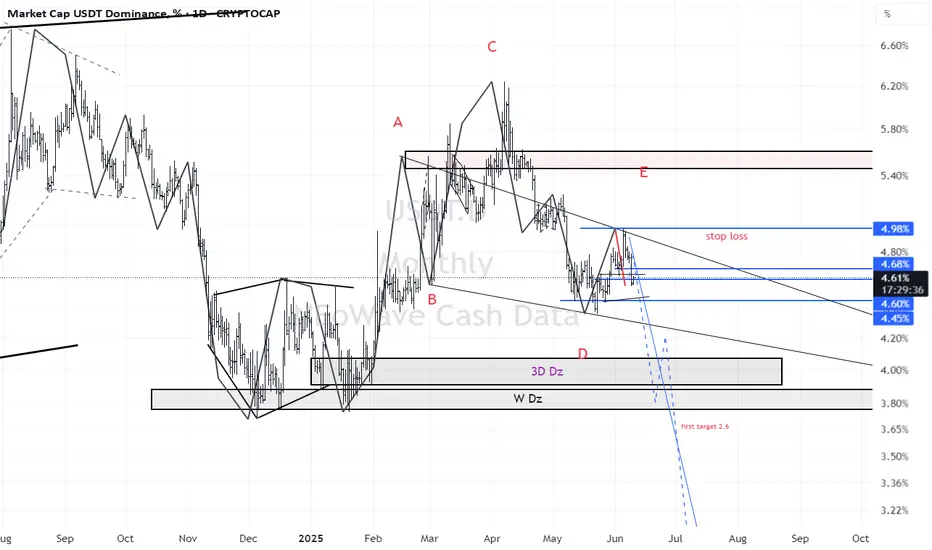
USDT.D(based on NEowave)I think wave E of triangle touched the necessary high and crypto is ready for a big pump.
pay attention to the targets and stop loss!
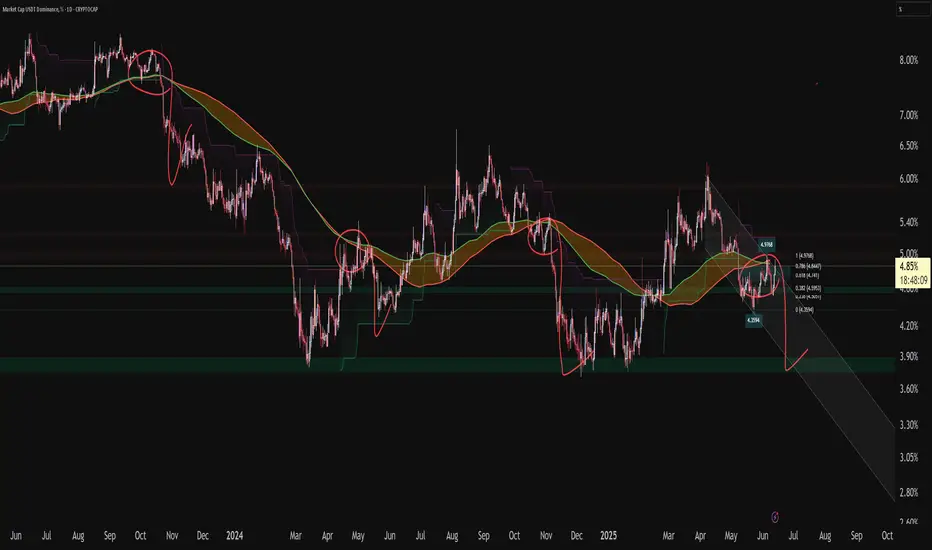
USDT.D Bearish Cross Signals Potential Boom looks like history might repeat—last time USDT.D retested the bull market support band with a bearish cross, it dumped hard, paving the way for a market boom. If that pattern holds, we could see cash shift from stablecoins to BTC/alts, sparking an altseason.
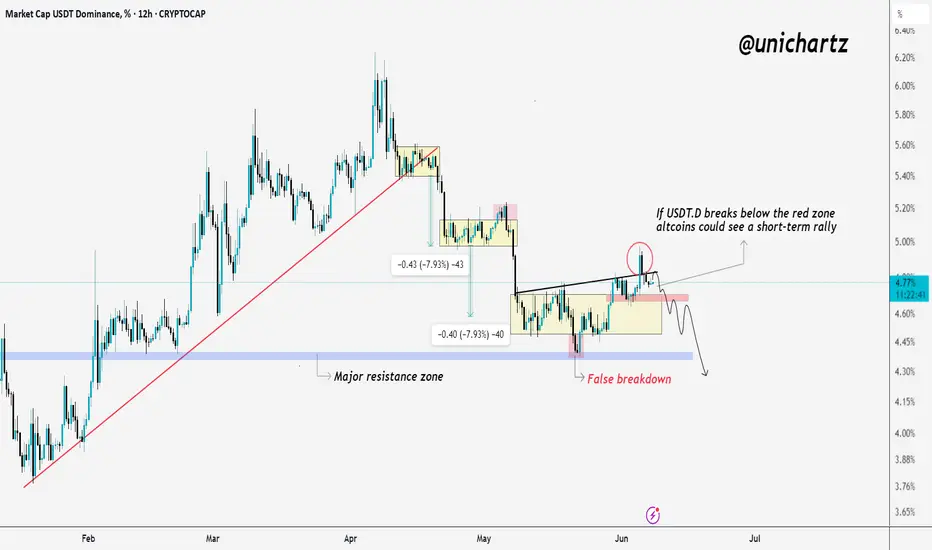
Eyes on USDT.D — Potential Altcoin Rotation SetupUSDT Dominance Update (USDT.D)
USDT.D is currently sitting just above the key red zone (support).
This level has acted as an important pivot for the last few weeks.
If we see a breakdown below this zone, it could trigger a short-term rally in altcoins — as capital rotates out of stablecoins into r
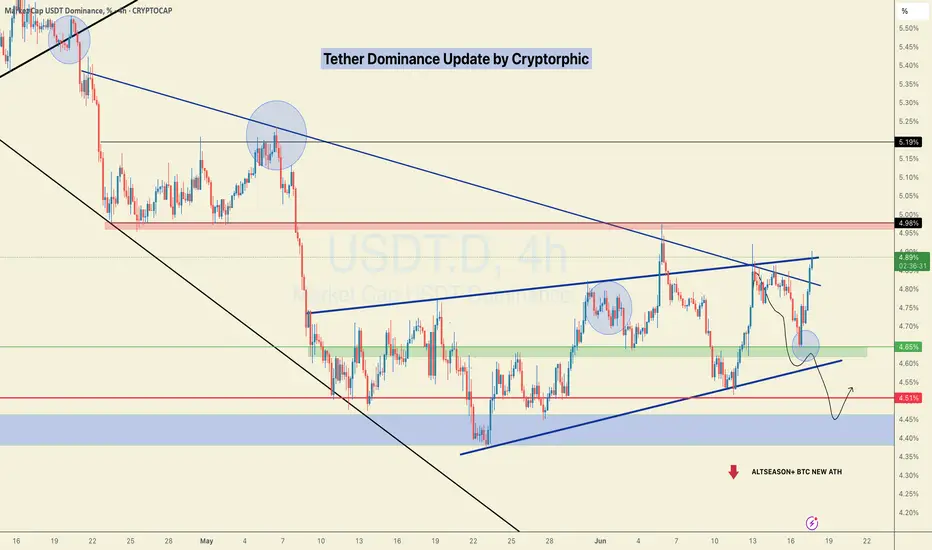
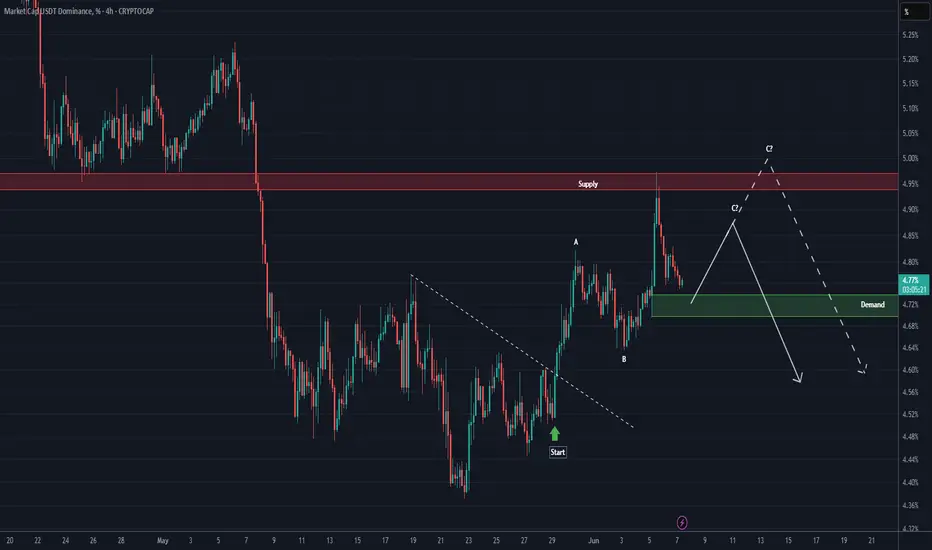
USDT DOMINANCE Update (4H)In our latest analysis, we pointed out the bullish movement in Tether dominance and warned to be cautious | and eventually, that move played out.
The bullish movement in Tether dominance started from the point where we placed the green arrow on the chart. It appears to be an ABC pattern, and we are
See all ideas
Summarizing what the indicators are suggesting.
Oscillators
Neutral
SellBuy
Strong sellStrong buy
Strong sellSellNeutralBuyStrong buy
Oscillators
Neutral
SellBuy
Strong sellStrong buy
Strong sellSellNeutralBuyStrong buy
Summary
Neutral
SellBuy
Strong sellStrong buy
Strong sellSellNeutralBuyStrong buy
Summary
Neutral
SellBuy
Strong sellStrong buy
Strong sellSellNeutralBuyStrong buy
Summary
Neutral
SellBuy
Strong sellStrong buy
Strong sellSellNeutralBuyStrong buy
Moving Averages
Neutral
SellBuy
Strong sellStrong buy
Strong sellSellNeutralBuyStrong buy
Moving Averages
Neutral
SellBuy
Strong sellStrong buy
Strong sellSellNeutralBuyStrong buy
Displays a symbol's price movements over previous years to identify recurring trends.