USDT dominance: Head and shoulder pattern on LTF!!Join our community and start your crypto journey today for:
In-depth market analysis
Accurate trade setups
Early access to trending altcoins
Life-changing profit potential
Let's analyze USDT dominance:
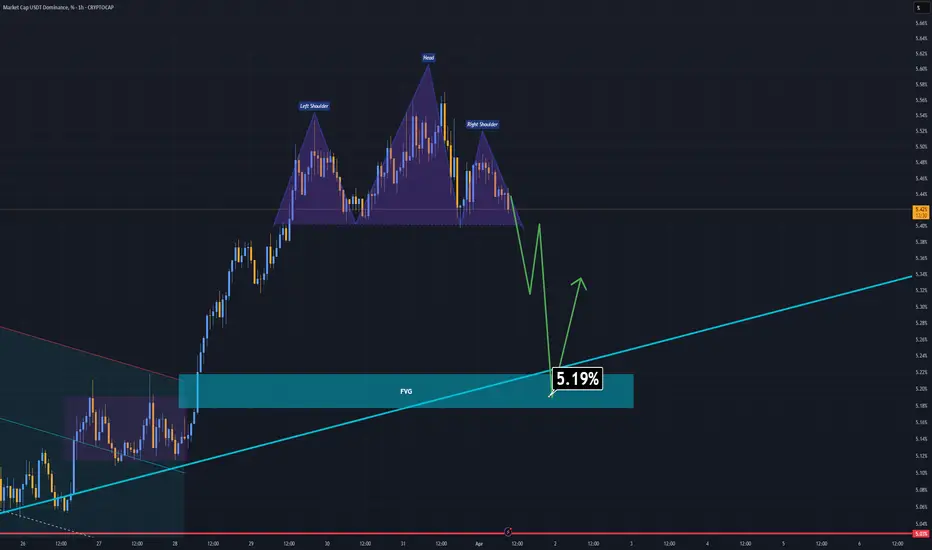
USDT dominance is nearing a breakdown, forming a head and shoulders pattern. Rejected at 5.55%, it's testing 5.3%-5.2% support. A breakdown here could provide temporary relief for altcoins, as capital shifts.
Resistance:
5.55%
5.4%
Support:
5.29%
5.21%
If you find this analysis helpful, please hit the like button to support my content! Share your thoughts in the comments, and feel free to request any specific chart analysis you’d like to see.
USDT.D trade ideas

USDT Dominance New UpdateIn short time frames, USDT.D has formed an Head and Shoulders pattern. If the neckline is broken, we expect a little dump in here which will make some of alts recover for a short while.
Due to BTC dominance is a lot higher than a week ago, I consider to long Bitcoin only.
USDT.DAfter a false break of support from 2017, bulls were lured to the BTC top.
It is currently preparing to launch a larger correction.

USDT.D As you know usdt.d is in uptrend but also making chanel which will be break to the downside in april

Why the rise of Bitcoin is temporary every time?!The Dominance Tether chart, which acts against the direction of the market, has formed an ascending channel in the last three months at the same time as the bit fell from its historical ceiling, and after every correction and hitting the bottom of the channel, the trend is upward again, and on the opposite side of the falling market, until Dominance Tether breaks this channel down, any rise in Bitcoin will be temporary.
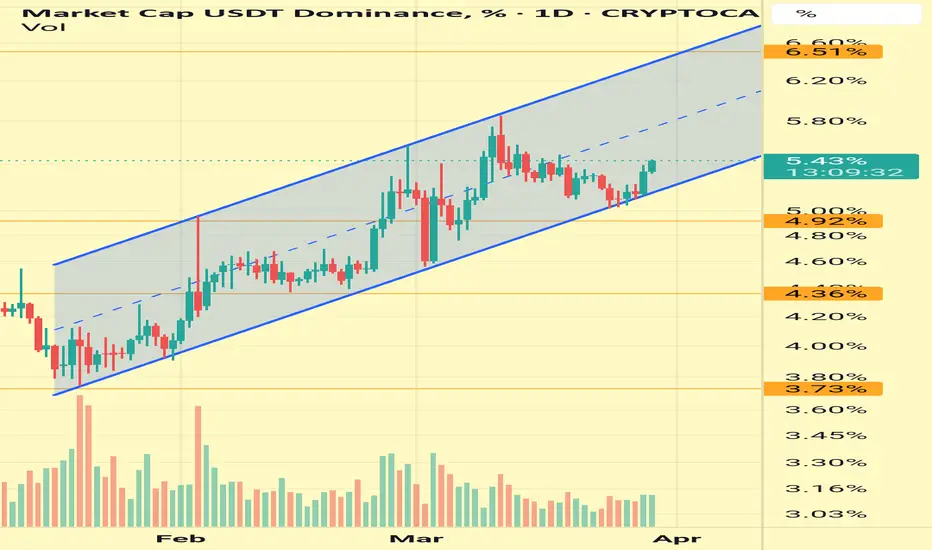
Why the rise of Bitcoin is temporary every time?!The Dominance Tether chart, which acts against the direction of the market, has formed an ascending channel in the last three months at the same time as the bit fell from its historical ceiling, and after every correction and hitting the bottom of the channel, the trend is upward again, and on the opposite side of the falling market, until Dominance Tether breaks this channel down, any rise in Bitcoin will be temporary.

USDT Dominance 4 HourThe chart is self explanatory.. The next candle will conform the short term trend.
Place your entries in ALTS having RSI breakout or divergence i:e WIFUSDT
Manage your risk.
Not a Financial Advice

$USDT.DCRYPTOCAP:USDT.D
shows whether people are now buying crypto for stablecoin, or whether they are selling their alts/ CRYPTOCAP:BTC and switching to usdt.
I don't want to get my hopes up too high but there could be a reaction from here

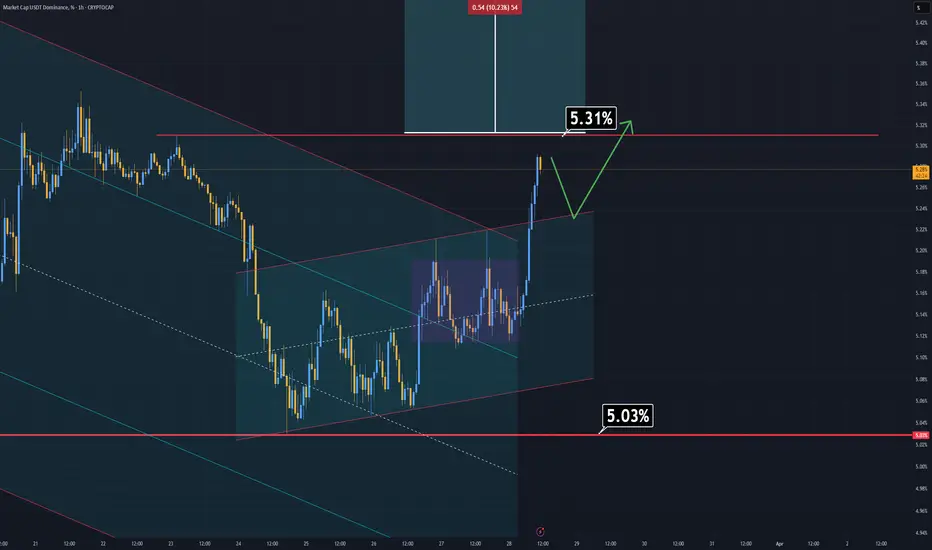
USDT.D update (1H)USDT.D has vioalated the previous analysis. It's breaking out the parallel channel which may engage a bullish flag pattern to activate.
As an extra, there will be PCE reports coming soon. If you see green candles on assest, don't dive in to long positions blindly.
Many of the parameters and signals are showing that prices about to go cheapher.
Market might be about getting close to another crash!
USDT.DOMINANCE 4HOUR CHART UPDATE !!A downward trend in USDT dominance typically signals growing confidence in riskier assets (such as Bitcoin and altcoins), as traders move funds out of stablecoins and into crypto investments.
Breakout Attempt
The latest price action shows a breakout from the descending channel.
This signals a potential reversal, during which traders may return funds to USDT due to market uncertainty or a correction in crypto prices.
The black line forecasts a strong upward move in USDT dominance.
If this happens, it could indicate that investors are selling crypto holdings and moving funds into stablecoins in anticipation of a market decline.
If you found this analysis helpful, hit the Like button and share your thoughts or questions in the comments below. Your feedback matters!
Thanks for your support!
DYOR. NFA

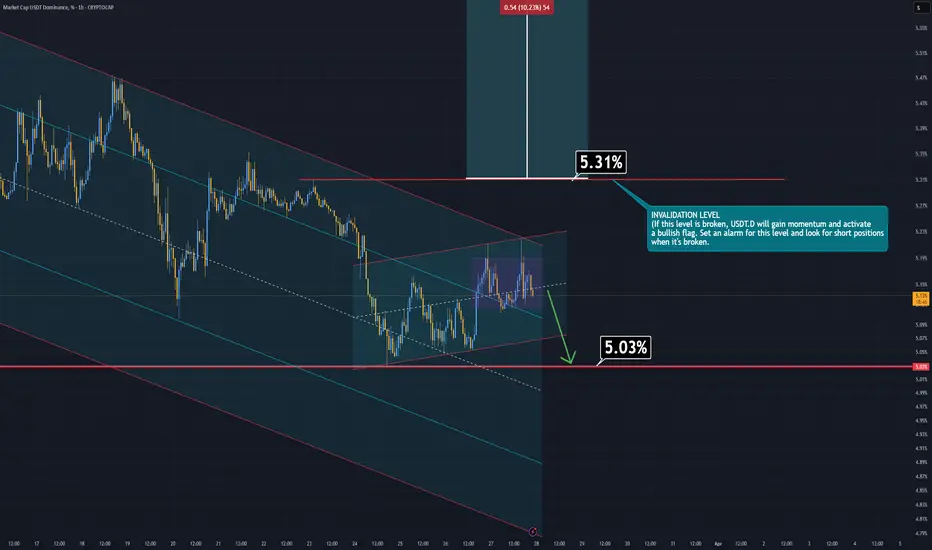
USDT.D short term wievUSDT.D is moving in a parallel channel. It's also forming a bullish flag which is bad for the assests unless its invalidated. For a shorter wiev, it's moving in a rectangle and I'm expecting a move towards downwards.
For a longer wiev, keep an eye on the levels I marked on the chart. The level of %5.3 is strongly important for market.
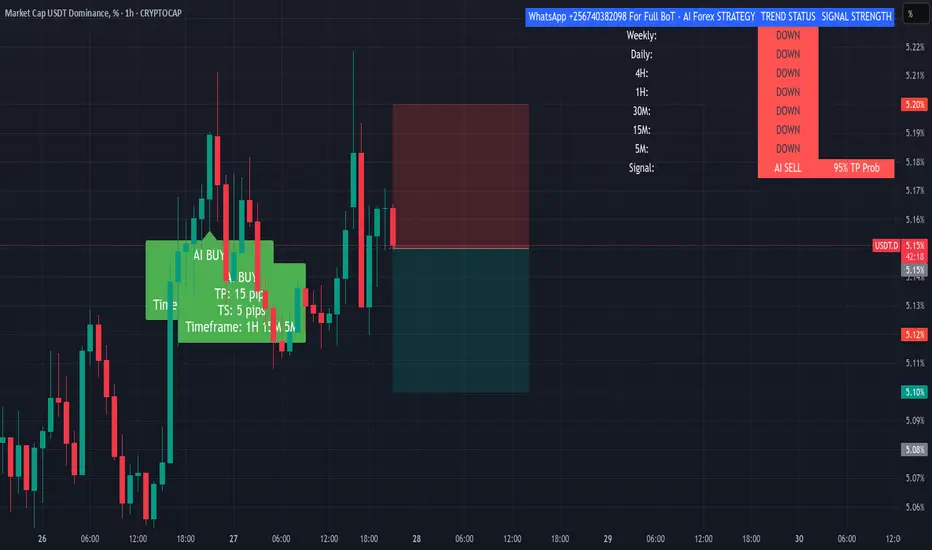
USDT.D SELL30MIN SALE BASED OFF THE AI INDICATOR I PUBLISHED RECENTLY FOLLOW FOR MORE, BY THE TIME OF ENTRY SELL SIGNAL WAS AT 85%
30MIN sale off the ai indicator i published recently, follow for more, by the time of sell entry, the sell signal from the ai was at 85% chances of hitting 15pips however i went more but with caution.
$USDT Dominance BreakdownAfter holding the trendline since late January
(points 1–4) $USDTD just broke below it, and a bearish retest is underway.
If the trend fails to reclaim, we could see dominance drop sharply—possibly toward the 3.9%–4.0% zone. 📉

Bullish! On usdt.d that is Gotta love a good bull trap! Pump it to dump it, bearish scenarios are invalidated at 93k BTC. Targets remain @ 72k, 70k and 68k with a slight possibility of 62k

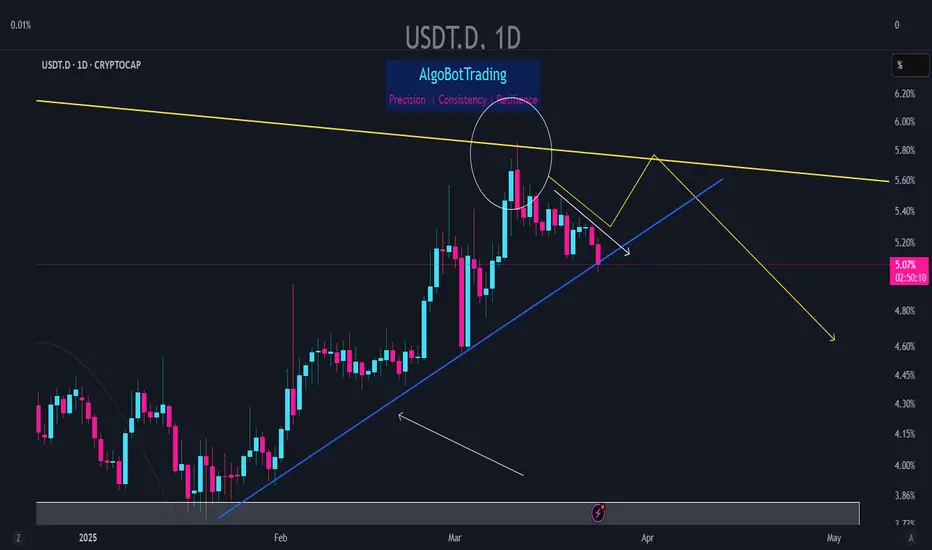
USDT.D update - March 24 2025Following the previous analysis USDT dominance dropped and has now reached the indicated ascending trendline.
Whether it will be supported here (followed by another upward move) or it will cross below the trendline is still unclear and we will have to wait a bit more to see the market's decision and open positions accordingly.
As said previously we don't expect USDT.D to cross above its long term descending trendline therefore we are hopeful for a good drop in USDT dominance and good pumps across the market.
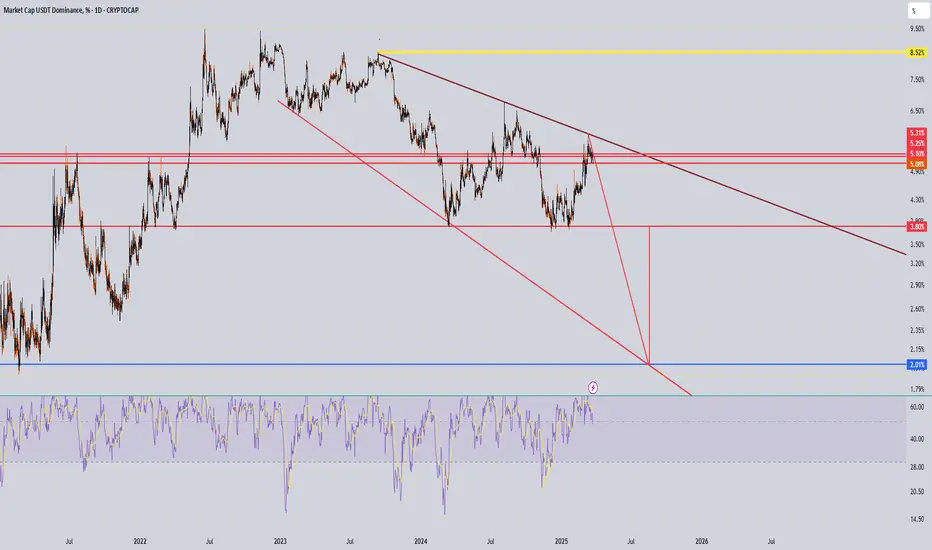
Altseason??? USDT bearish descending triangle!!Hola mamacitas,
If the USDT is bearish then alts will fly. In my opinion the USDT looks super bearis (finaly). It looks like its forming a bearish ascending triangle. If it breaks the 3.80 level we will se an explosive move in crypto. It looks al so good! When it breaks this support the wait for the price to reach the diagonal trendline down there. From there we should exit all our positions in crypto and expect the biggest bearmarket ever. Trade save and let me know what you think!
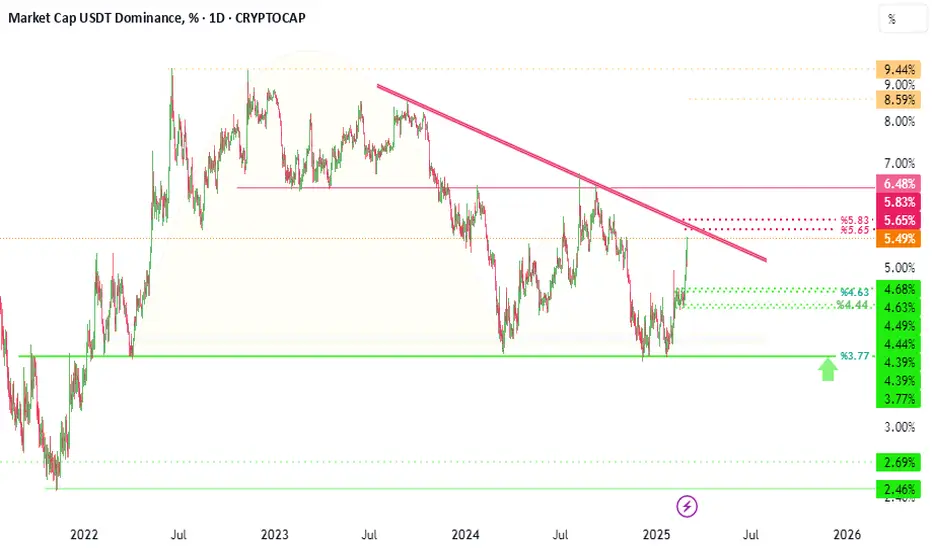
#uSDT.D In my opinion, the red resistance band is the strongest resistance during these past months
and can definitely stop and suppress growth.
A little patience, the sunrise is near
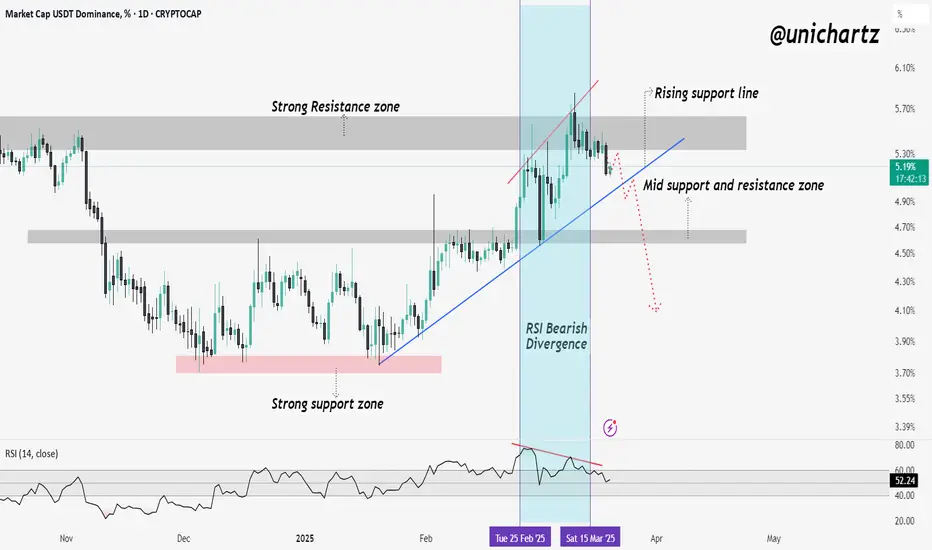
Market Shift Incoming! USDT Dominance Nears Critical Turning PoiThe USDT Dominance (USDT.D) chart is currently testing a strong resistance zone, where price action is showing signs of exhaustion. A bearish RSI divergence has formed, indicating potential weakness and a possible correction. The rising support line has provided multiple bounces, but a breakdown from this structure could trigger a larger downside move.
If USDT dominance falls, liquidity will likely shift into altcoins, potentially fueling a bullish rally in the altcoin market. Conversely, if USDT dominance continues to rise, it could signal increased market fear, leading to further weakness in altcoins.
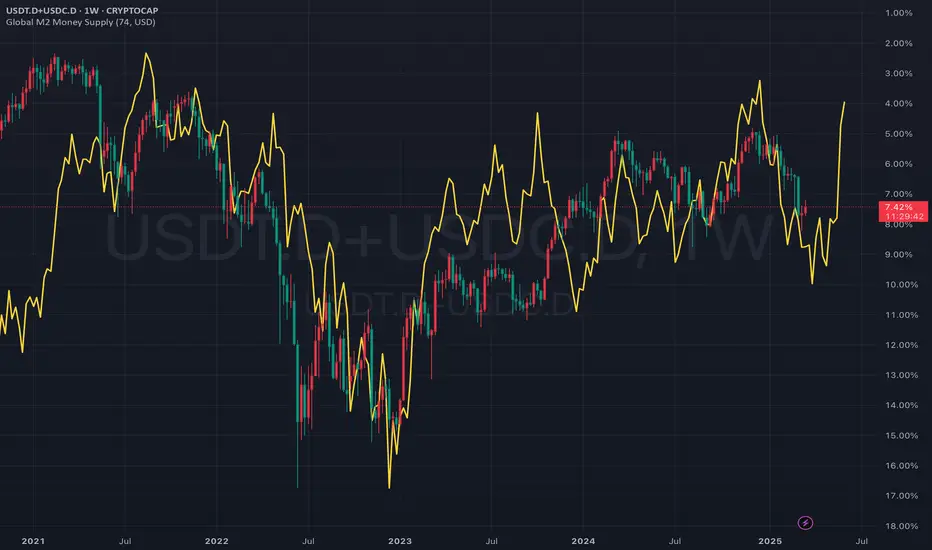
Correlation between Eurozone M2 vs inverse of USDT.D+USDC.DPlaying around with the Global M2 to BTC price correlation idea.
Taking the M2 of only the Eurozone, in USD, with 77 day offset. Plotting against USDT+USDC dominance on an inverse scale (up is lower), we get an even better correlation than Global M2 vs BTC price.
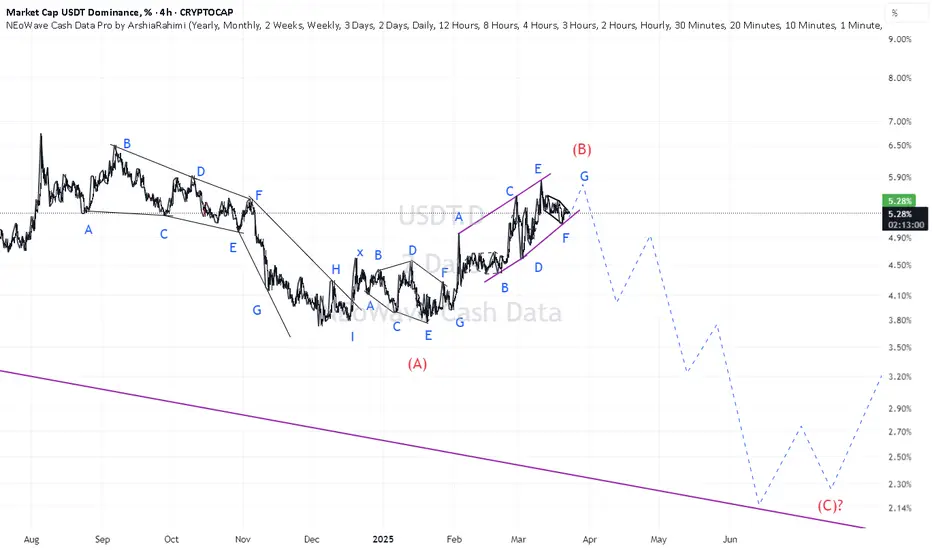
USDT.D(based on NEo wave)The first bearish wave is a complex ( symmetrical and diametrical) which I consider this as A wave and the bullish wave is also a diametrical that I consider this as B wave which is ending and after this we can see a heavy bearish wave which can make ETH above 5000$.
USDT.D ChartLooking at the chart it broke all of our zones after re-testing multible time from them looking at the blue line we should see a reversal from it

bear market confirmationIf the chart will consolidates above 5.81%, i.e. above the sloping downtrend line, this would be an early indicator of the start of a bear market, because this line is global for the current bull market.
The second confirmation will be if dominance will bumped at 3.94 - 4.30% range as wave B and will update the end of wave A.

USDT.DOMINANCE WEEKLY CHART UPDATE. Current Market Structure:
Breakout Confirmation: USDT Dominance has broken out of its descending trendline and is now in a retest phase.
50MA as Support: The 50-week moving average now acts as dynamic support, reinforcing the bullish outlook.
Rejection or Breakout? The price is currently testing resistance. If it gets rejected, a temporary pullback is likely before further gains.
If you found this analysis helpful, hit the Like button and share your thoughts or questions in the comments below. Your feedback matters!
Thanks for your support!
DYOR. NFA
