Called move after move for Bitcoin, what happens next?If you been lucky enough to work out my analysis and pull the trigger on the trade setups that played out over and over again, I commend you for your knowledge of how to read an analysis and then use it to make an informed decision.
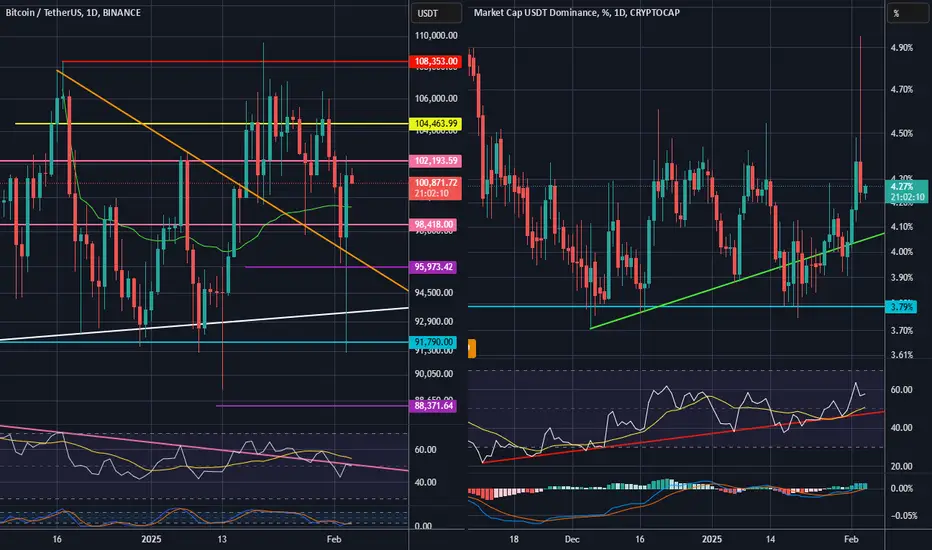
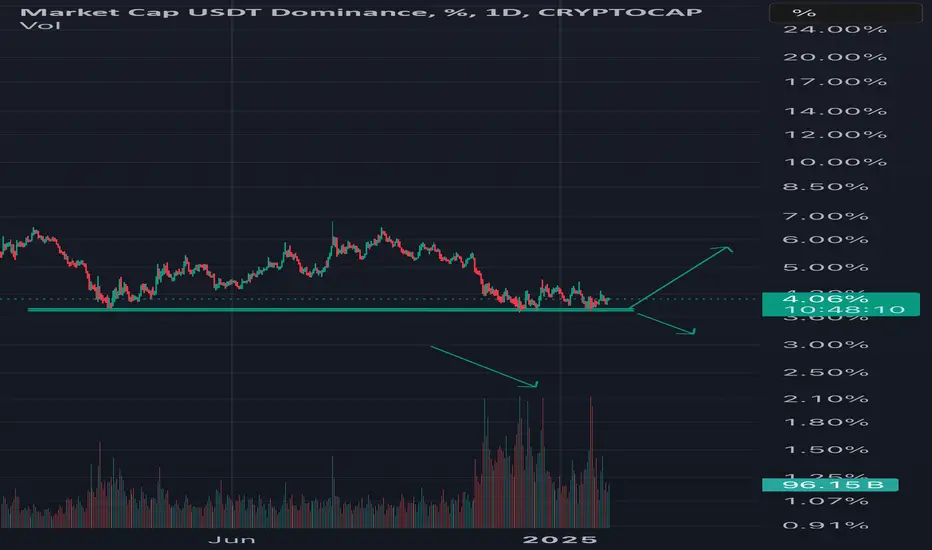
If you caught the last analysis I mentioned about a bear trap spike below the blue line and as you can see it played out. You can see I have removed the green trendline on left chart as it is now done with and the green trendline on the right hand side chart is basically invalidated now.
We see on the left chart the orange trendline is respected with the candle closing above it. The white major trendline also held as major support. You can see the other trendlines still being used, especially on 4 hour timeframe.
So, what now?
We need to watch for the right hand side RSI to breakdown under the red trendline for BTC to get to 108k.
On the left chart the RSI needs to break back above trendline. In regards to the price action, we can see a massive buy up in the crash candle that was just made. Price could move up to 108k from here now there are trapped short traders below. This would put the right USDT.D chart at the blue trendline and as per previous analysis we know what happens if that then breaks below this line.
On the bearish side, if price loses the light green vwap line then expect another retest of the white trendline.
Smash the like button and good luck!
USDT.D trade ideas
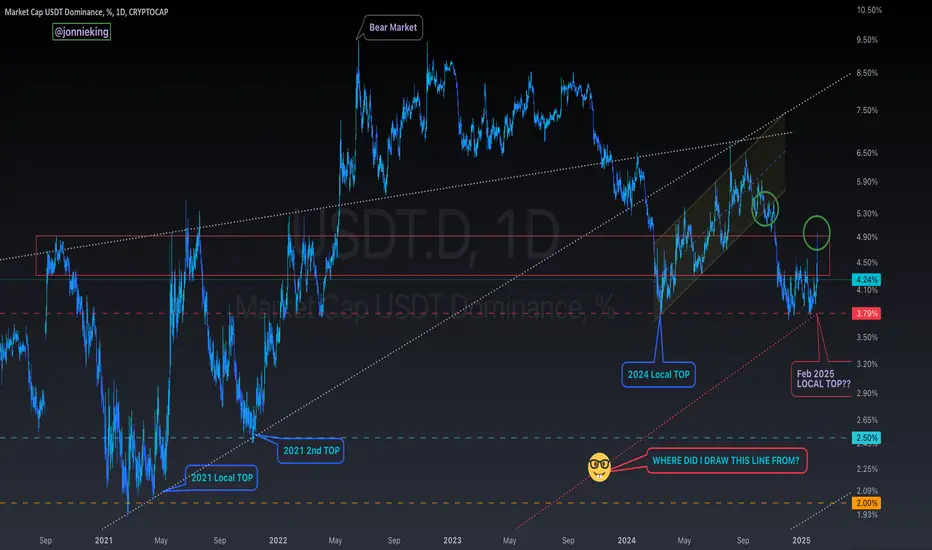
$USDT February Local Top Hit!well well well... look at that.
TA PERFECTION 💯
Should I start charging for my calls? 😂
I couldn't imagine anyone not following my account at this point 🧐
(see prior USDT chart for the original call).
Will #USDT continue upward to the top of the channel?Here are my thoughts, If @usdt decide to get back into the big historical ascending channel then it will first touch the top of descending channel which is 6.5% (has strong resistance here) and then the top of bigger ascending channel which is 10.5%, if not and fail to get back into the channel (and yesterday's rally was just to fill the gap in weekly chart) then a bull-run is yet to come after breaking the strong support of 3.76% to touch the bottom of of the descending channel 2.9% ish, the Stoch RSI is also looking bullish in Weekly! We're in a critical zone that's why we go up and down these days!
#USDT @USDT

USDT DOMINANCE Update (8H)Wave G extended, and the market maker executed the worst-case scenario.
As it hit the resistance zone, a very heavy rejection is expected. Keep in mind that reaching the lower green zone will take several months, with significant fluctuations along the way, but it seems to be following the yellow circle.
Both Tether dominance and Bitcoin dominance have reached important levels. For now, the focus should be on looking for buy/long setups on altcoins over the coming months.
For risk management, please don't forget stop loss and capital management
Comment if you have any questions
Thank You

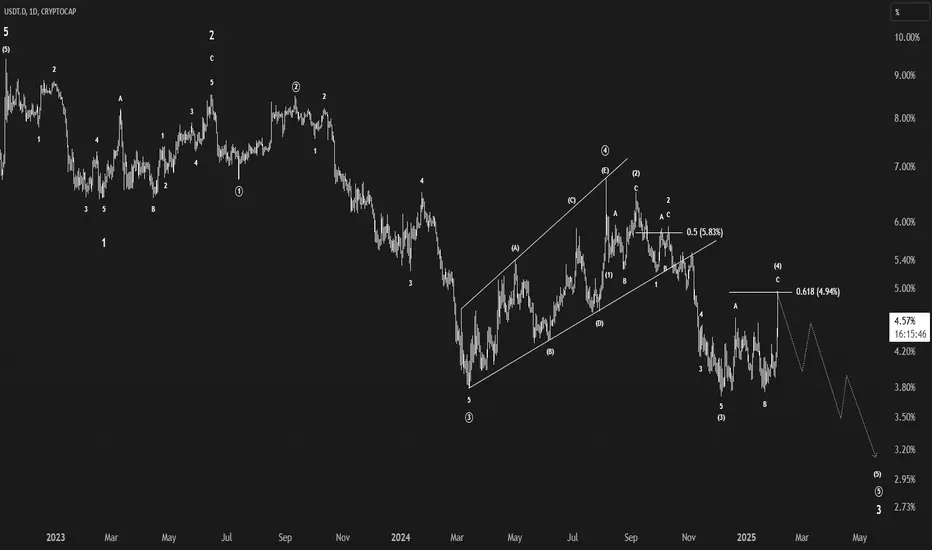
USDT DOMMINANCE update#USDT.D made a triangle for a rise !
the first wave without a LL can be the 1st wave
after that a triangle with 5 waves like ABCDE can be the 2nd wave
after breaking the high of the D wave we have the confirmation to rise !
this means alot because this move can make the whole market bearish !

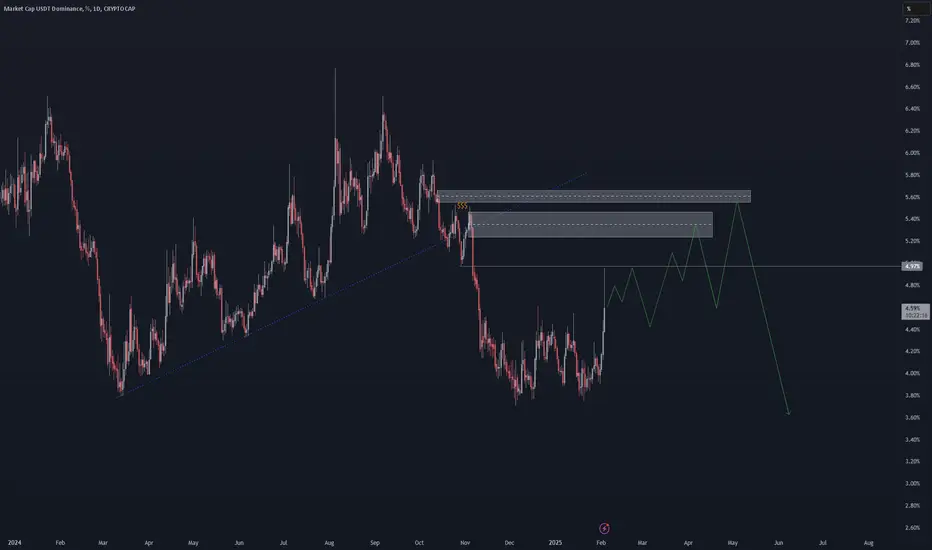
ALT SEASON IS COMING !#USDT.D hit a huge supply zone as i told it before this supply zone was naked so it was attracting the price to its self but now the liq is getting out of USDT and going to the coins which can be alt coins or the main coins if BTC.D become bearish so the whole atlcoins will rise !
check out this analysis :

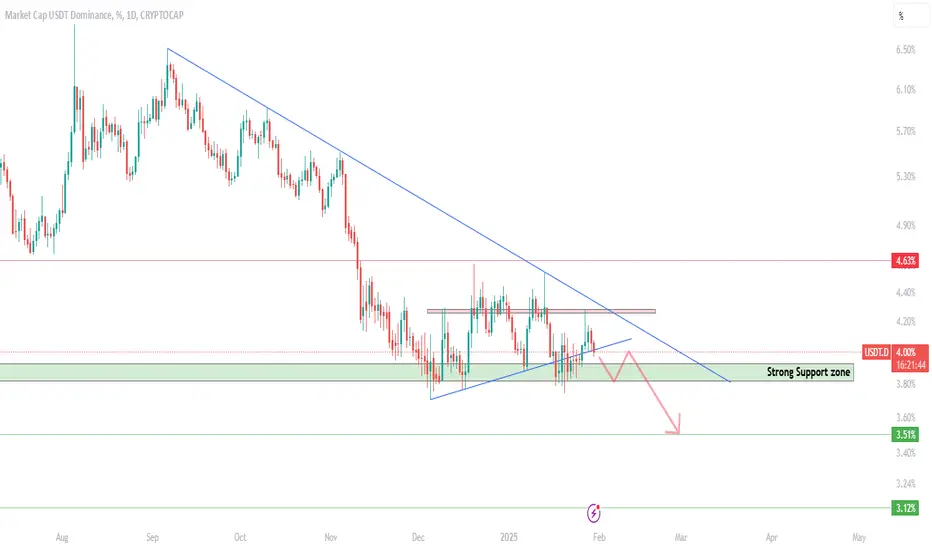
Is USDT.D preparing for another dump?5% is an important resistance; failing to break it can make the dominance reach 2.5% to complete the pattern. Breaking 5-5.22% might result in a double top or a new high; both would be bad for the crypto market.

USDT.D: Roadmap for Crypto MarketHi Guys,
As I have mentioned many times, the crypto market is no longer in a bear market. One of the best indicators for analyzing this market is Tether dominance. According to the chart analysis, I can imagine lower prices for Bitcoin, maybe we will have a look at the $75,000 range in Bitcoin, and continue to follow my analysis of Bitcoin.
SecondChanceCrypto
⏰ 3/FEB/25
⛔️DYOR
Always do your research.
If you have any questions, you can write them in the comments below and I will answer them.
And please don't forget to support this idea with your likes and comments.
#USDT.D to Moon very soon Some naive people think that Trump is a savior and a hero who will bring the crypto market to an altcoin season (Alt Season) with his arrival. Unaware that Trump will do something with crypto that will be recorded in history and the Guinness Book of Records, leading to the complete destruction of this market. It all started with his own meme coin, which caused a severe crash in the entire altcoin and meme coin market. The damage he inflicted on the market with his meme coin had not yet healed when he introduced his wife's meme coin. After that, we witnessed the foolish political-economic statements of his son. Now, he has also started a trade war between countries, and its effects are visible in the crypto market. Do not forget what happened toTrump in America after Trump's presidency ended. Now, he is full of resentment and anger and no longer cares about the people. He is doing everything he can to ensure that he and his inner circle accumulate enough wealth and power so that no one can harm him again.
My advice to you is to avoid trading in the futures market for the next three months, or even six months, and focus only on options and spot trading, with Bitcoin being your primary focus, as government entities are also buying it. However, altcoins and meme coins will soon experience a more severe crash, as Trump has proven that he is not someone who solves problems peacefully and always takes the worst possible actions.
Every crisis in the market is not opportunity to exit altcoins and meme coins. Please adapt yourself to the current conditions; it is no longer like previous years, and do not wait for an altcoin season. There is no altcoin season anymore, because in the past, these seasons were due to the limited number of coins in the market, not now when thousands of new coins are created daily, and governments have also entered the crypto market. Any market that governments enter will never benefit ordinary people unless a miracle happens and conditions change, which I doubt will occur anytime soon.
You never thought prices would reach this level, but they did. Do not think that now is a good time to buy, because prices will go even lower, and this is the beginning of a massive crash that will be recorded in history. Also, keep in mind that since government entities and large companies are buying Bitcoin, they will certainly do something to cause its price to drop so they can buy Bitcoin from ordinary people at lower prices.
Ethereum has also proven that it has not had significant growth during this period. Therefore, try to protect your capital until we get through this crisis created by Trump.

USDT.d - What if we getting rick rolled?Hi guys.
The most charts in here what i see is a dropping usdt.d what will bring the flavor for the market to the upside.
But what if getting rick rolled and will see a huge dump?
I expecting a stock market crash soon depens on some metrics. (SP500 can be going nicely down, like other stocks).
This ecomoic/financial crash will also dump crypto, and usdt.d can rise up to 5% and bring us 30% downwards on btc and other coins.
For myself, both 2 scenarios are possible. Its risky actuall.

USDT Dominance is bouncing!#usdt #tether dominance has been defended the support zone very well above green line i drew on chart and now there' s chance that #usdtd may have a hard bounce. The invalidation: CRYPTOCAP:USDT dom. loses the green line with weekly closings.
#USDT Dominance at decisive point. Altcoin Update!Decisive times ahead. If the bulls don't show up tomorrow, things could get pretty bad for many altcoins.
We need this thing to dump which seems likely!
Those holding USDT, start scaling in or wait for a rejection.
Rejection is possible tbh, Let's see.🤞
WAGMI. Stay strong, fellas.
USDT.D - Seems poised for a declineUSDT Dominance seems poised for a decline, which could indicate an upcoming rally in Bitcoin.

Usdt.d. wDominance Tether is likely to rise due to the reasons I will explain below
1.Completing the harmonic pattern
2.rsi divergence
3.We are at the bottom of the descending channel
4.Forming an ascending angle triangle

Tether Dominance - Crypto market under pressureTether dominance appears to be building a floor for growth
With dominance growth, the crypto market is expected to fall
Unless we lose support, then Bitcoin will go up another leg.

Usdt.dThis disgrace has me worried , it just cant break down . Going down means crypto market goes up. And going up means crypto go down . Its been in this range since december . With the prrsident imposing tariffs ln everyone has the markets very nervous . Btc crashing to 92k is very possible if monday the market panics. We will find out if it does crash or not very soon
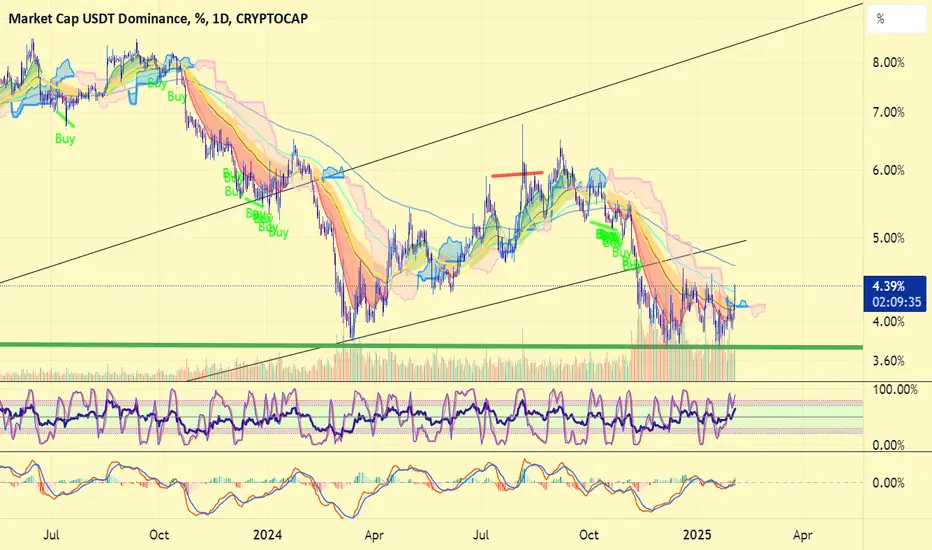
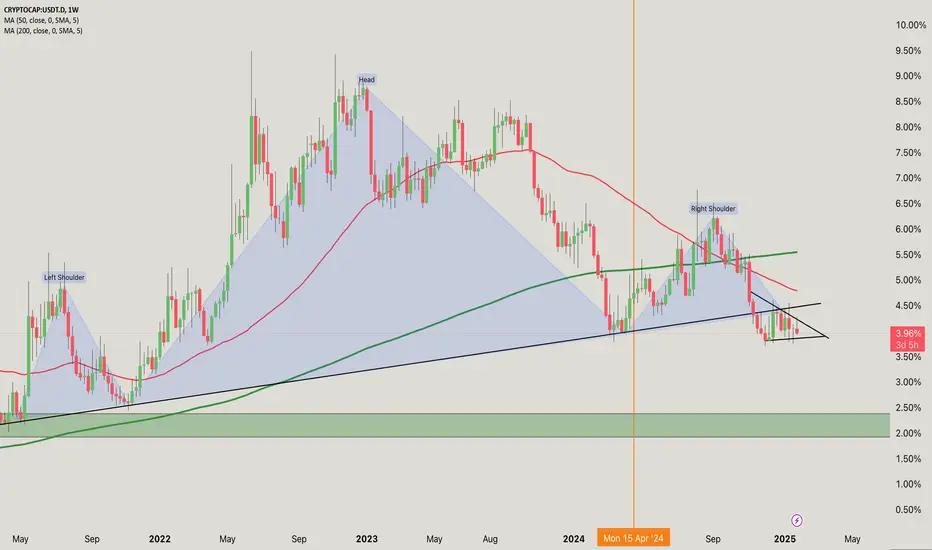
USDTDOMINANCE CHART UPDATE !The chart highlights USDT dominance (USDT.D), which is used to measure market sentiment and money flow into or out of stablecoins such as USDT
The chart shows a completed “head and shoulders” pattern, which is often considered bearish in technical analysis.
The neckline has been broken, indicating the possibility of further declines.
The price appears to be testing a descending triangle, which could indicate a continuation of the decline.
The green area below (possibly around 2.5%-3%) could act as a crucial support if dominance continues to decline.
The 50-day (red) and 200-day (green) moving averages are plotted.
Dominance is trading below both moving averages, which reinforces bearish momentum.
A breakdown of the current triangle could lead to further declines towards the marked support area.
If you found this analysis helpful, hit the Like button and share your thoughts or questions in the comments below. Your feedback matters!
Thanks for your support!
DYOR. NFA
Tether Dominance Update (8H)This analysis is an update of the analysis you see in the "Related publications" section
First of all you should know that "USDT Dominance" is always moving inverse of BTCUSDT .
According to the previous analysis, wave G has formed, and the price is now dropping.
For the next move, there is a possibility of a pullback toward the red box, followed by a deeper correction.
Overall, the price could drop further.
For risk management, please don't forget stop loss and capital management
Comment if you have any questions
Thank You

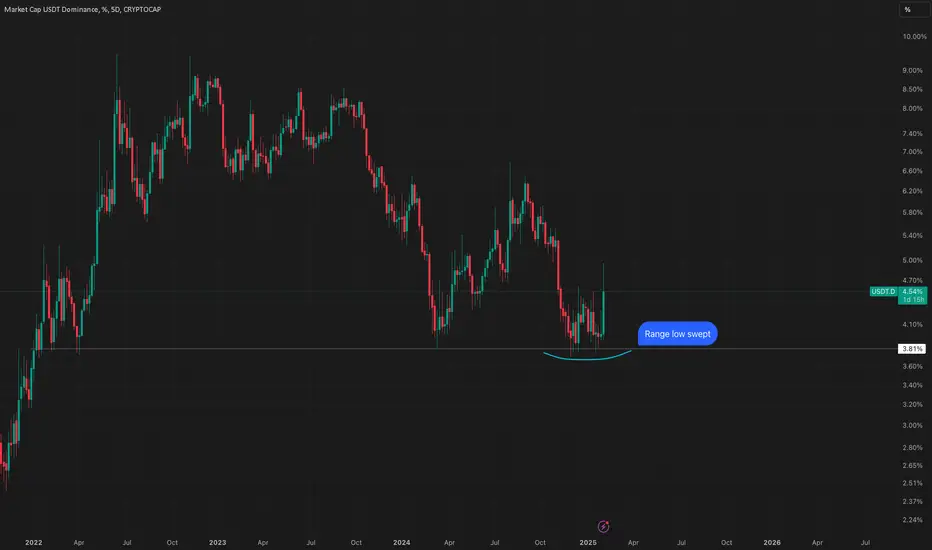
USDT.D, AltsI did not expect to go higher than 4.13%, but uncertainty in the market will lead to more extreme volatility. Everyone is jumpy and on edge.
Hoping to keep it simple and see a breakdown near the next whole numbers. February should be a good month as we travel down to 3%, as the stage is set politically with green lights everywhere. There has been so much capitulation in crypto since November outside of BTC, that we're gearing up for another big run in alts, specifically meme & AI. Research jellyjelly and venmo for the next big narrative.
As an example: ETH has taken a beating and has not been performing, and everyone is grave dancing all over it. Go look up articles from September - it's the same pattern, and the same outcome is imminent. You can see what occurred in the chart :)
It's hard to know, and likely not worth it, to try to predict too far in the future given the anomalies and first precedents we are seeing in governments and currencies this last 12 months that are causing shakeups in the market. If I had to guess a USDT.D roadmap: a move up in March and some consolidation in April/May, then in June/July visiting the 2% level. Very similar to October run up into mid-November with 2 months of consolidation to the point we are at now.
Conviction will pay off, but the game is one day at a time. When emotions are high, expressed through price action, it can be best to take the place of the observer and sit on one's hands.
#SUI When you want to trade scalping, you should always view these four charts side by side at the same time. It can really help you identify the direction of the trend.
USDT.D
*When it goes up, coins are falling.
S&P 500
*When it goes down, it means capital is being withdrawn from the market.
TOTAL2
*When it goes down, it means capital is being withdrawn from altcoins.
NASDAQ 100
When it goes down, it shows that important stocks in the market are falling, it means that fear has been created, bad news has come, and when important stocks in the world fall, it has a great impact on the crypto market.

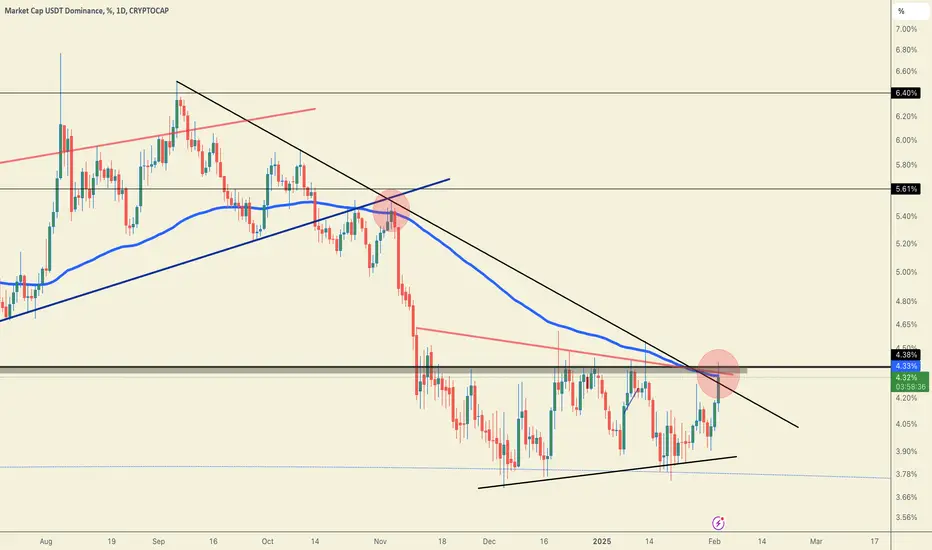
USDT dominance on verge of breaking down!!Join our community and start your crypto journey today for:
In-depth market analysis
Accurate trade setups
Early access to trending altcoins
Life-changing profit potential
Let's analyze USDT dominance :
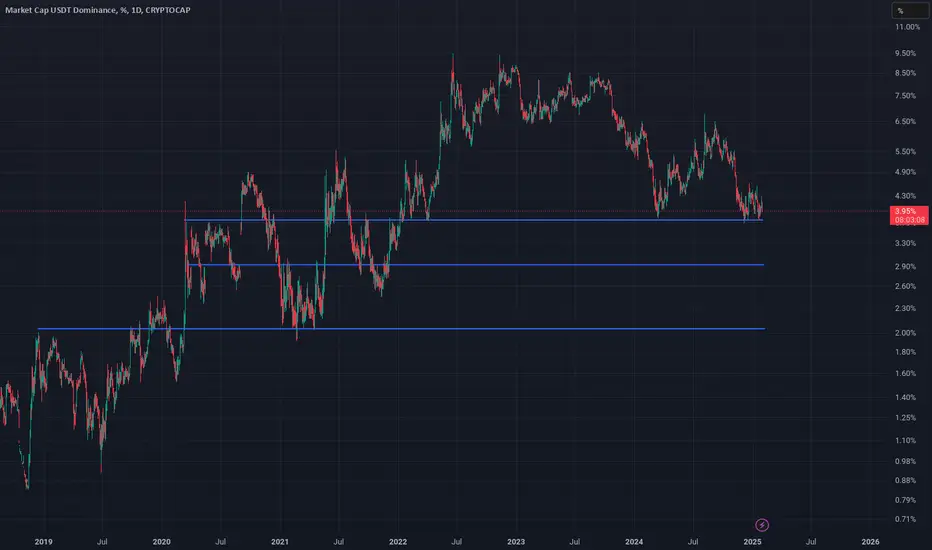
USDT dominance (USDT.D) recently failed to break below its support level of 3.83%. This failure led to a surge in USDT.D, pushing it up to the 4.28% level. However, it encountered resistance at 4.28% and was subsequently rejected, returning to the 3.83% support level.
A sustained break below this 3.83% support level, confirmed by a daily close below it, could potentially trigger a significant upward movement for Bitcoin (BTC), possibly leading to a price target of $120,000.
Support Levels:
3.82%
Resistance Level:
4.28%
If you find this analysis helpful, please hit the like button to support my content! Share your thoughts in the comments and feel free to request any specific chart analysis you’d like to see.
Happy Trading!!