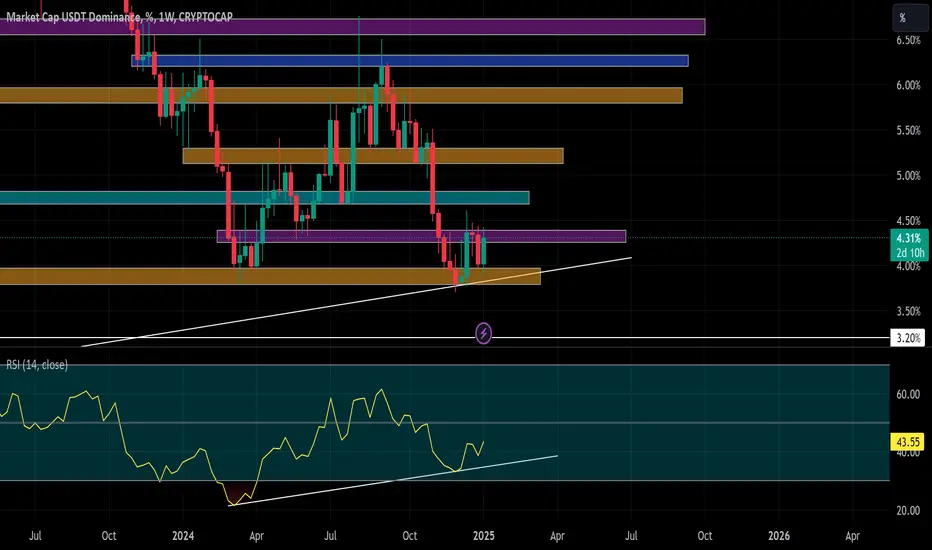
USDT Dominance Road Map: Crypto Market Cycles📌 USDT Dominance Prediction: Crypto Market Cycles 🔵
🧭 Roadmap Overview:
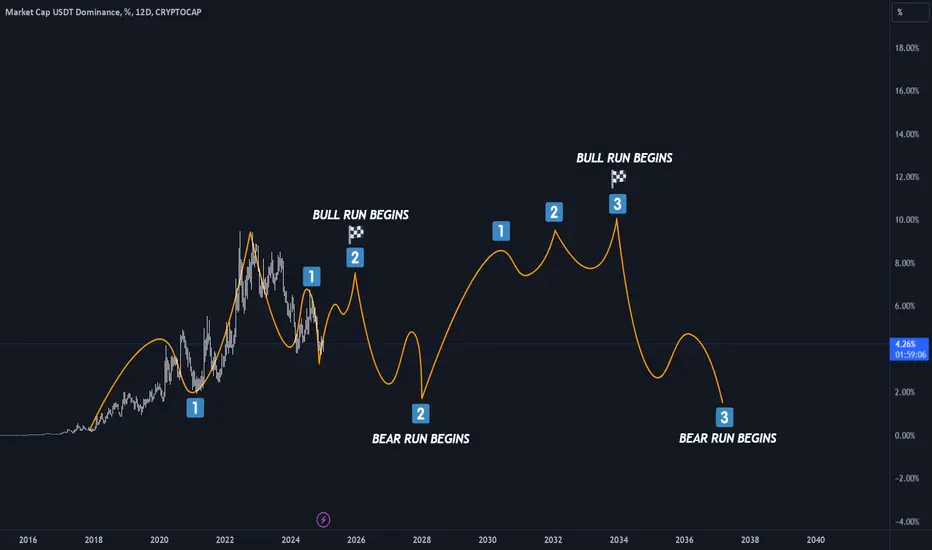
This chart maps out the cyclical nature of USDT dominance in the crypto market, which reflects investor sentiment and capital flows between stablecoins and risk assets like Bitcoin and altcoins.
USDT Dominance represents the percentage of the total crypto market cap held in Tether (USDT). When USDT dominance rises, it typically signals a bear market as investors move to stablecoins for safety. Conversely, when USDT dominance falls, it signals a bull market, as capital flows into riskier assets.
🔎 Historical Cycles & Trends:
1️⃣ 2018-2020 Bull Run (USDT Dominance Falls):
During this period, we saw capital flowing out of USDT into BTC and altcoins, fueling a bull market.
2️⃣ 2021-2022 Bear Run (USDT Dominance Rises):
Following the crypto crash in 2022, USDT dominance spiked as investors fled risk assets.
3️⃣ 2024-2025 Bull Run (USDT Dominance Expected to Fall):
We are now entering a new bull market phase, with the Bitcoin halving in April 2024 acting as a major catalyst.
🧩 Where We Are Now:
USDT Dominance is currently at 4.25%. Based on historical patterns:
I expect USDT dominance to fall over the next few years, signaling the start of a new bull run in crypto.
The next bear market will likely begin after 2028, as USDT dominance starts to rise again.
⚡ How USDT Dominance Impacts the DXY:
Capital Flow from Crypto to USD:
When USDT dominance rises, it means capital is flowing out of risk assets like Bitcoin into stablecoins, which are backed by USD reserves. This inflow into USD can strengthen the DXY in the short term.
De-Dollarization Risks:
If crypto-native stablecoins (like DAI or even future decentralized stablecoins) gain adoption, they could bypass the USD entirely, reducing demand for USD-backed stablecoins and weakening the DXY.
Cross-Border Payments with Stablecoins:
As stablecoins become more widely used for international settlements, they could start to replace traditional SWIFT payments that rely on USD reserves, further reducing the need for the dollar in global trade.
💬 Do you think crypto adoption could challenge the dominance of the USD and impact the DXY? Let me know your thoughts below! 👇
#DXY #USD #Crypto #USDT #Stablecoins #Bitcoin #DeDollarization #Forex #Trading #MacroAnalysis #BTC
USDT.D trade ideas
btc usdt 2hDominance Tether moves in this area as suffering
I see the marked areas from top to bottom and we have to wait to see from which side the marked triangle breaks
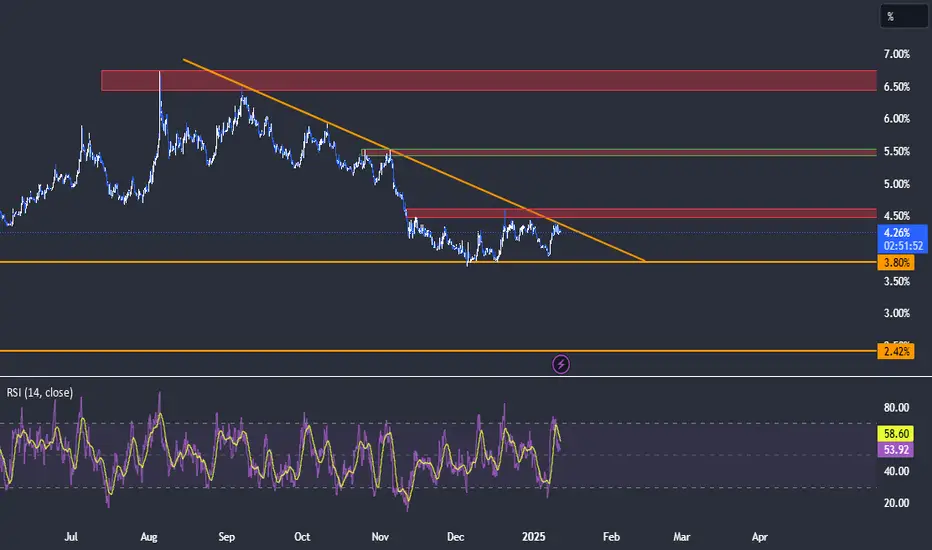
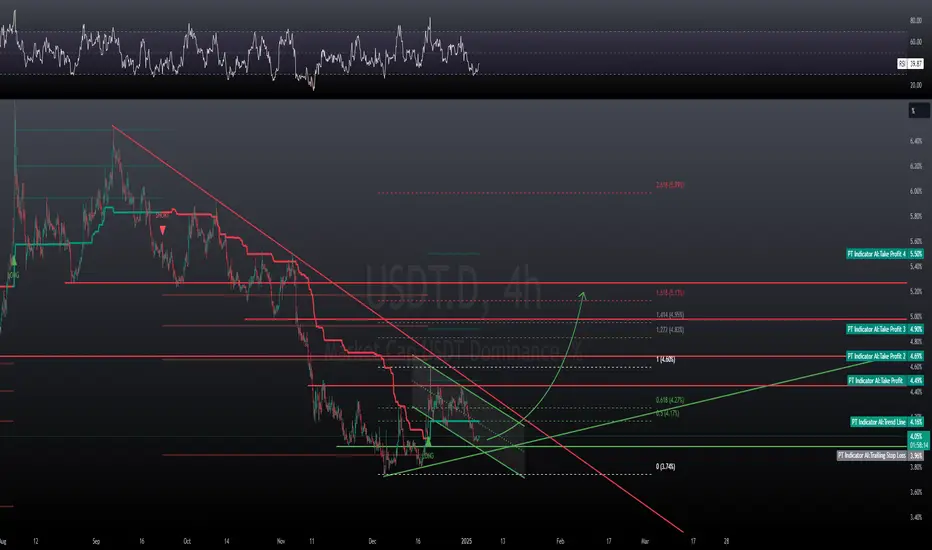
USDT dominance (USDT.D) : WEAKENINGTechnical analysis appears to indicate a bearish outlook:
Rising Channel Pattern:
The dominance is trading within a rising channel indicative of a potential breakdown if the price loses support at the lower trend-line.
200 Moving Average:
The dominance has been consistently trading below MA, acting as resistance. The trend remains bearish as long as it stays under this zone.
Expected Breakdown:
The projection is USDT.D possibly moving up to test resistance and then sharply declining to break below the lower trend-line. This suggests a decrease in USDT dominance, which typically corresponds to bullish momentum in crypto markets nearing Trump's inauguration.
Support Zones:
Watching for a clear break below the lower trendline, as it could confirm the bearish scenario.


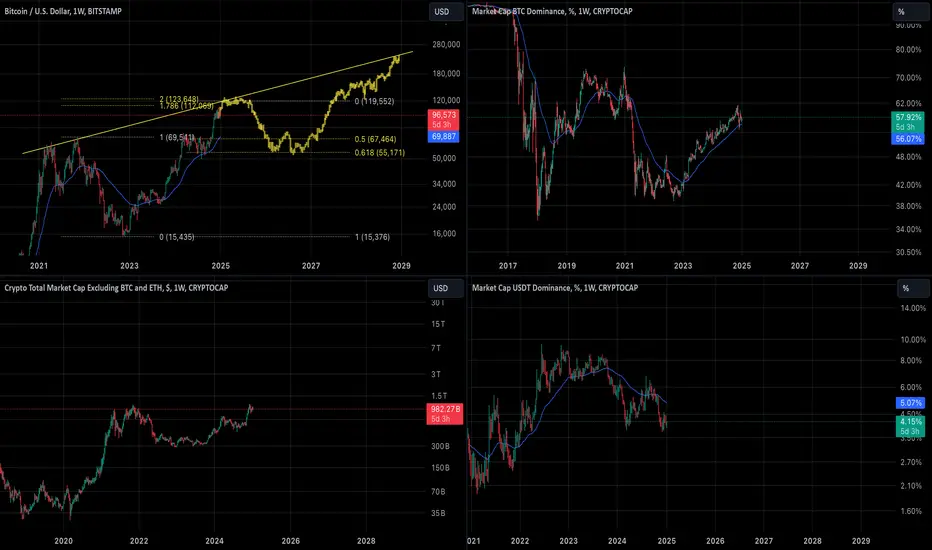
USDT DIn the Bitcoin/US Dollar Index (BTC/DXY) chart, an intriguing scenario is unfolding. Bitcoin has lost its 10-week moving average (MA) as support, signaling potential short-term weakness. However, the key support lies at the 21-week MA, currently positioned near the 78,000 USD level, which also aligns with a critical zone of significant liquidation clusters.
Simultaneously, the USDT dominance (USDT.D) chart shows a bullish divergence, suggesting that investors are reallocating their capital into stablecoins like USDT as a protective measure. This behavior typically reflects market uncertainty and potential for further corrections.
In the BTC/USDT chart, despite losing the 10-week MA, there are still 2 days remaining until the weekly candle closes, leaving room for a potential recovery. A reclaim of the 10-week MA could signal strength, while a close below it may confirm weakness and increase the likelihood of testing the 21-week MA as support.
Traders should closely monitor the weekly close and the interaction between BTC/DXY, USDT dominance, and these critical moving averages to assess the market's next direction.
USDT Dominance Rises: A Warning for Long Positions on AltsStay cautious with your long positions as USDT Dominance (USDT.D) is gaining strength, which is a bearish signal for altcoins
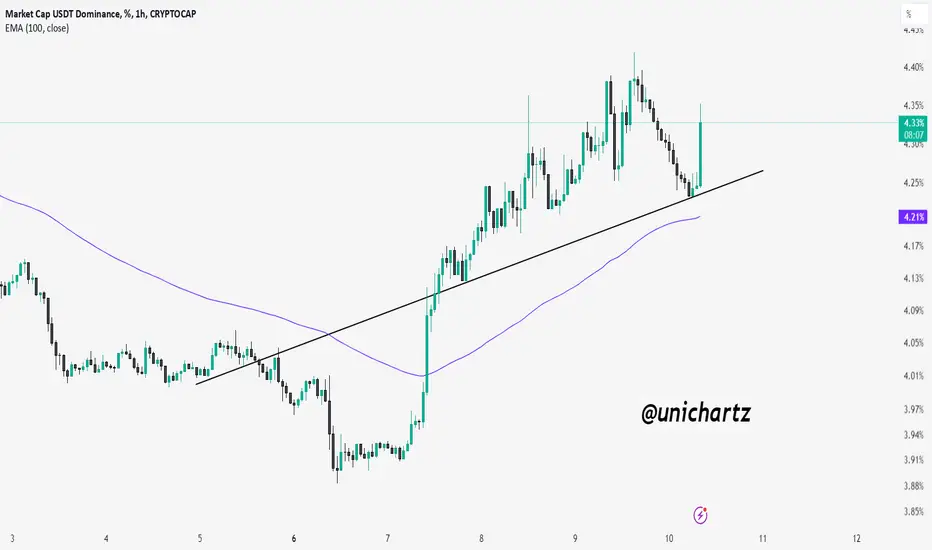
an update on USDT's DominanceCRYPTOCAP:USDT.D
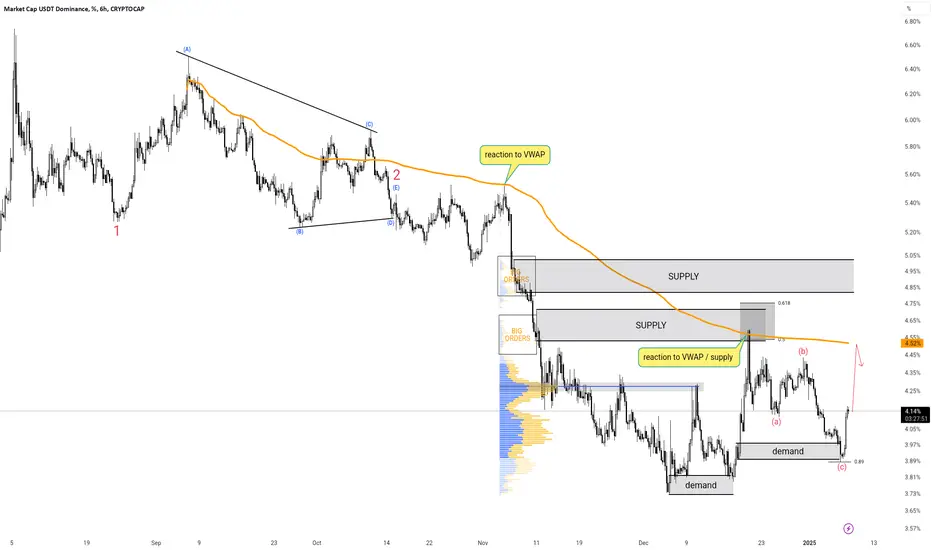
✅ Tether Dominance once again reacted to the 4.40 supply range and broke the hourly uptrend line after consecutive bearish divergences👌
✅ It can currently record a corrective wave to the demand range of 4.10 to 4.16 👍
✅ Tether dominance is also fluctuating in the daily trading range of 3.73 to 4.60, and the next upward wave of the market will begin with the breakdown of the 3.73 support 👌
⚠️ Disclaimer:
This is not financial advice. Always manage your risks and trade responsibly.
👉 Follow me for daily updates,
💬 Comment and like to share your thoughts,
📌 And check the link in my bio for even more resources!
Let’s navigate the markets together—join the journey today! 💹✨

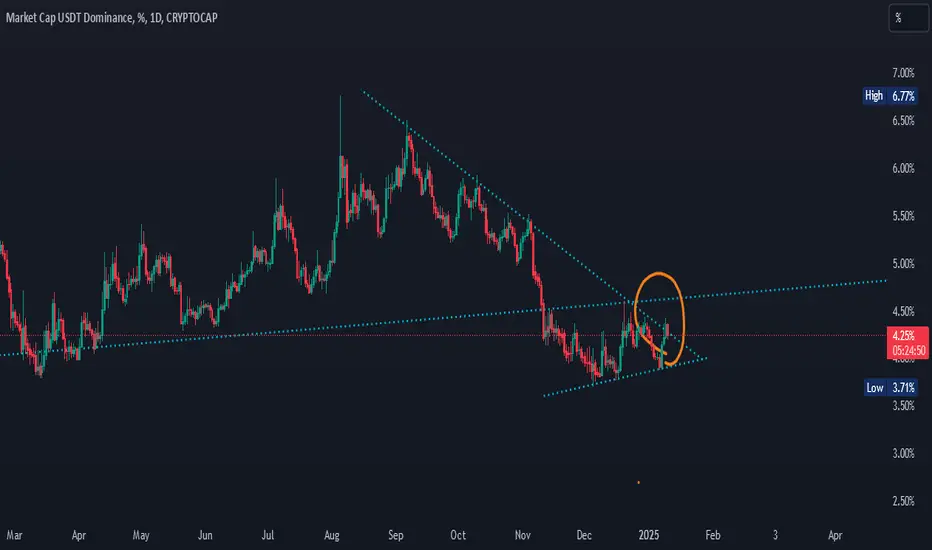
USDT Dominance Nears Critical Point: Impulse Completion or Final
The movement of CRYPTOCAP:USDT.D starting from December 30th appears to resemble an impulsive wave structure. Currently, the dominance of USDT is at a critical juncture, where:
Scenario 1: The impulsive wave may have already completed, which could lead to a correction phase for BINANCE:BTCUSDT COINBASE:ETHUSD and CRYPTOCAP:OTHERS .
Scenario 2: The impulse is still in the process of completing, and we may witness one last push before a correction sets in.
In either scenario, a correction seems imminent in the near future.

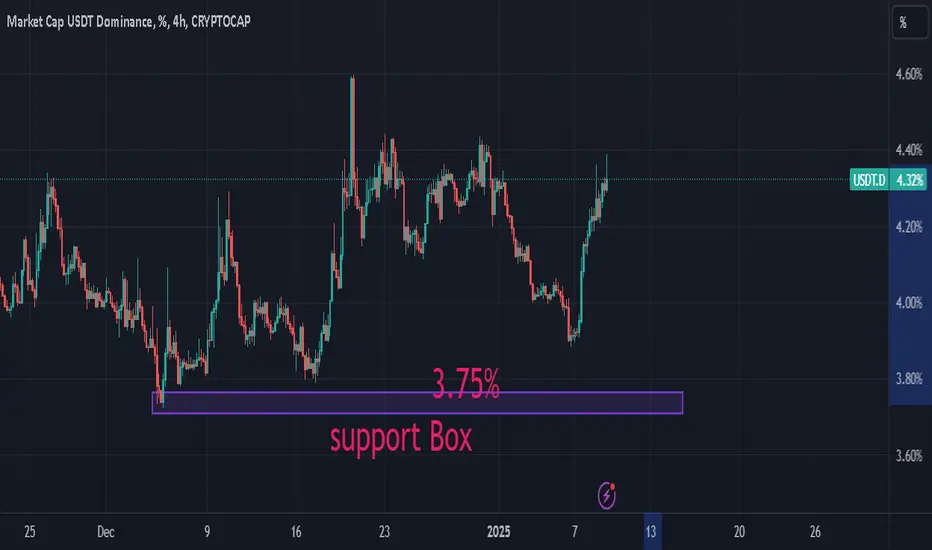
"USDT Dominance Analysis: Potential Reversal from Key Support"On the 4-hour chart, USDT Dominance recently tested the key support box around 3.73% - 3.75%, which has acted as a strong demand zone in the past. After a bounce from this level, USDT.D has risen by approximately 17% over the past few sessions, signaling a potential shift in market sentiment.
Key Observations:
Support Zone: The 3.73% - 3.75% range continues to serve as a significant level where buyers step in, pushing the dominance higher.
Current Resistance: Watch out for the 4.40% - 4.50% range, as it could act as a short-term resistance zone.
What It Means for the Market:
A rising USDT dominance typically indicates increasing market caution, as traders move funds into stablecoins.
If USDT.D continues upward, we might see further corrections or consolidation in major crypto assets like BTC and ETH.
Conversely, a rejection near resistance could signal a return of bullish momentum in the broader crypto market.
Outlook: Monitor the resistance zone closely for potential reversal signals. A breakout above could indicate continued risk-off behavior, while a rejection may encourage a move back toward the support zone.
USDT Dominance Approaching Key Resistance – A Breakout or RejectA breakout above 4.40% could suggest a bearish shift for altcoins as funds move into stablecoins.
However, rejection at this level may lead to another test of the 4.00% support, which could boost altcoin performance.
Traders should watch for volume confirmation and RSI behavior for clearer direction.

USDT.DOMINANCE CHART UPDATE ;-USDT.DOMINANCE CHART UPDATE!
Descending Channel: Dominance is trading within a well-defined descending channel, indicating a controlled downtrend.
Resistance Zone: It is currently approaching the upper boundary of the channel and a horizontal resistance zone near 4.30%-4.32%. This confluence zone could act as a rejection point.
Potential Downside: Failure to break this resistance zone could lead to a downward move toward the lower boundary of the channel, around 3.80%-3.90%.
Bearish Bias: Dominance remains under bearish pressure as long as it remains within the descending channel.
If there is a breakout above 4.32%, it could temporarily turn the sentiment bullish, indicating a reversal or a temporary halt to upward momentum.
Let me know if you’d like further assistance or adjustments!
DYOR. NFA

USDT.D update #USDT.D made a good reaction to VWAP and also the fibo levels I think there's another demand zone below and this demand zone can make the USDT.D rise a little maybe to the higher supply zone or maybe just a small rising we have to wait and see
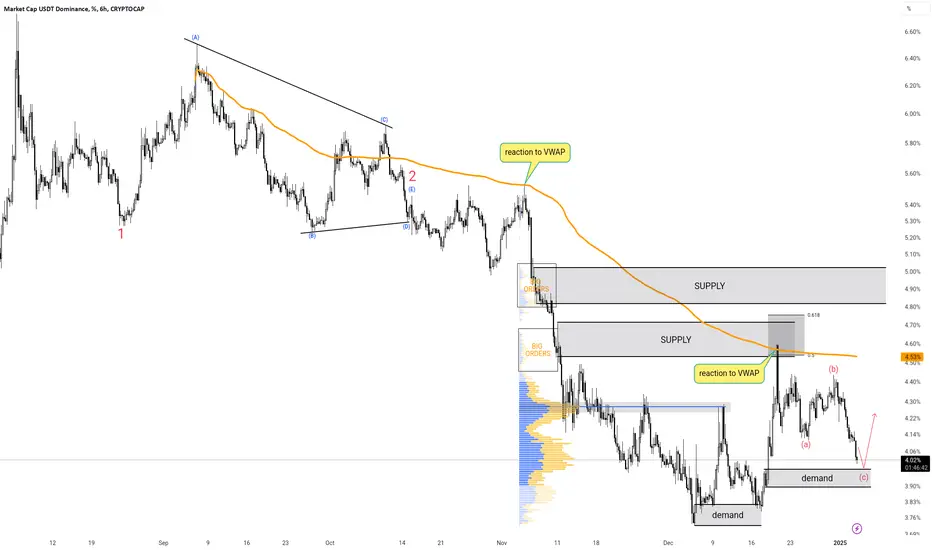
USDT.D update #USDT.D as you can see our demand zone on usdt.d worked and made the whole market drop ! I think this drop can continue until our VWAP stops this dominance from rising !
Capital Shifts in Crypto: Liquidity, Corrections, and the FutureOn a growing market, each correction serves as a mechanism for capital redistribution. In the cryptocurrency sector, where the market is relatively small, profit-taking on major assets like Bitcoin (BTC) and Ethereum (ETH) has a significantly negative impact on less capitalized altcoins.
Analogy with traditional markets
Traditional financial markets follow similar principles. Here, Bitcoin can be compared to gold, while altcoins are akin to stocks or bonds. When positions in gold are closed, the fluctuations are less noticeable due to the market's greater liquidity and volume. However, stocks, with their lower capitalization, show significant volatility, leading to an equivalent increase in potential dollar gains.
Depth and structure of the crypto market
The crypto market still lacks depth, predominantly involving small-scale investment funds by global standards. Competition among expert traders and investors is limited, leading to low profitability or zero gain on bear markets, where professionals trade against each other, for instance, Wintermute traders against GSR traders. In traditional markets, where both professionals and retail investors participate, professionals have an advantage due to more variables.
Liquidity and spread
Both markets allow for earning on the spread, although currently, spreads are relatively small. The redistribution of liquidity, especially during market downturns, is driven by both psychological factors and the technical aspects of position closing, particularly when comparing futures trading with combined spot and futures trading.
Indexation and synthetic assets
The creation of indexes in the crypto sphere could be the next step. There are already examples like Reserve Rights (RSR), where real-world assets are tokenized to create stablecoins. Forming indexes similar to the S&P500 or US100 could combine crypto assets by similar characteristics, increasing liquidity and opening new investment avenues. However, this could lead to issues similar to those in 2007 in traditional markets, where "packages" included high-risk assets.
Conclusion
Implementing such tools might soften the liquidity redistribution effect for retail investors but could complicate things for funds and market makers, reducing their ability to buy assets at reduced prices. The cryptocurrency market is at the stage of mass adoption, and upon completion of this process, new forms of digital money may emerge.
Written by Alexander Kostenich (WIDECHAR),
Horban Brothers.
USDT DOMINANCE NEW UPDATE (4H)By analyzing the chart with the latest data, we observed that after the diametric and upward movements of USDT dominance, this index is now forming a descending triangle.
We are currently in wave d of this triangle.
The green zone is where you should be cautious with your buy/long futures positions.
For wave e of this triangle, it remains to be seen how strong wave e will be. If wave e behaves normally, it should end in the red box, leading to a significant drop in USDT dominance, which could trigger the main altcoin season.
We will follow the market step by step.
For risk management, please don't forget stop loss and capital management
Comment if you have any questions
Thank You

USDT.D is poised for a quick collapseAltcoin season is just around the corner, with all the new USDT being printed to pump altcoins and BTC realizations to further spill over to other assets. USDT.D is waiting for a huge collapse and fall into the 2% area. Let the altseason begin!
Horban Brothers.

USDT DOMINANCE is still bearish ! (4H)This analysis is an update of the analysis you see in the "Related publications" section
According to the previous analysis, the price dropped nicely from the identified supply zone.
In this update, the new supply zone and demand zone have been updated.
The market is expected to continue in a bullish trend.
Let’s see how it unfolds.
For risk management, please don't forget stop loss and capital management
Comment if you have any questions
Thank You

BULLISH USDT.DWe are going to dump.
we are calling dump from 105k !
ITS NOT OVER.
ALL THE FOMO AND MOON BUYS WILL GET HURT !
USDT Dominance at Make-or-Break Zone – Watch for Altcoin Moves!The chart shows a clear descending triangle pattern in the USDT dominance (USDT.D), with the dominance steadily declining and forming lower highs along a downward trendline.
This indicates weakening demand for stablecoins, which often correlates with increased risk appetite in the market as investors shift their funds from stablecoins to altcoins.

Still on track for the break down.The weekly Support will be break if ETH, Altcoins and BTC goes together to All time high. Meaning; Bears are getting Squeeze slowly. They defend their position. They will fight back at one point. Watch out 3.98% and 3.95% as it represent FVG and their Support.

The Big Wedge of this bullrunIt's an Idea from price action from external swings, patterns and liquidity pools heatmap. BTC Could Pump to 140k it seems to have liquidity to reach 128k atm. I believe a bounce of USDT.D is imminent; shorts holder BTC+ETH may have no exit liquidity(BTC below 90K)

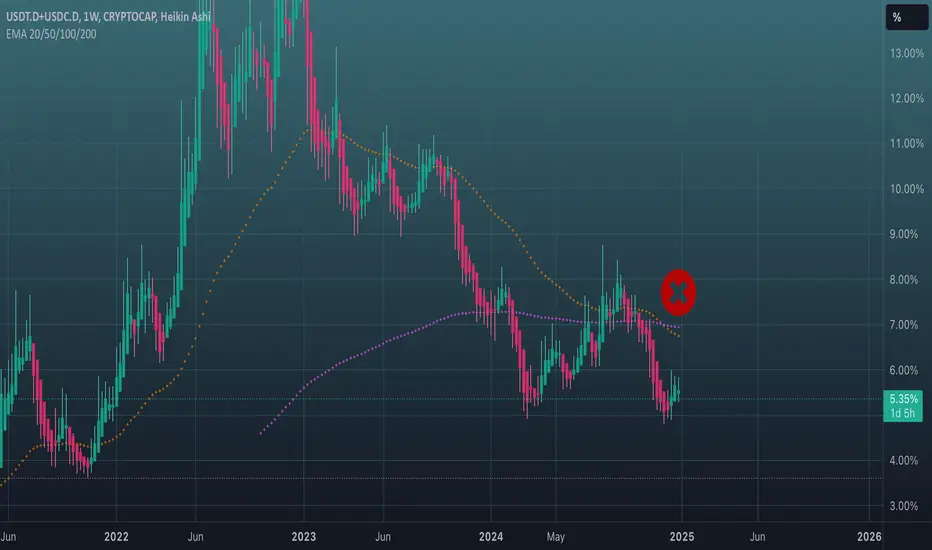
An additional argument for the alt season.Hi. I'll duplicate someone else's observation that a ‘bad cross’
of EMA 200 and EMA 50 has formed on the weekly chart of
the total dominance of USDT and USDC. And it was back in December.
This is a very good argument for TOTAL3 to start getting its share
of capitalisation in 2025.
Gosh, how many conditions are required. Market, political, sentiment, etc.