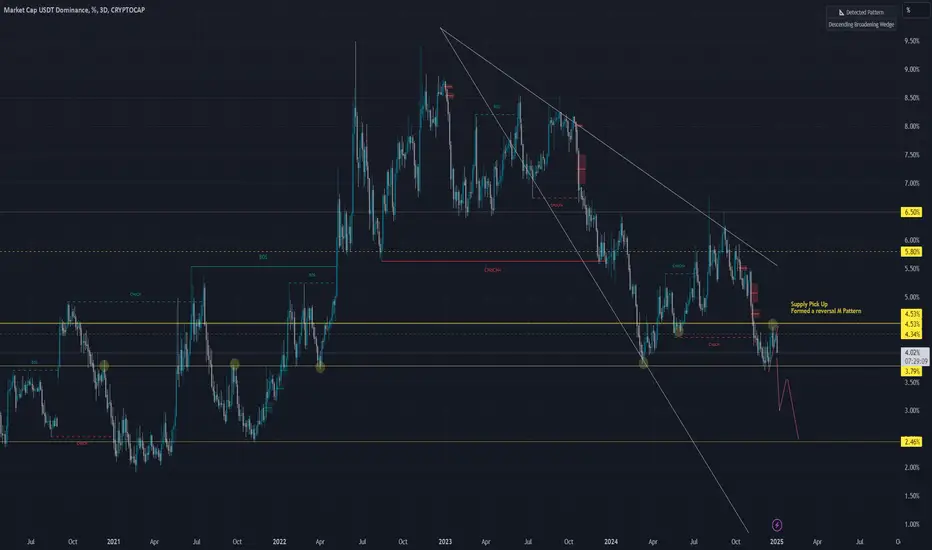
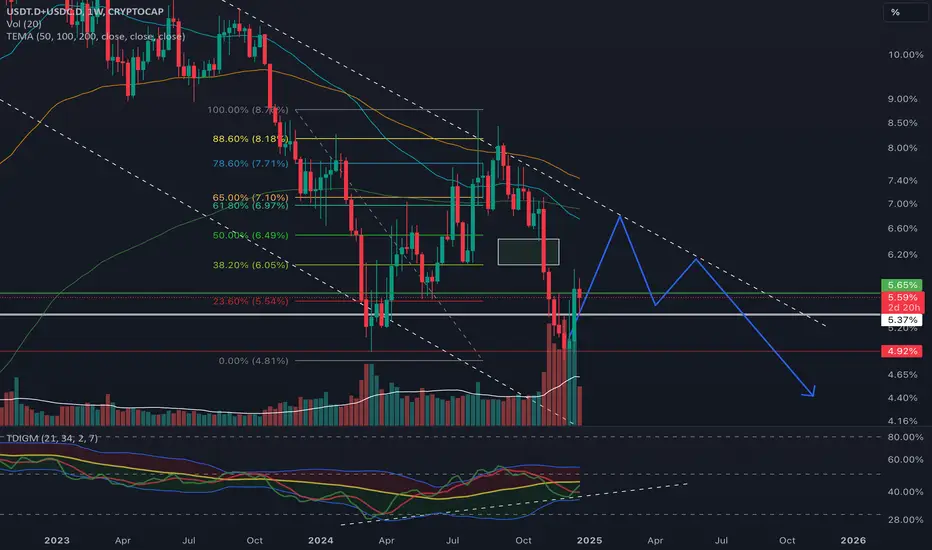
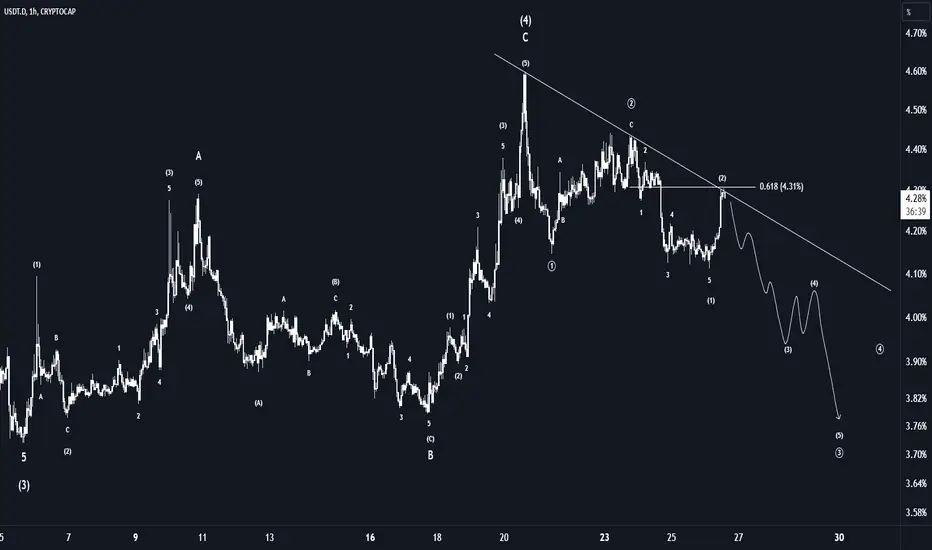
A bounce from the bear incomingI expect a bounce from the bear when USDT will reach 3.95%; that will complete the daily Fair Value Gap + right on the support of the big Wedge;
USDT.D trade ideas

in Line to break the incoming weekly Support; if Market want to break that huge weekly order block; it will need money $ flowing into ETH and Altcoins. Last time BTC paved the path
what can we find about USDT's dominance?CRYPTOCAP:USDT.D
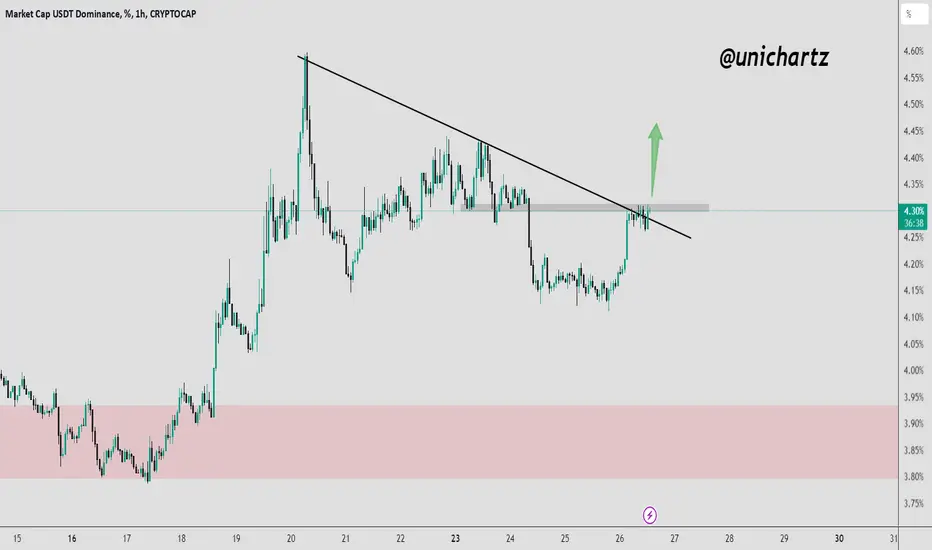
✅ Tether Dominance has also reacted to the 4.40 supply range once again and has broken its short-term uptrend line 👏👏
✅ Currently, with the breakdown of the 4% support, it can move towards the major support of 3.73 again, and with its breakdown, a new downward leg for Tether Dominance will begin 👌
✅ The major supply range for Tether Dominance is currently between 4.40 and 4.60 👍
⚠️ Disclaimer:
This is not financial advice. Always manage your risks and trade responsibly.
👉 Follow me for daily updates,
💬 Comment and like to share your thoughts,
📌 And check the link in my bio for even more resources!
Let’s navigate the markets together—join the journey today! 💹✨

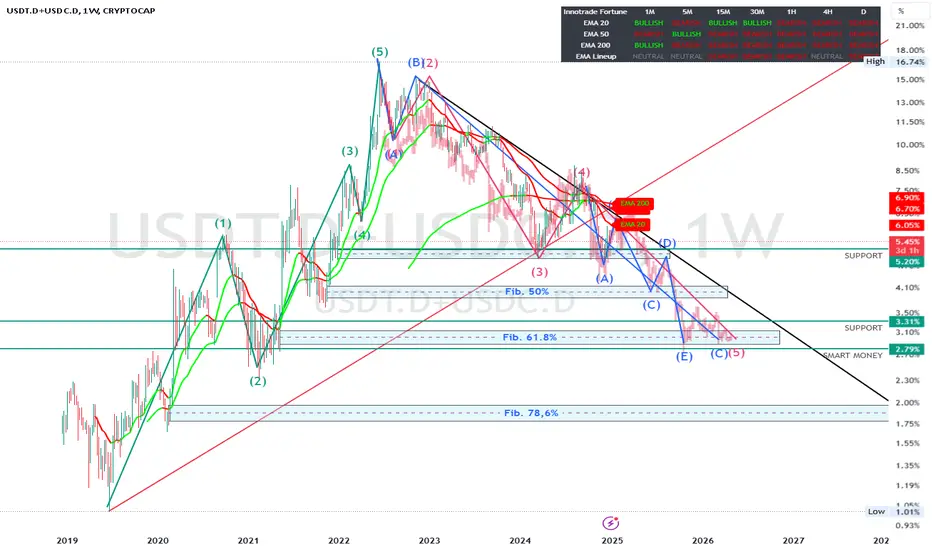
USDT.D + USDC.D GOT RETEST. PREPARE FOR MASSIVE ALTSEASONHi guys,
In this picture you can see USDT.D + USDC.D and I am drawing important support and resistance lines with Elliot Waves. We are now moving from Elliot wave 4 to 5. The last MOVE and after that we will see a HUGE-HUGE correction.
What do I know from the history of crypto bull market?
In previous bull runs, the reactions of altcoins depended heavily on which phase of the Elliott Wave cycle bitcoin was in, so early bitcoin cycles (2013, 2017, 2021).
1st wave (start of uptrend):
Bitcoin dominates the market and altcoins are often flat.
Capital flows mainly into bitcoin.
Wave 3 (strongest bull run):
Bitcoin attracts massive capital and altcoins stagnate or lose market share.
Bitcoin's dominance typically increases.
5th wave (Final push):
Bitcoin peaks and altcoins increasingly benefit, especially smaller coins.
Example 2017: As bitcoin peaked, the altcoin season began (Ethereum, XRP and other major altcoins saw huge gains).
ABC correction:
Bitcoin starts to fall, but altcoins can benefit briefly before the entire market corrects.
FOLLOW AND SHARE!
I can make Video to explain more.
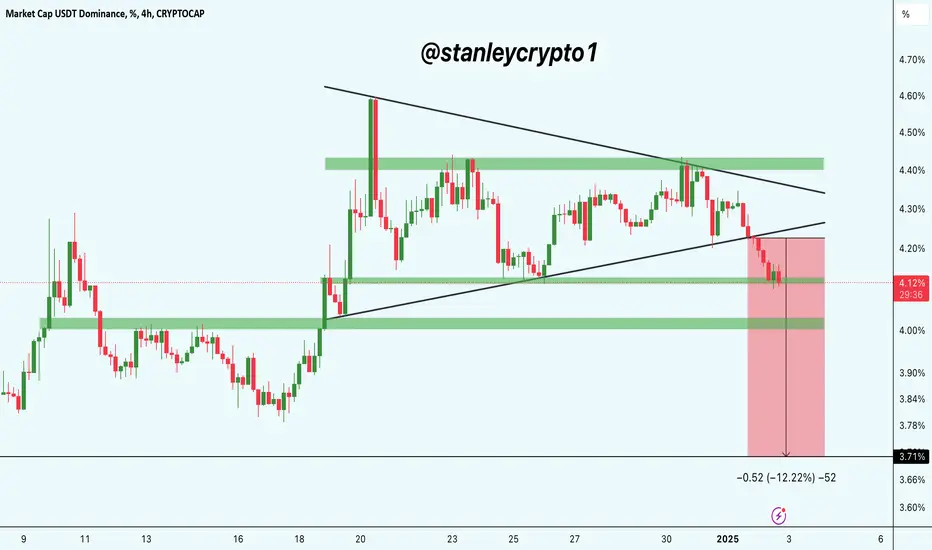
The breakdown in USDT.DThe breakdown in USDT dominance (USDT.D) suggests a potential market sentiment shift favoring altcoins. A declining USDT typically indicates money flowing out of stablecoins like USDT and into riskier assets, including altcoins. With the bearish breakout targeting 3.71%, this could signal increased buying interest in altcoins as investors move capital into the broader crypto market. However, traders should monitor key support levels for confirmation and watch for potential reversals in USD that could impact altcoin momentum.
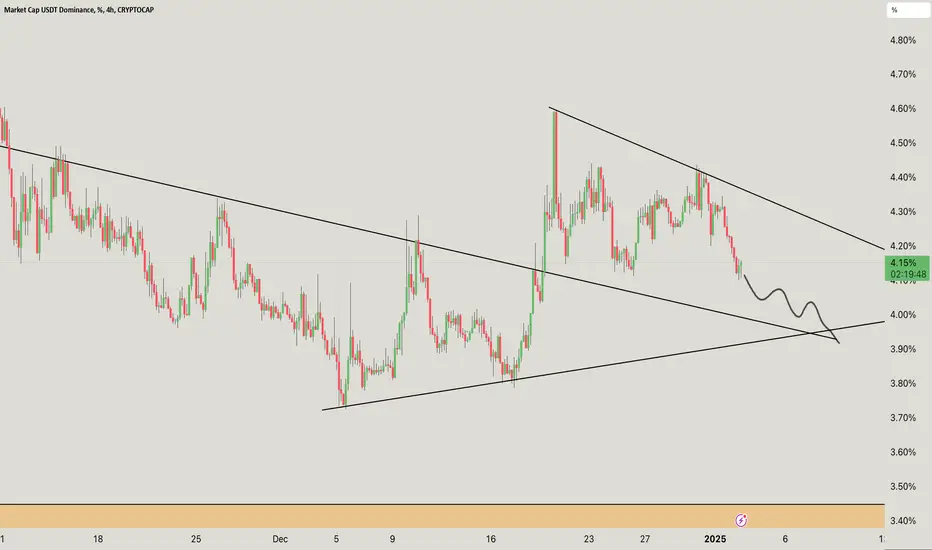
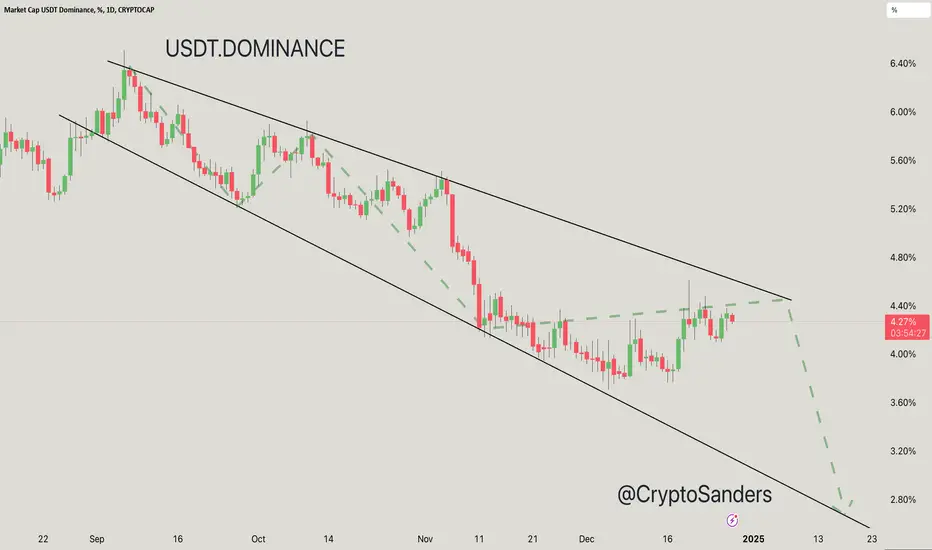
USDT.D Update. USDT dominance (USDT.D) appears to form a descending triangle or wedge pattern, with two converging trendlines indicating a potential breakdown.
The upper trendline is descending, indicating consecutive lower highs.
The lower trendline is relatively flat, but rising slightly.
USDT.D is approaching the lower trendline, indicating potential support.
The path drawn indicates a potential breakdown below the lower trendline.
Downward continuation is anticipated in the orange zone (3.40%–3.10%).
Resistance: ~4.20%
Support: ~3.90% and orange zone around 3.40%–3.10%
If USDT dominance falls, it usually suggests that traders move capital from stablecoins (USDT) to riskier assets like Bitcoin or altcoins, indicating a potential bullish sentiment in the broader crypto market.
Let me know if you’d like further assistance or adjustments!
DYOR. NFA
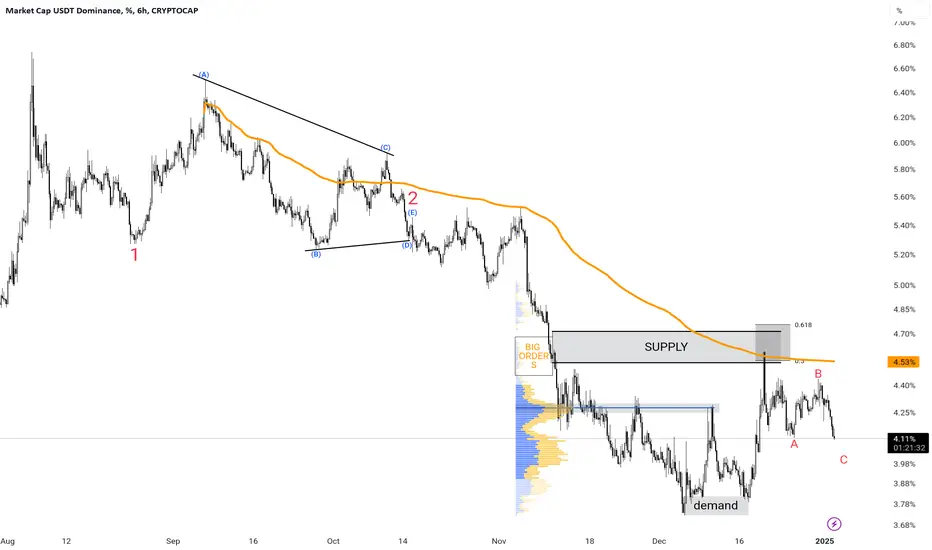
USDT.D update #USDT.D which hit the supply zone is making an ABC pattern for its drop we have to wait and see how the market can respond to this pattern maybe the upper supply is targeted or maybe not
Dreams that we measure with logic 2025; USDT.D BTCUSDT BTC.D Logic says; Coordinates to avoid wandering anxiety; Knowledge, experience and analysis.
Feeling says; Whatever logic says...
USDT.D
D-W; Bearish Flg - Inverted Cup and Handle ( The downward movement is confirmed in my
opinion)
BTCUSDT
D-W; Bullish Flag (The upward movement is confirmed in my opinion)
BTC.D
Bitcoin Dominance has just pulled back to its bearish flag trendline, and will fall.
Altcoins will kiss the moon and pass it.

$USDT Dominance Closed BEARISH on WeeklyCRYPTOCAP:USDT Dominance closed the Week inside this major trading region.
Charts across the board look bearish AF.
I expect CRYPTOCAP:BTC to $91,5 and Alts nuke another 15-20% before take-off 💯

USDT Dominance Chart Analysis. The chart shows a symmetrical triangle formation, indicating a potential breakout scenario.
A break to the downside could lead to a significant decrease in USDT dominance, as the chart’s measured move suggests.
A breakdown from current levels could result in a drop to 18.77%, aiming to move towards 3.50% dominance.
Breakdown Scenario:
If the dominance breaks below 4.30%, expect a drop towards 3.50%.
This could be in line with a bullish scenario for the altcoin, as a decrease in USDT dominance often signals capital inflows into crypto assets.
A move above 4.40% would invalidate the bearish setup and could signal further consolidation or an upside breakout.
A drop in USDT dominance often correlates with altcoin rallies, as traders allocate capital to riskier assets.
Wait for a confirmed breakout or breakdown with adequate volume before entering any position.
Disclaimer:
Chart patterns provide probabilities, not guarantees. Do additional research and ensure proper risk management before taking action.
Let me know if you’d like further assistance or adjustments!
DYOR. NFA

Altcoins Dump as USDT.D Gains Strength: What to Do Next?USDT.D has broken above the symmetrical triangle pattern and is gaining strength, which is a bearish signal for altcoins.
As USDT.D strengthens, altcoins are experiencing a sell-off. It is advisable to avoid opening long positions in the current market environment.
Instead, consider focusing on stablecoin or staying out of the market for a few days to minimize potential losses.

USDT Dominance (USDT.D) Update. USDT Dominance has been trading in a clear descending channel for months, indicating a long-term bearish trend.
Price is currently testing the upper boundary of the channel, which has acted as strong resistance in previous attempts.
Around 4.40%, there is significant resistance formed by the descending channel's upper trendline.
A rejection here could lead to a continuation of the bearish momentum.
Immediate support lies near 4.00%, aligning with the midpoint of the channel.
If dominance continues to decline, the next major support zone is at 3.60%, with further downside potential to 3.20% and 2.80% if the bearish structure persists.
The green dashed lines suggest potential bearish movements if resistance holds, leading to a continuation toward the lower channel boundary.
Let me know if you’d like further assistance or adjustments!
DYOR. NFA
USDT Dominance Rises: Are ALT Coins at Risk?#USDTDOMINANCE Triangle Breakout Confirmed! 🚨
A potential move toward the 4.75% level could be on the horizon, which may result in a sharp decline for ALT coins.
Avoid leverage trading and proceed with caution!
DYOR, NFA
Will USDT.D Rejection Spark an Altcoin Rally?USDT dominance is nearing a key resistance trendline while holding above critical support.
A rejection here could signal increased capital into altcoins, boosting their prices. However, a breakout above the trendline may pressure altcoins further.
Watch closely for the next move!
DYOR, NFA

Crypto Alpha Report - December 27, 2024Friday Alpha Report
2024 12 27
Opening Bell:
As I reflect on this year, and the upcoming year to come, I ask myself the same question many likely are.
“Are we really going to get alt season?”
“Should I really be all-in on alts right now?”
“What if this is the top?”
Specifically with altcoins, I find it’s very helpful to reflect on MARKETCAP, instead of price, as that is the #1 metric IMHO for evaluating how much farther a token can go, and at what levels price taking should occur.
Here are some market caps we reached during the previous bull market:
Cardano (ADA) - FWB:95B (now: $30.8B)
Dogecoin (DOGE) - $88.7B (now: $46.3B)
Solana (SOL) - $77B (now: $94.5B)
Polkadot (DOT) - $56B (now: $10.6B)
Shiba Inu (SHIB) - $41.1B (now: $13.4B)
Terra (LUNA) - GETTEX:41B (now: $307M)
Avalanche (AVAX) - $30B (now: $15.9B)
Cronos (CRO) - $22.7B (now: SEED_TVCODER77_ETHBTCDATA:4B )
Uniswap (UNI) - $22.5B (now: $8.3B)
Chainlink (LINK) - $22B (now: $15.4B)
Polygon (MATIC) - $19.7B (now: SEED_TVCODER77_ETHBTCDATA:4B )
Axie Infinity (AXS) - $10.4B (now: SEED_TVCODER77_ETHBTCDATA:1B )
FTX Token (FTT) - SEED_TVCODER77_ETHBTCDATA:9B (now: $0)
Sandbox (SAND) - $6.8B (now: $1.3B)
These were some of the best-performing coins of the 2020/2021 Bull Market Cycle, with some only reaching their peak market caps in early 2022.
When I look at the current Marketcaps of Crypto today, only the top 11 coins have a market cap over $20B.
Looking back at the 2020/2021 cycle, the top narratives (categories of crypto) were:
Layer 1 Blockchains (Why? Serious need for scaling solutions and cheaper alternatives to ETH)
Layer 1 Blockchains reached market cap highs of $50-90B.
DeFi (Why? Shiny new thing, hype around yield and “safer” way to earn in crypto)
DeFi projects reached market cap highs of $10-20B.
Memecoins (Why? GME/AMC “stick it to the man” movement)
Memecoin projects reached market cap highs of $5-10B with DOGE & SHIB outliers reaching 40-80B.
NFTs & Metaverse (Why? “Mainstream” adoption of digital art/gaming items, hype around metaverse with major brands entering the space)
NFT & Meraverse tokens reached marketcap highs of $5-15B.
Exchange Tokens (Why? Benefits like trading fees/rewards/token burns, increased trading volume during bull market)
Exchange tokens reached marketcap highs of $5-10B.
Well, what are the current narratives poised to erupt in 2025? This is where we enter the realm of speculation, but I would bet the following categories are likely to experience further growth:
AI Agents (current combined MC of $12B, top project MC of $3.5B)
Meme (current combined MC of $105B, top project MC of FWB:46B )
Infrastructure (current combined MC of $45B, top project MC of $13.9B)
DePIN (current combined MC of FWB:32B , top project MC of $3.6B)
Gaming (current combined MC of $24B, top project MC of $2.4B)
Zero Knowledge (current combined MC of GETTEX:13B , top project MC of $2.4B)
Real World Assets (current combined MC of $19B, top project MC of $3.5B)
As you can see, if we see anything like the growth we saw in the 2020/2021 cycle - we are a long ways away from bull market highs, and these sectors have a lot of room to grow. Of course, the challenge as always is conviction. It’s really not timing, for those with a longer time horizon. Often, hyper focusing on the timing just leaves you sidelined. Focus instead on the quality, your conviction, and your targets.
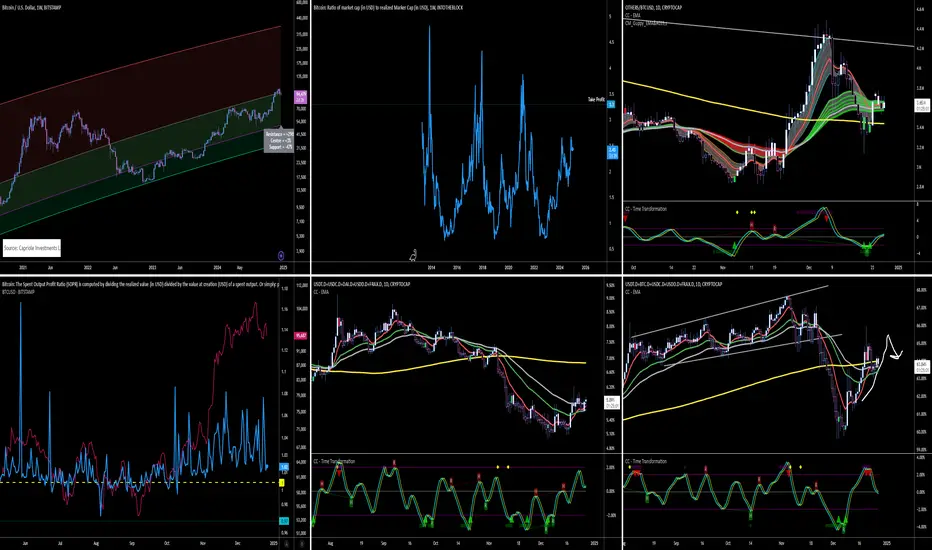
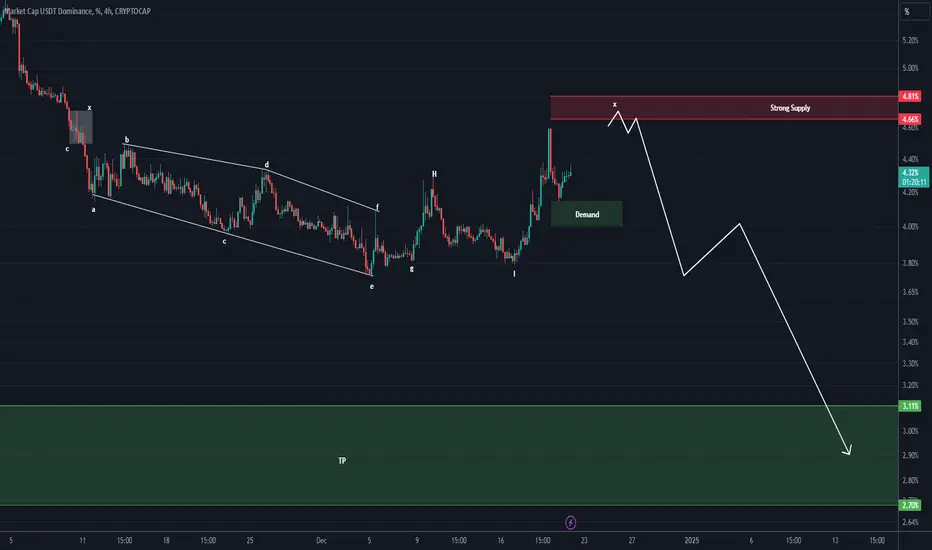
USDT DOMINANCE Update (4H)According to the signs on the Dominance Bitcoin chart, it seems that we have another drop on Dominance Tether, which means market recovery, especially altcoins.
Dominance Tether is expected to have another drop after reaching the Fresh Supply indicated on the chart.
Closing a 4-hour candle above the invalidation level will violate this analysis.
For risk management, please don't forget stop loss and capital management
Comment if you have any questions
Thank You

USDT Dominance Analysis. The dominance is moving within a descending channel, confirming a bearish structure.
Multiple rejections from the upper trendline (marked with arrows) indicate strong resistance around the 4.40% zone.
The highlighted green area near 4.10% acts as a crucial support zone, aligned with the channel's lower boundary.
A breakdown below this zone could lead to a sharp decline toward 4.00% or lower levels.
Moving Averages:
The green moving average (likely 200-period) suggests a broader bearish bias as dominance struggles below it.
The purple moving average (shorter-term) adds to the immediate resistance near 4.30%.
Short-Term Expectation:
The chart suggests a potential pullback or retracement toward the support zone, as the red arrow depicts.
Breaking below the support zone could intensify selling pressure in the crypto market, potentially signaling inflows into altcoins or BTC.
Resistance: 4.30% – 4.40%
Support: 4.10%, followed by 4.00%
USDT dominance appears to be consolidating near key levels, with a likely continuation of its downtrend unless significant bullish momentum emerges. Monitor for a breakdown of the support zone, as it could impact overall market liquidity dynamics.
For updates on other coins or personalized insights, feel free to reach out via DM.
@Peter_CSAdmin

USDT.D+USDC.D Dominance Suggesting Further Short Term CorrectionTargets to the upside after bullish divergence on weekly chart with a FVG. .618 target. Expecting bulltrap in short term for crypto market.
DUMP Ahead! be careful.Analysis provided by ict concepts suggest pump on usdt.d which indicates the dominance of stable-coins of the market. considering taking profits would be a rational choice. HAPPY NEW YEAR.

USDT.D Testing Critical Resistance: Breakout or Pullback?USDT.D has recently broken out of a falling wedge pattern, indicating a potential shift in momentum. The price is currently testing a critical resistance zone near 4.30%. A breakout above this level could signal further dominance for USDT, suggesting risk aversion in the crypto market.
If the resistance holds, a pullback toward the 4.20% support zone is likely. However, a confirmed breakout could lead to a continuation of the upward trend, potentially targeting the 4.40% level.
DYOR, NFA
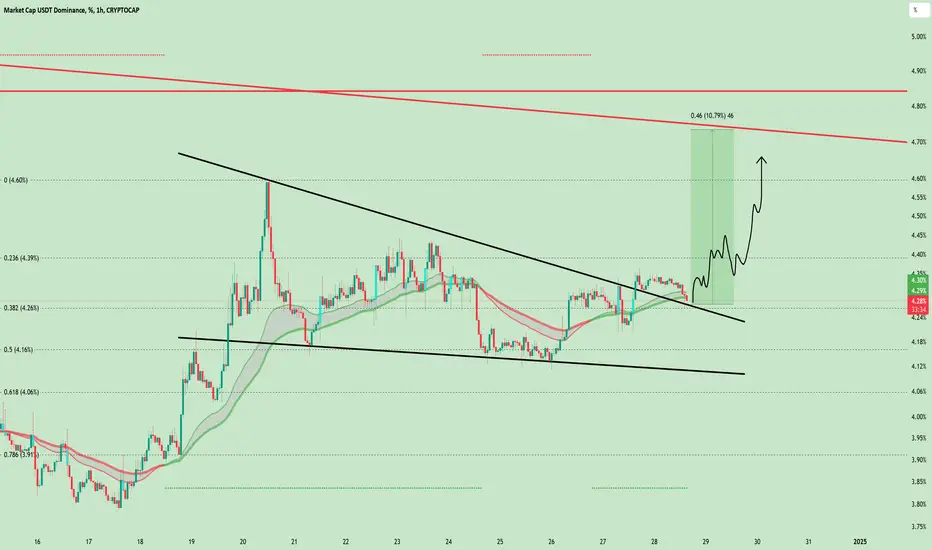
USDT Dominance Update (4H)Before anything else, read the instructions carefully:
We have a strong supply zone on the chart, and if the price hits this supply, a significant rejection is likely to follow.
Considering the manipulative behavior of market makers, it's not out of the question that we see a higher high in this upward wave, with the price reaching the supply zone outlined in this analysis.
According to the multi-chart analysis, Ethereum has not yet reached the flip zone. (You can find the link to this Ethereum analysis in the "Related Publications" section at the bottom of this page.)
Adjust the final steps of your buying strategy within this range.
Let’s see if the Tether dominance reaches this red zone or not.
For risk management, please don't forget stop loss and capital management
Comment if you have any questions
Thank You
#USDT Dominance: Don't FOMO! Here's Why!A rejection on the daily chart has led to a strong performance in altcoins, while BTC is steadily approaching the $100K zone, currently sitting at $98K. A break below the blue EMA, which is being tested now, could result in further continuation.
However, a bounce might mark the end of this Christmas rally.
For those experiencing FOMO, it’s better to hold on and wait. Of course, you’re free to make your own decisions, but in my opinion, patience is the best approach.
I hope you're enjoying the holidays!
Make sure to reduce screen time and spend quality moments with your family and friends.
Stay tuned for more updates!
Do hit that like button if you found my updates helpful in any way.
Thank you
#PEACE
