USDT.D may slow down the market
Hey, traders! 👋
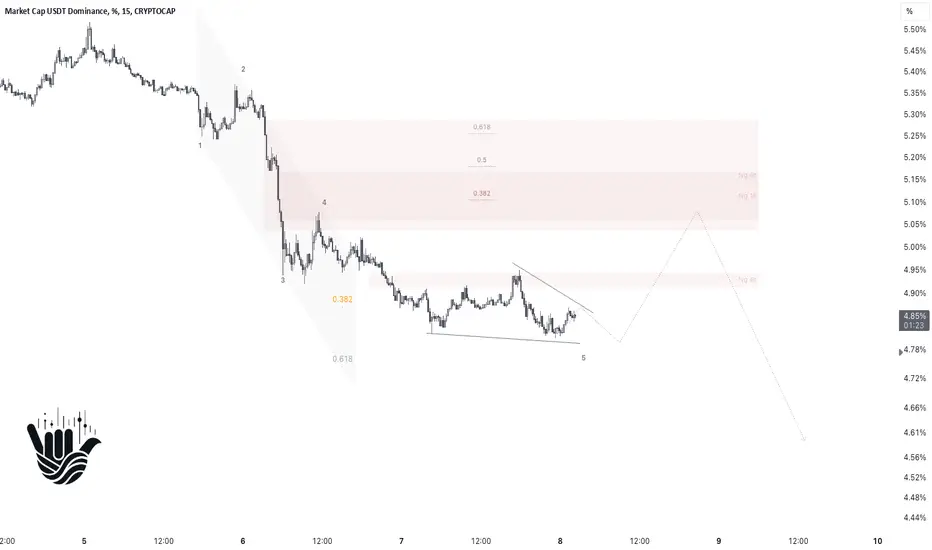
The chart indicates the completion of the 5th wave in the Elliott structure, signaling a potential end to the current impulse move.
Shaka
CRYPTOCAP:USDT.D
USDT.D trade ideas
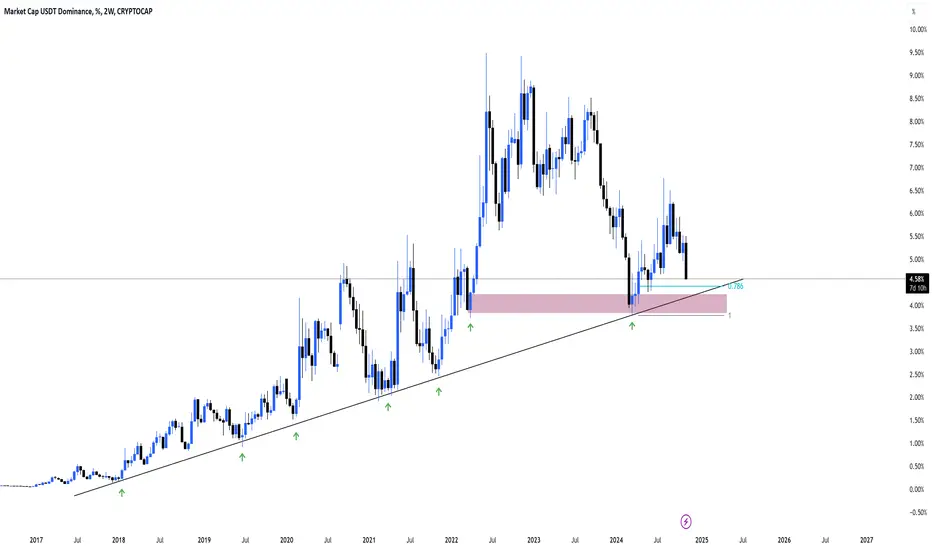
USDT.D 2WUSDT Dominance (2W)
With the price nearing a support level and an ascending trendline, there is a possibility of a price rebound from this area!
The dominance of USDT could be a signal of capital flowing into USDT, which may indicate capital outflow from other cryptocurrencies.
In summary, if you hold cryptocurrencies, be aware that USDT dominance has now reached a support zone.
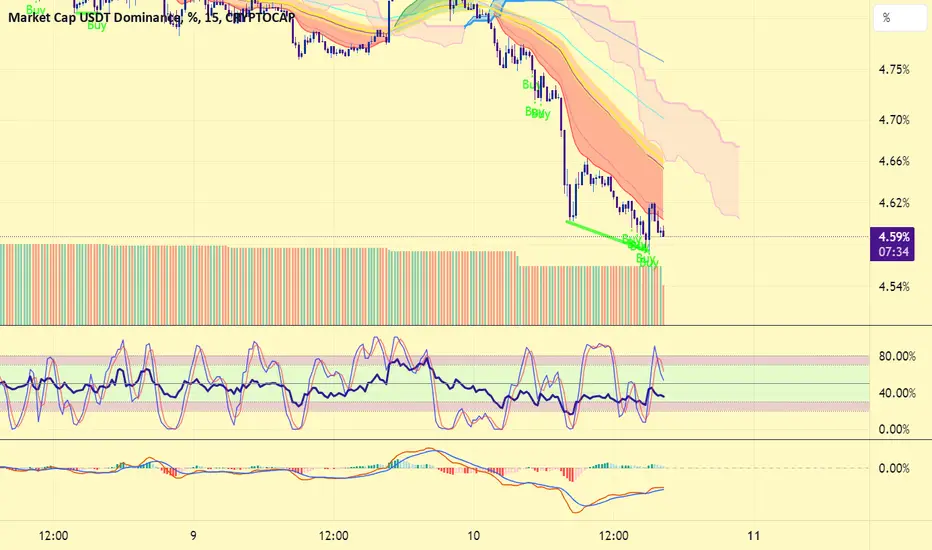
Tether dominance 's LTF bounceA bullish divergence has been forming in #tether #usdt dominance chart in lower time frame. A bounce may be expected. LTF bounce in #usdtd = minor correction in #crypto
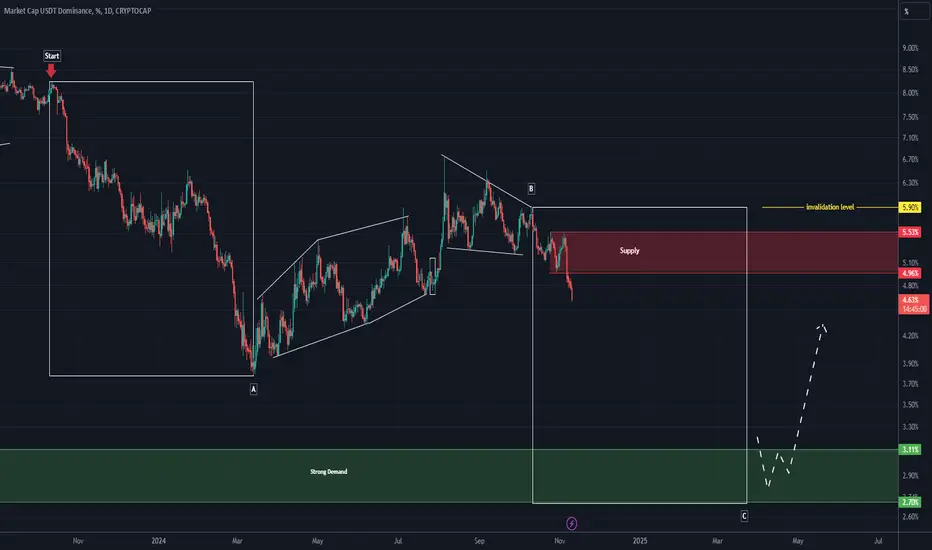
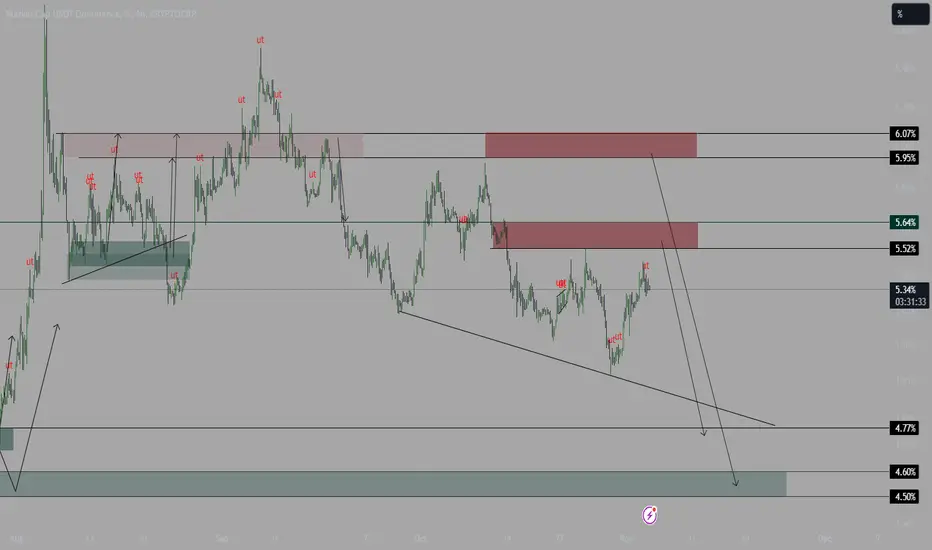
Tether Dominance is very bearish (1D)It seems that Tether Dominance has entered a large C wave.
Any return of Tether Dominance to supply is a buy opportunity in altcoins.
We expect Tether Dominance to be supported from the lower green box.
It is better to forget sell/short positions for a while!
For risk management, please don't forget stop loss and capital management
Comment if you have any questions
Thank You
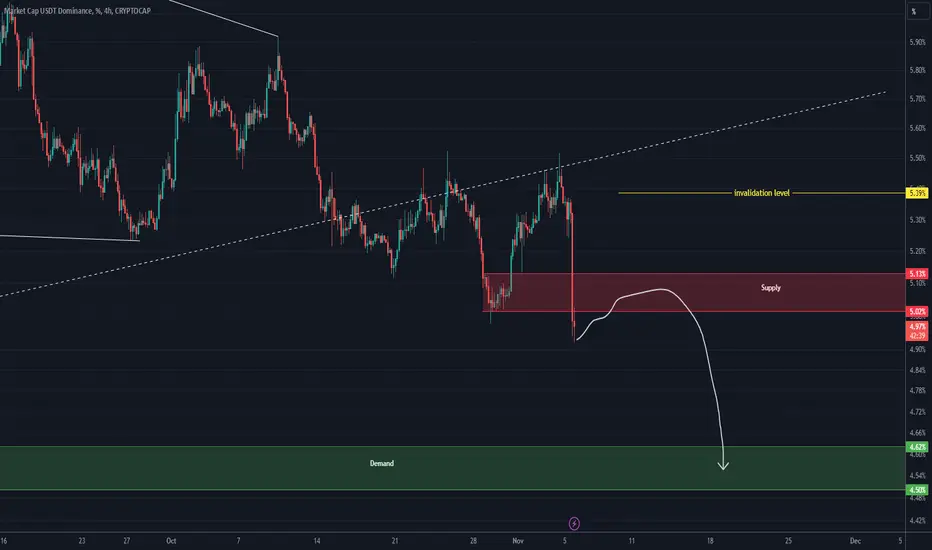
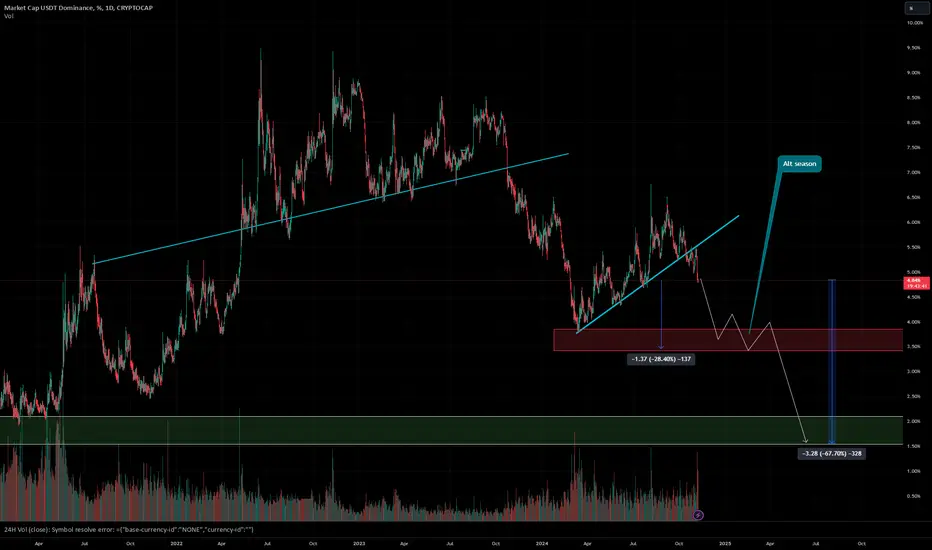
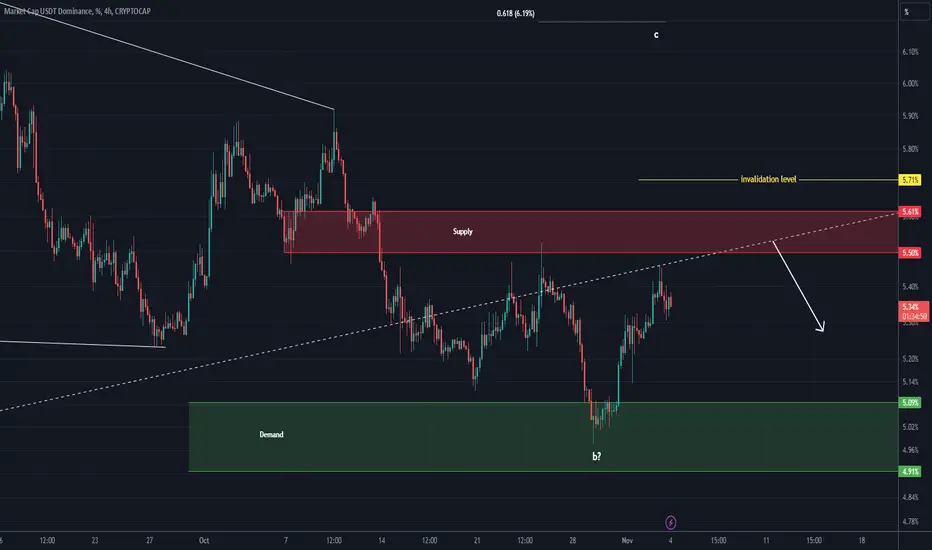
Tether Dominance UPDATE (4H)Due to the US election and the heavy decline and rejection, Tether Dominance is expected to reach the lower support range.
Support and resistance ranges are marked on the chart
Closing a daily candle above the invalidation level will violate this analysis
For risk management, please don't forget stop loss and capital management
Comment if you have any questions
Thank You
USDT.D nov 16th to start buying or longThe graph usdt.D shows there will likely be a pullback(all coins down) - we should enter after the 16th. This situation (bullrun)will probably end around May next year.
Tather dominance chartOnce tether dominance hits the trend line, we're going to peak as far as crypto prices. It always bounces off this trend line
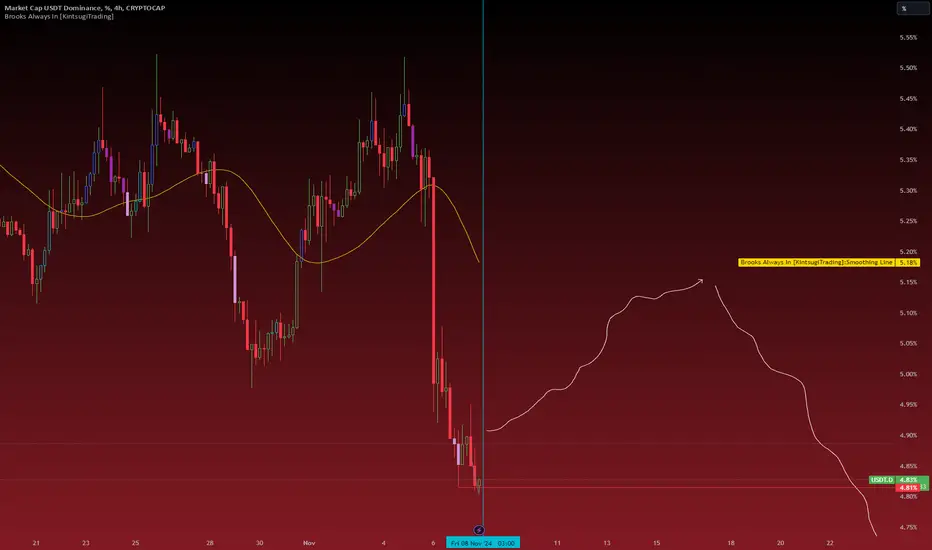
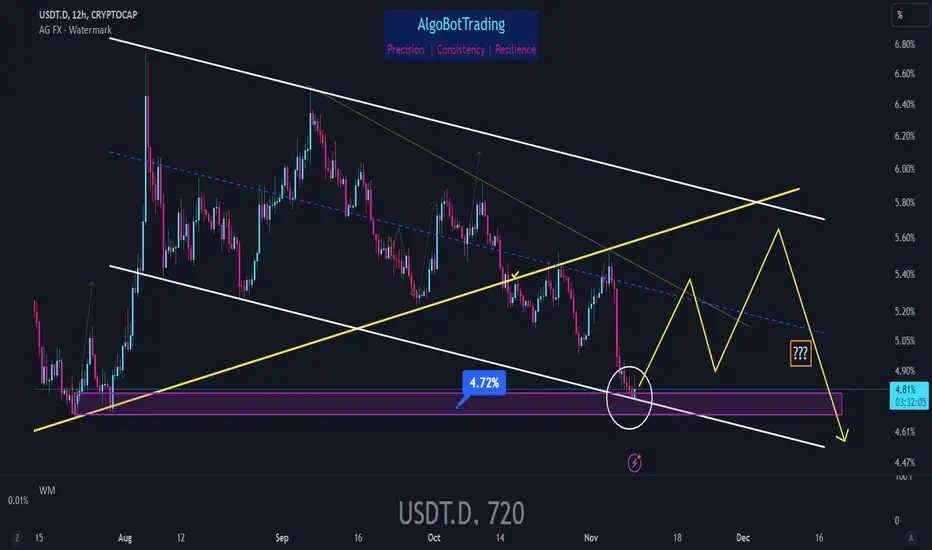
USDT.D Analysis 12H - Nov 09 2024USDT dominance has almost reached the very important support zone of 4.72% and given its recent channelized behavior, it is safe to assume that USDT.D is probably going to have a good upward reaction which means market is probably going to dump.
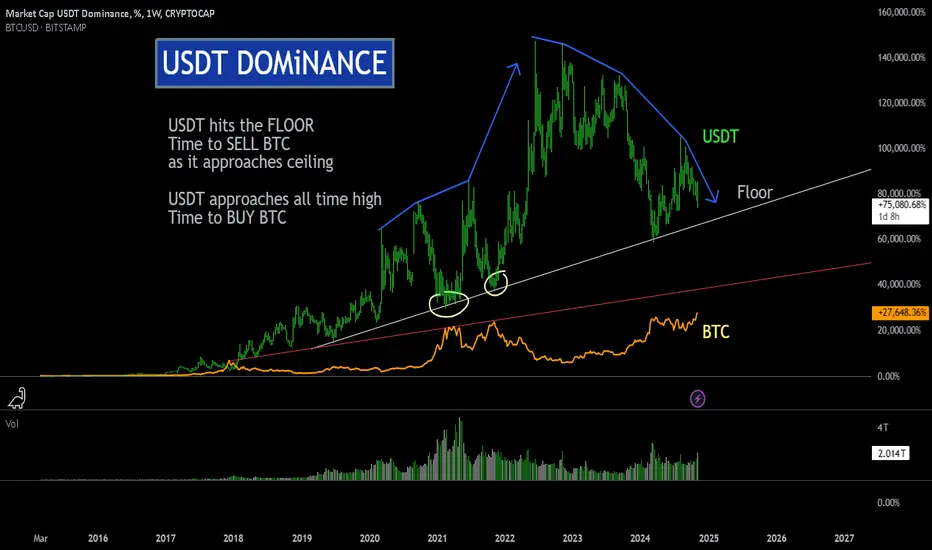
USDT Dominance: When to Buy Sell BTC King Dollar still drives the price of BTC
USDT issued by Tether iFENEX or Coinbase/Circle USDC
transferred to designated co dealers to
drive price of BTC in unison by the Gang of 8 Major dealers
Sell USDT buy BTC
Care of the FED FOMC and other Central Banks cutting rates
When Miners begin to Sell BTC and Funds of Funds mature for settlement
Sell BTC buy Dollar
this is reflected inversely correlated since 2015 close to 10 years which
established a cycle trend and tradition among heavy hitters dealers and Ogs (Veterans)
Tether Dominance looks bullish#usdt #tether dominance index formed bullish divergence and this may move #usdtd up. A bullish #usdtdom is dangerous for #altcoins and #crypto
What a beautiful patternExpanding triangle pattern🤔
One of the signs of its existence is the fluctuations of the candles inside it, which when it hits its lines, it moves strongly in the opposite direction.
And the interesting thing is that after getting out of the expanding pattern, we will probably see a lot of fluctuation in the market😎
If you want me to analyze a coin, tell me in the comment🫡
⚠️ Do capital management to survive ⚠️
You are not Long enough !I think this is what going to happen
We pump to 102K as local top
And range between 80K-100K for few months while alt season especially in ETH continues
Then from 90K we get a Pump to 140K ish
But as BTC only season
No gains on most alts
And probably 140K would be the Top For 2025
I think from that date we see BTC acting more like SPX and we will probably see a total of 20K pump per year
While 99% of alts would be dead to most people
USDT chart
The chart shows strong resistance around the
83,624 level, which has historically acted as a barrier.
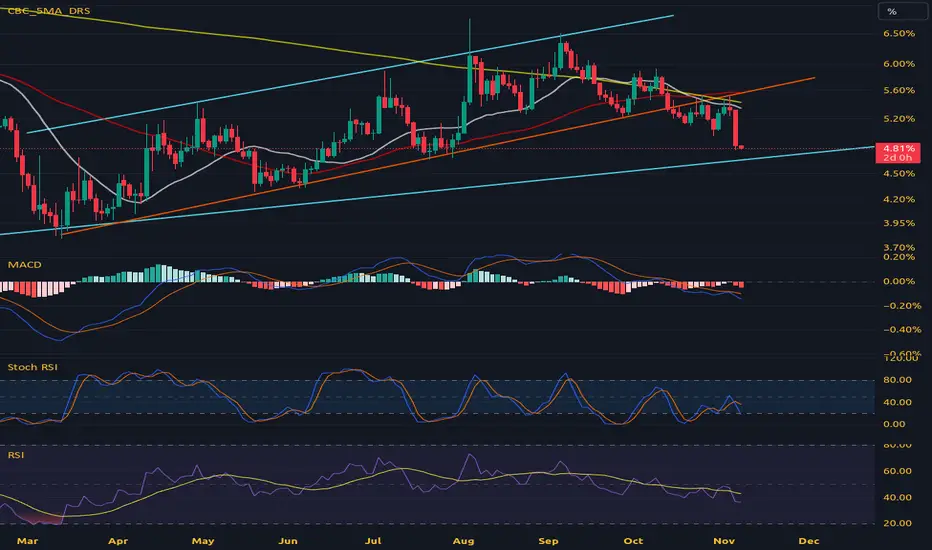
Stochastic Oscillator, Currently, it is moving upwards but hasn't yet reached the overbought zone, which suggests there might still be room for further upward movement before a reversal.
The RSI is in a bullish position but hasn’t reached extreme overbought levels. This supports a bit more upward movement potential.
The MACD is in a bullish crossover and momentum is positive, indicating continued upward trend strength.
Given these indicators, a reasonable take-profit level could be set around $83,500 - $85,000. This range captures the resistance while allowing some buffer above the $83,624 level, where some profit-taking might occur if momentum continues.
USDT bullish and BTC bearish ideathree point bullish divergence suggests a fast pull back of tether dominance and bitcoin fall to lower levels
Also on weekly chart it's on 0.618 fib, a reject is likely
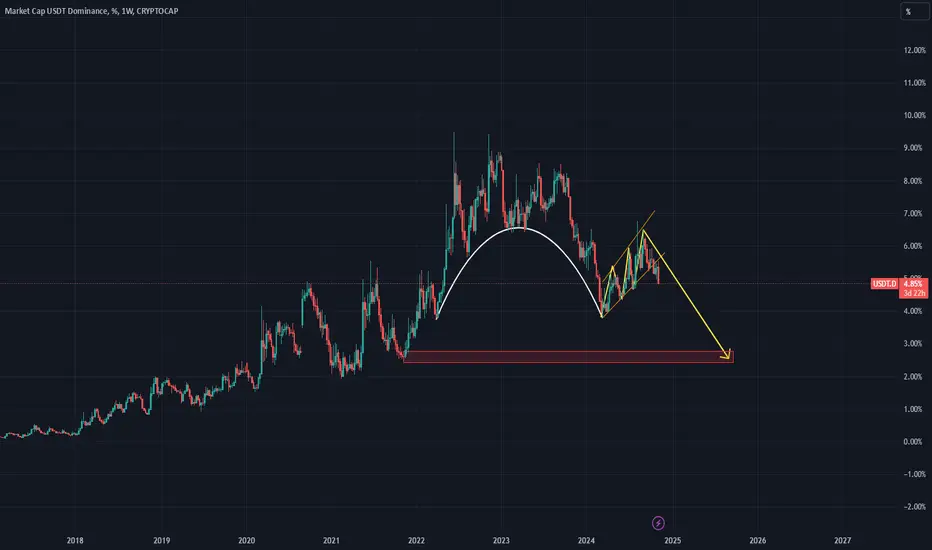
USDT.DThe USDT.D dominance is expected to decline due to the formation of a cup and handle pattern.
The identified level is the weekly order block, which is expected to prompt profit-taking in altcoins if a reversal occurs from this level. In any case, I will start taking profits once USDT.D reaches this level, along with additional confirmations from indicators like USDC.D and BTC.D.
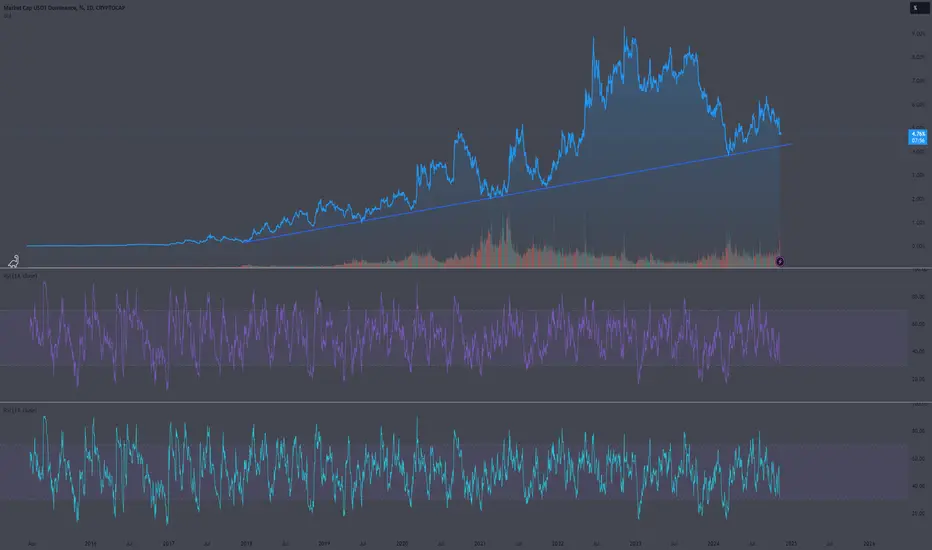
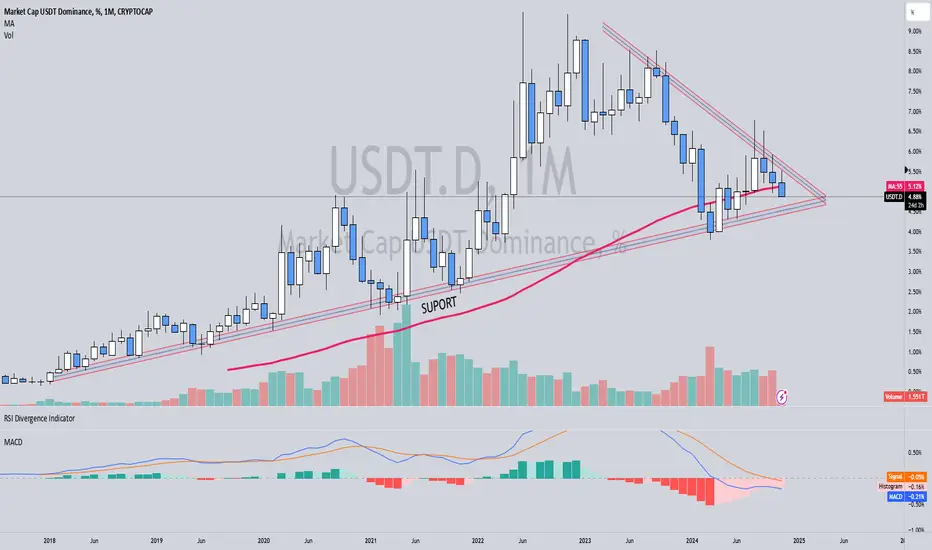
USDT.DCRYPTOCAP:USDT Dominance: It has steadily decreased over the past two years 📉 and is now at the MA55 support level on the monthly chart (1M) 🛡️. In March this year, it reached this support and quickly rebounded 📈. We might see a false breakdown below this support over a period of few months 🔄. Additionally, there is a symmetrical triangle 📐; if the price touches the support, the chances for a quick rebound are high, as it usually does not stay at this level for long ⏳.
A decrease in USDT dominance means that less money remains in stablecoins and is moving toward other cryptocurrencies such as BTC, ETH, and altcoins 🚀. This is often a sign of growth in the crypto market 📈, as investors take on more risk, shifting from stablecoins to more volatile assets.
USDT.DUSDT.D is the dominance chart of the stablecoin Tether (USDT) in the cryptocurrency market. When USDT.D increases, it means that more investors are holding USDT instead of other cryptocurrencies like Bitcoin or altcoins
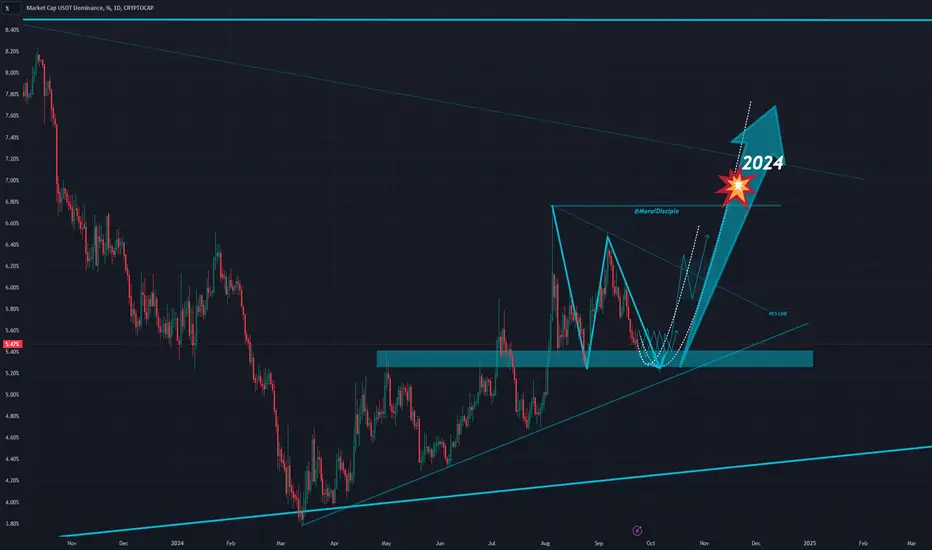
usdt.das we can see the pattern always bullish and debt and liquidity grow because of the bubble and inflation goes up too!
so we believe the chart does bunce back and grow up!
so its a personal point and my point so bright! You need sunglasses!

USDT DOMINANCE UPDATE (4H)First of all you should know that "USDT Dominance" is always moving inverse of BTCUSDT .
When the Dominance Tether hits the red box, we expect a reject. This area seems to cause the cryptocurrency market to take a break for the continuation of the drop
Closing a daily candle above the invalidation level will violate this analysis
For risk management, please don't forget stop loss and capital management
Comment if you have any questions
Thank You
USDT.DThis is my opinion with technical analysis
Please respect the following rules:
1- Risk management .
2. Have your own strategy.
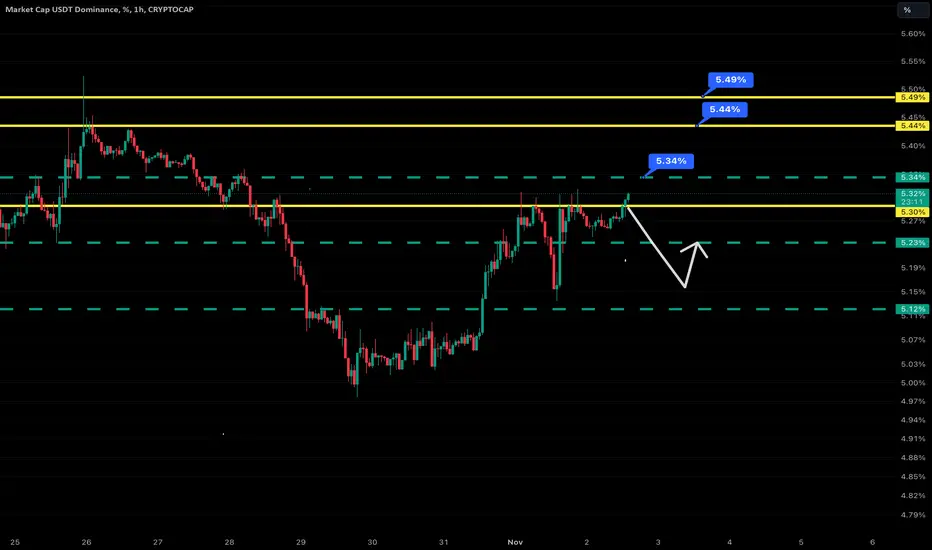
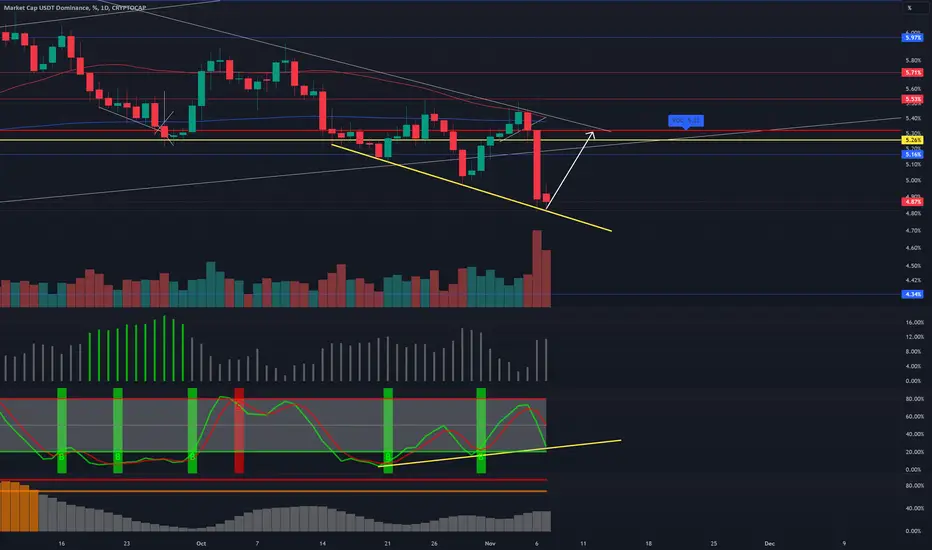
Usdt.D last retrace before alt-partyMy key levels are 5.45 & 5.54.
After seeing the suitable candles and the setup I want, I take a long position on the Altcoins.

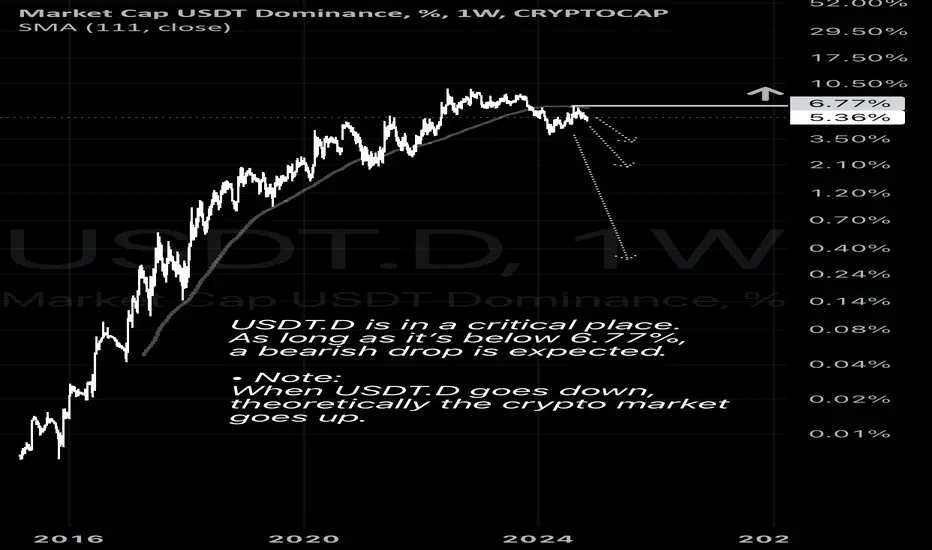
USDT DominanceUSDT.D is in a critical place. As long as it’s below 6.77%, a bearish drop is expected.
• Note:
When USDT.D goes down, theoretically the crypto market goes up.
USDT.D - Watchout, market can bleed from here USDT.D - Watchout, market can bleed from here
Wait for that chart to go above 5.45 - 5.5%. You can start your longs then and that you can hold for complete bull run