Perfect BTC Long Opportunity USDT.D has always been great chart to see where BTC is going , Right now this is perfect RR to Long BTC & tp1 90000$ tp2 121000 tp3 190000
Don't lose this Opportunity
USDT.D trade ideas
USDT.D updateThis analysis once again showed us the way with almost 12% correction causing good growth in the market
Now pay attention how market reacted to our zone & how this index pumped for at least 4% causing some blood in the market
At this point we have to follow market behavior to see whether it will keep this correctional momentum or not
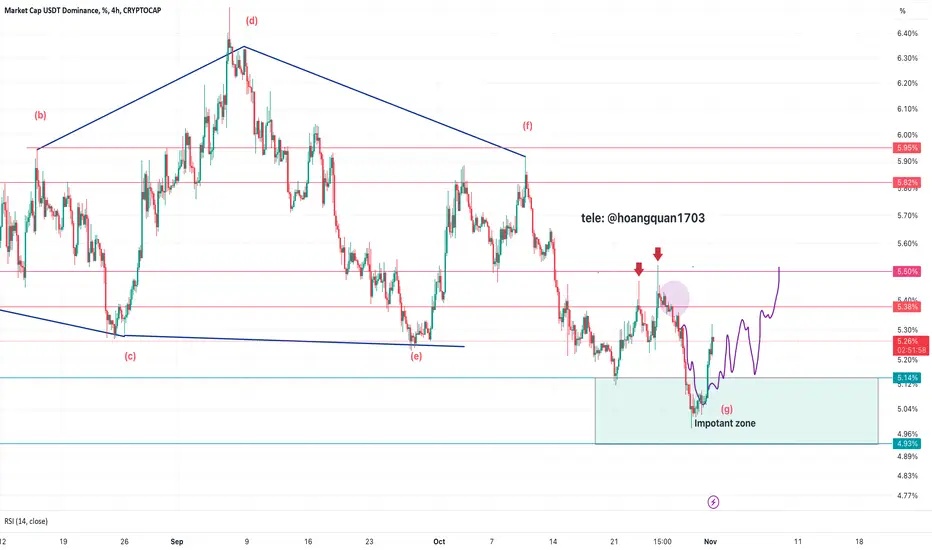
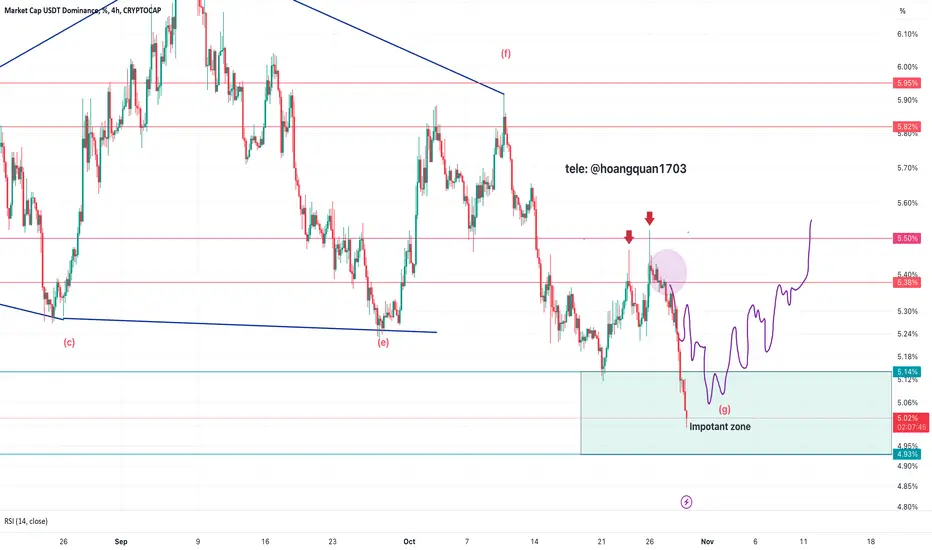
USDT Dominance can surprise everyone First of all you should know that "USDT Dominance" is always moving inverse of BTCUSDT .
the signs say that either wave G is not over or we have an X wave, which means that USDT Dominance can drop back to the green box.
If the green box does not support USDT Dominance it could be a deep drop.
Bitcoin's dominance is bullish, so the price of bitcoin can become very bullish in the coming days.
Even the news of the war could not bullish USDT Dominance, which means that the situation of USDT Dominance is bad.
We have shown the new movement of USDT Dominance with an orange arrow on the chart
For risk management, please don't forget stop loss and capital management
Comment if you have any questions
Thank You
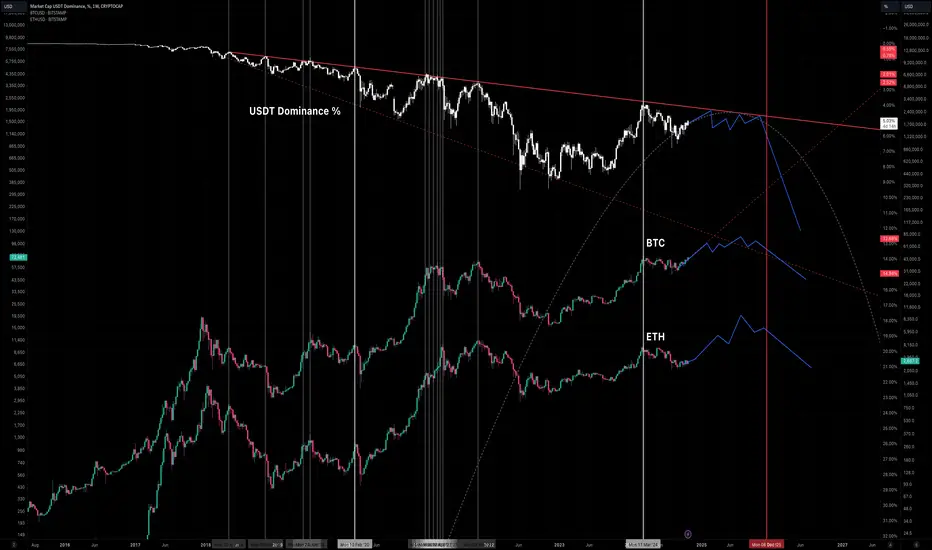
Fantasy. BTC x ETH x USDT DOMINANCEIn their theory I just try to f*ck around to find out.
USDT.D% chart is inverted. But there is something very important in dominance. Maybe big players use exit from btc/alts to usdt when they see this magic trend line. Because of this we see how D% growing and crypto falling.
Do NOT try to trade & invest using this fantasy. Again, I just try to find out and I need theories to do this.
USTD.D updateThis is USDT.D, a reverse indication to how BTC will perform based on money flow concepts. It looks like USDT.D is starting to form a bullish harmonic pattern and if it does and plays out, BTC will dump. Now only that, the PRZ (potential reversal zone) on the harmonic pattern has weight being based on both yearly VWAP as well as a trend line that is based on Fib levels. Therefore, I am looking for quick short scalps today as I believe a retrace is coming.
Analysis can always be wrong based on these, so no matter what or how much you trust me, trade safely and have back up plans! @Nate Alert

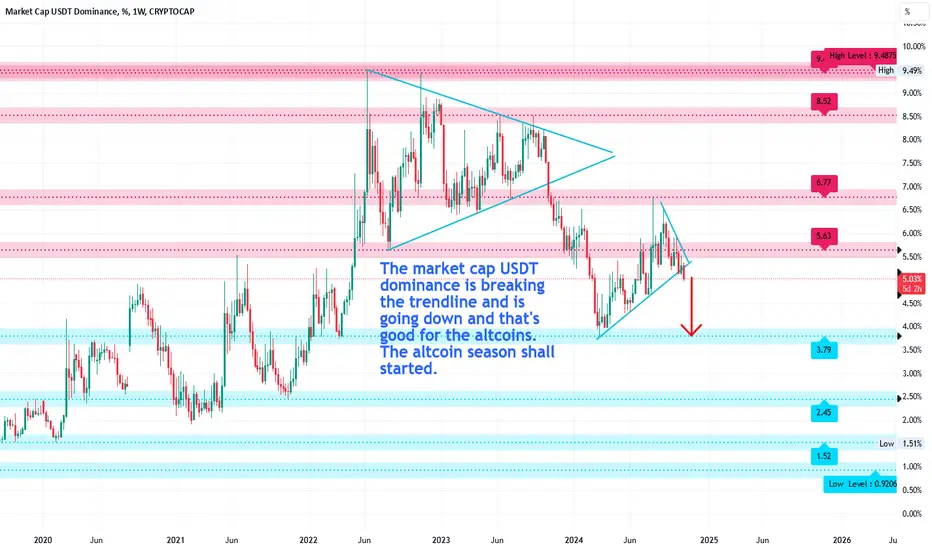
The market cap USDT dominance is breaking the trendlineThe market cap USDT dominance is breaking the trendline and is going down and that's good for the altcoins. The altcoin season shall started.
USDT.D updateFinally USDT Dominance gave up & dumped from the highlighted area to finish wave G of our diametric pattern
7.5% Correction in this index which caused good recovery in some of the alt coins. At this point we expect this index to range for a while so some of the alt coins could gain more momentum
We have to keep our eyes on this index to look for a new pattern forming
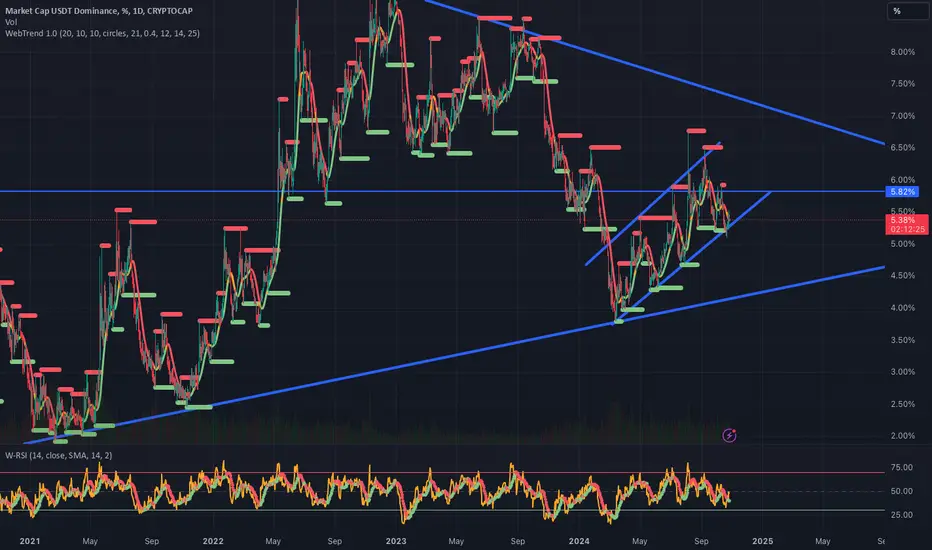
Next Stage of Bull MarketUSDT.D is testing the 20 W SMA which has been a key level for Bull Markets.
The zone and MA has acted as Support 4 times previously in 2024 which have correlated with BTC Local Tops
A close under that SMA is indicating that we are entering the next stage of the Bull Market. I prefer a few Daily Closes under, Weekly Close under is Gold Dust and tells me the Next Stage has begun.
Read this to understand the Context of that SMA:
Main reason I'm more Bullish this time compared to that precious Idea is because of DXY.
Confluence:
BTC has shown Strength since Oct 10th despite the continued Upward Trend in DXY that started on Sept 30th.
1 Day RSI on DXY is close to 70(Currently 69) which is a general sign that it is close to Topping.
DXY is also testing the 200 EMA since it broken down below in July.
My expectation is that the 200 EMA acts as Resistance for DXY and it rejects to continue its downtrend. This would be Bullish for Risk Assets like BTC/Crypto and would correlated with USDT.D breaking below the 20 SMA.
USDT MOON- Do you know what happens when something push too much ? it reverses and goes down.
- Sir Fibonacci said one day :
" When u launch a coin to the sky, it takes speed, then it stops, then it goes down more fast than it went up "
- if USDT grab more Dominance on Cryptos Markets, it would mean we are rolling back in the "Old Financial system" i hope everyone understand that.
- That's not gonna happens.
- i won't comments much on this analysis, but it speaks by itself. ( everything is in the graphic )
- i won't also speak about what happened recently to UST in Luna Ecosystem because it's sad for the peoples.
- Stay in BTC and pray TheKing.
Happy Tr4ding !
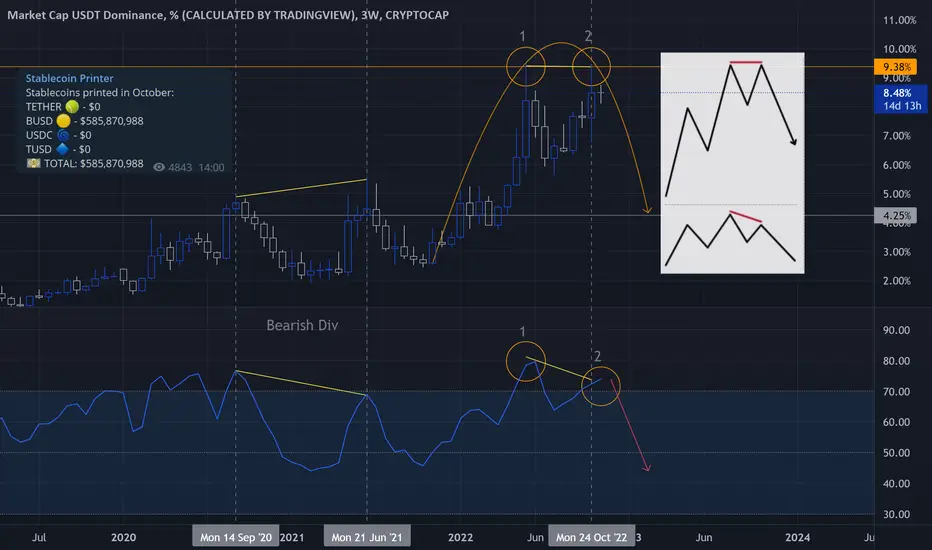
USDT.D- i have to admit i rarely saw that in my trader life 😂.
- Double Top Bearish Divergence followed by a push.
- Last month and before, only Binance printed BUSD.
- USDT (and USDC) are playing "TheFed game" - 🛑No printing🛑 -
- Not gonna work forever.
Happy Tr4Ding !
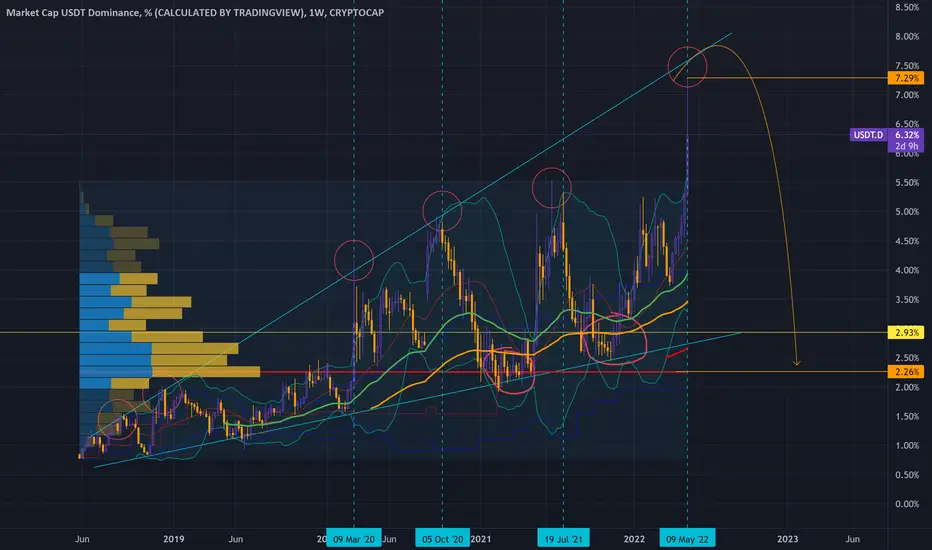
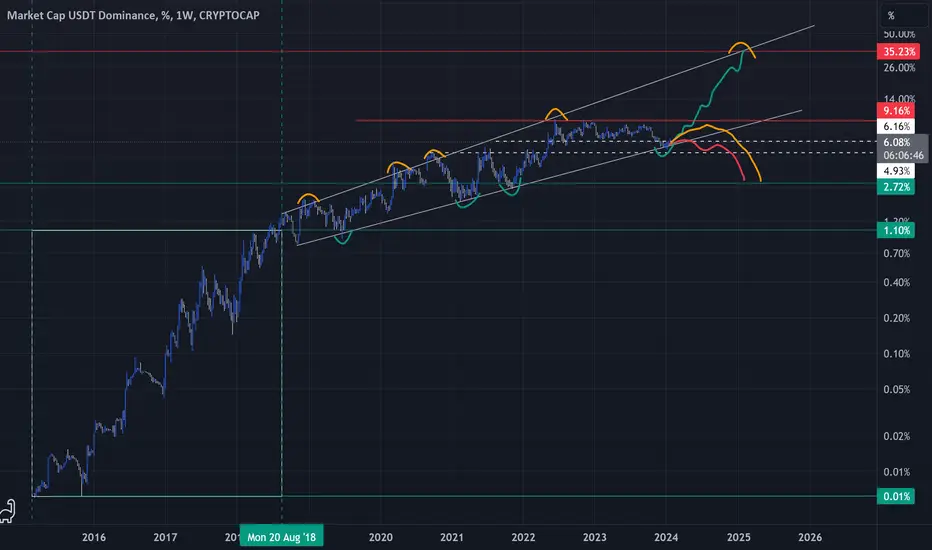
Tether The Trumpet- On this Chart i use zero indicator and just the trend.
- Some basic supports and resistances.
- What we can see and deduct ?
- Tether jumped from 0.01% to 1% dominance from 2015 to 2018.
- from 2019 to 2023 USDT.Dom growed from 1% to 10%.
- now the trend is still evolving in a steady broadening trumpet formation.
- Do you really believe Tether would reach 35% Dominance in Crypto Markets ?
- it would mean that 35% of peoples would prefer to stay in Stables Fiat and win nothing.
- Just using logic and combine FA + TA :
- This uper trend will be broken down soon or later.
- i just do believe that Tether have to crash at one point ( no matter the reason ).
--------------------------------------------------------------------------------------------------------
- So now a quick comprehensive explanation about Tether.Dom and how it works :
1 - When BTC down = Peoples swap their BTC to USDT (panic)
- USDT.Dom up !
- Tether stop the printing Machine and wait.
2. - When BTC up = Peoples swap their USDT to buy BTC (fomo)
- USDT.Dom Down !
- Tether have to restart the printing machine and issue more USDT to cover BTC demands.
- Yes it's simple as that..
- Tether is not really different than the FED.
- they just print more USDT from thin air when peoples want buy more BTC.
--------------------------------------------------------------------------------------------------------
- Remember that without BTC, Tether would worth 0$ and disappear.
--------------------------------------------------------------------------------------------------------
St4y Safe
Happy Tr4Ding !
Tether Dom- i will try to make it short.
- Like always everything is understandable in graph.
----------------------------------------------------------------------------------------------------------
TA :
----------------------------------------------------------------------------------------------------------
- Tether made a triple new ATH around 9% dominance on Crypto Markets.
- Got rejected 3X times.
- Right now it's the 4th attempt for USDT trying to break 9%.
- i kept BB in graph to show that USDT flirts again with the higher bollinger band.
- Right now the most important is to watch out for Divergences.
- Divergence or Hiden-Div will come soon or later.
- i expect Tether to back around 5% Dom around 2024 when the bullmarket will back.
- Do you remember last year when USDT and USDT were racing together ?
- USDC ( Circle ) Failed with the fall of Silicon Valley Bank.
- Now USDC is a back to 2.60% Dom.
----------------------------------------------------------------------------------------------------------
FA :
----------------------------------------------------------------------------------------------------------
- Remember USDT still have a big lack of transparency.
- if u check the news, you will notice that Tether invested heavily in Bitcoin Mining.
- They did this move to use this diversification as a parachute in case of troubles.
- if Tether fails for any reason it could quickly dip to 3.7% Dom.
------------------------------------------------------------------------------------------------------
Last Point : CDBC are coming and central banks will try kickout Tether from this game.
---------------------------------------------------------------------------------------------------------
Conclusion : Stay Safe and Buy Bitcoin !
Happy Tr4Ding !

USDT.D pump for two weeksExpecting this correction to the upside to complete to 8% area. It seems it has two weeks to complete the time-based fib 1-1. after which the bull market will start

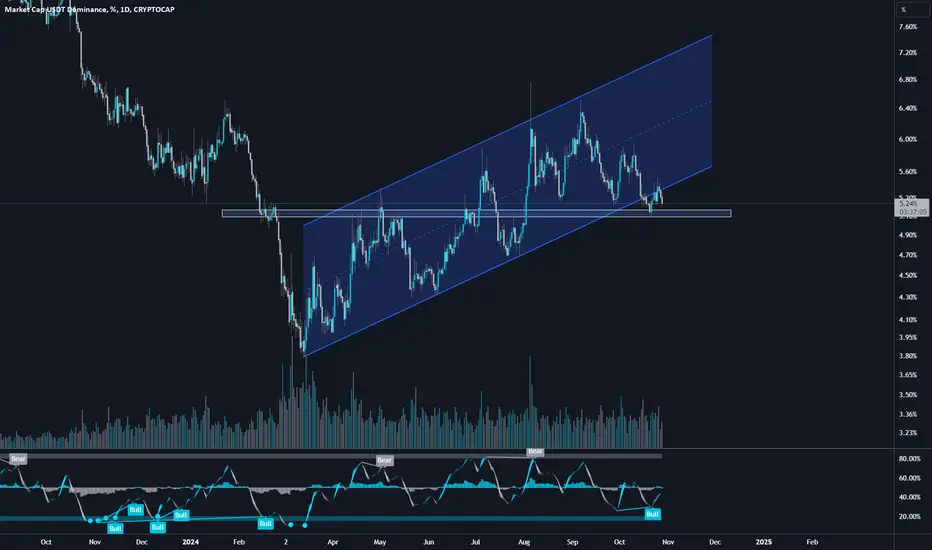
Massive Bitcoin Rally Incoming? USDT Dominance Breakdown Sparks USDT dominance has broken out from the ascending channel, this is a significant development. Typically, a breakdown like this suggests that capital is starting to flow out of stablecoins (like USDT) and back into assets such as Bitcoin and altcoins. This is usually a bullish signal for the broader crypto market.
Now that USDT dominance has broken out of its 205-day-long ascending channel, we could expect a substantial upward movement in Bitcoin’s price, as traders may be moving their capital back into crypto assets. Historically, this kind of shift has led to a Bitcoin rally, and as always, altcoins tend to follow Bitcoin’s momentum.
This could be the early phase of a significant market recovery. It’s important to watch for confirmation, but this breakout could indicate that traders are regaining confidence in the market after recent uncertainties, potentially setting the stage for a surge in crypto prices!
USDT.D Breakdown- Consolidation has finally been broken and we are seeing a breakout on the downside
- Tried twice to break back into the channel as a retest of the breakout
- Now strongly closing below 5.1 will signal the start of the second wave of the Bull run and altcoin season(dependent on BTC dominance falling)
Need the strong close below 5.1% to feel comfortable full longing on leveraged positions
Next target is 4.7-4.8%
USDT Daily Frame UpdateWell USDT Rejected one more from The DIP of the channel it's working now since April
Whole market Will Get in bad downtrend if Just USDT could not break the channel and go for The second line ( Weekly Support )
But the channel looks Stronger than i thought
stay Safe Better And wait Either it breakdown then you can buy Or It just Create new Wave To 7% where The market Will be at very Bad situation
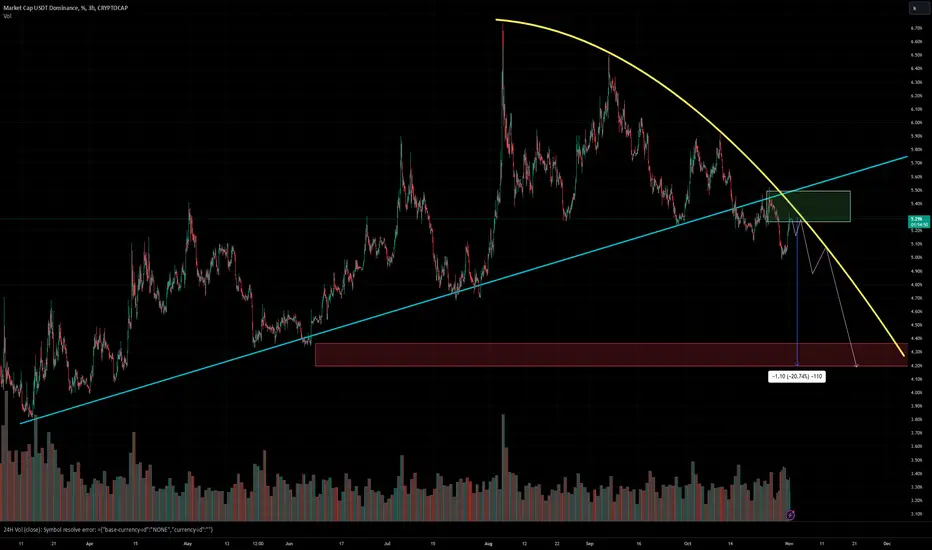
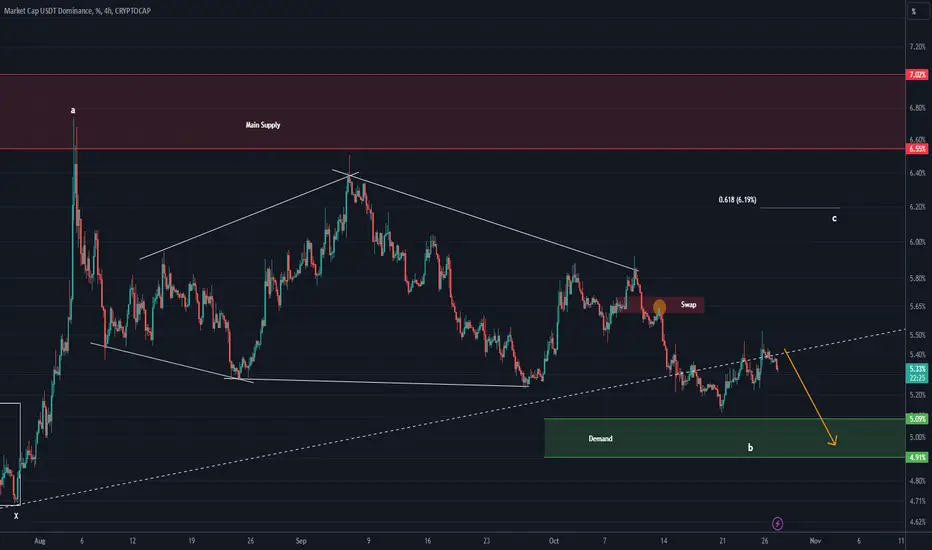
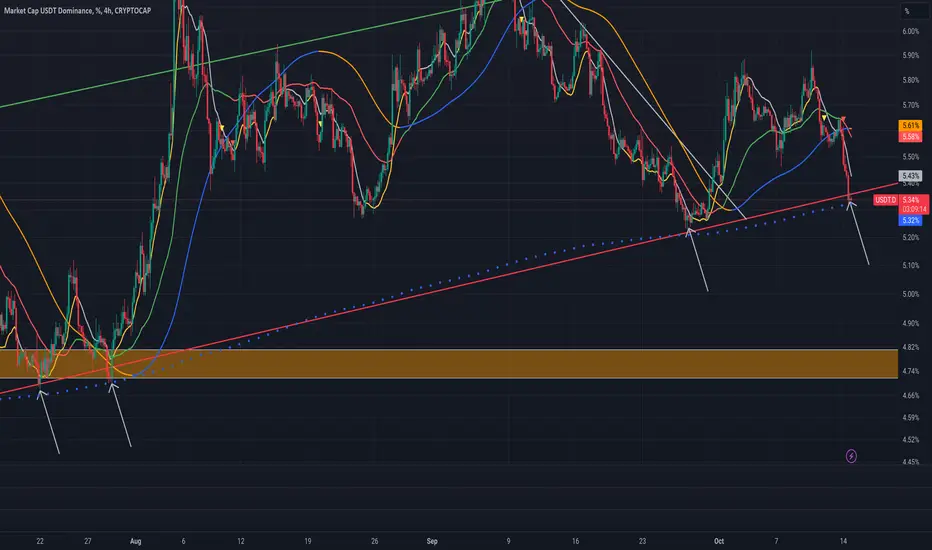
USDT.D 4H update - Oct 27 2024USDT dominance is really close to its recent ascending trendline (blue) and an upward reaction is very likely during Monday and Tuesday.
A rise in USDT.D means a dump in the market, so Sell/Short strategy is advised.

USDT.D CHART I said in my previous analysis that if I do not get a strong come back, there is a chance for rejection ☄️
From the looks of it, even the news of war was not able to create super bullish candles to go to higher levels so we CAN expect another visit to lower box

Btc VS Usdt.D You know what to do!Usdt.D will going down because they all swap usdt to bought Btc and crypto.
This sign mean Btc will Moon very soon!
HODL
#BearFaceTrader

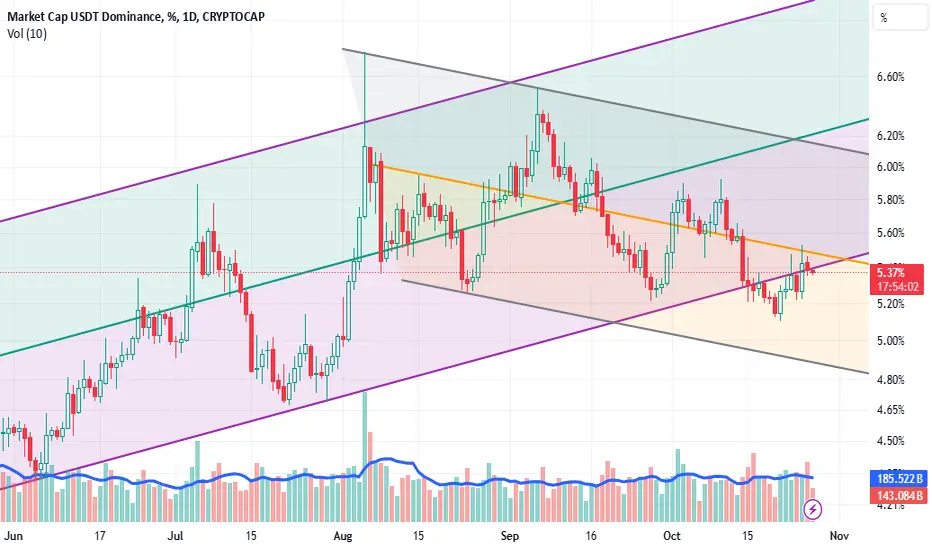
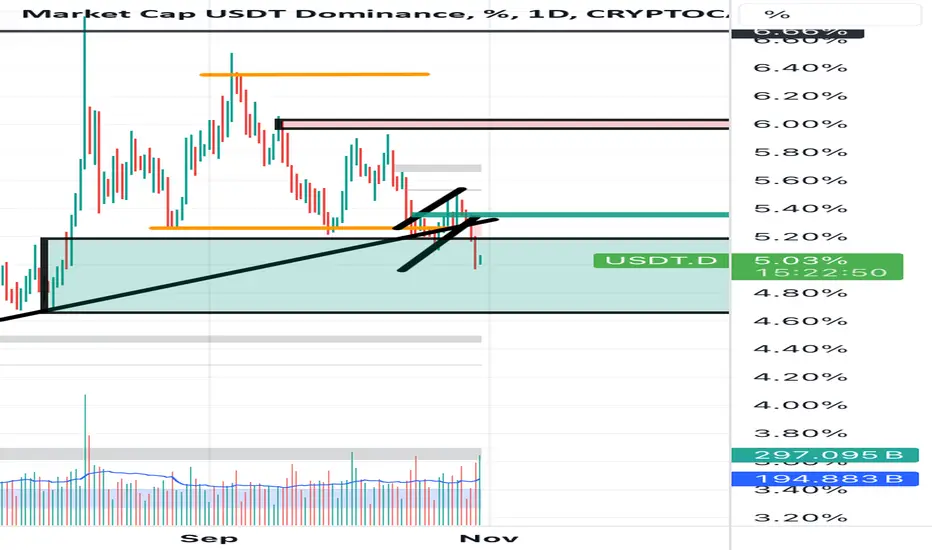
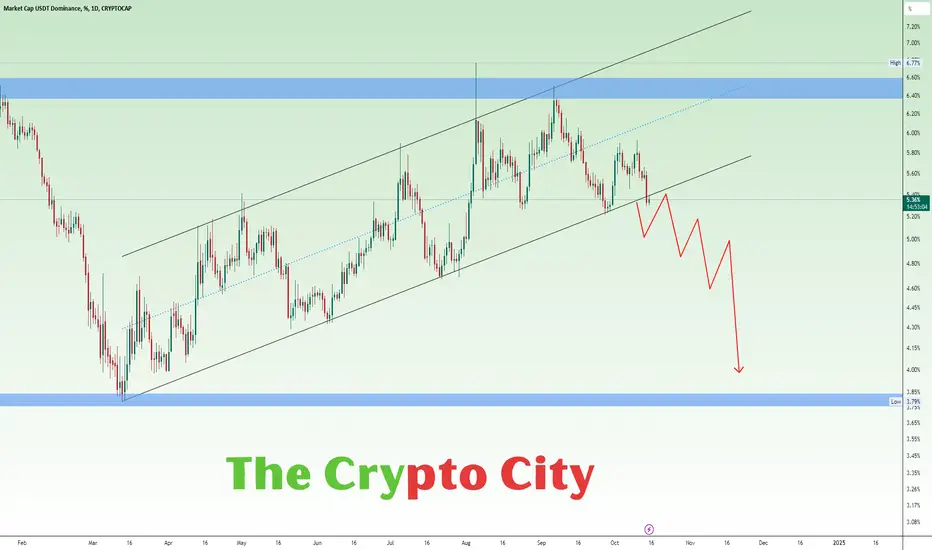
USDT Dominance breakdownCRYPTOCAP:USDT.D The rising channel that it has been following since March 2024 has turned into a downtrend and is being tested again.
USDT (#Tether) dominance refers to the ratio of Tether's total market value to other crypto assets in the crypto market. When USDT dominance drops, the following results are usually observed:
1. Rise in Bitcoin and Altcoins: Tether is often used as a safe haven in the market as a stablecoin. When USDT dominance falls, it can be understood that investors turn to riskier assets (#Bitcoin and altcoins). This could cause a rise in #BTC and #altcoins.
2. Increasing Confidence in the Market: While USDT dominance is decreasing, it can be considered that risk appetite is increasing among investors. That is, investors prefer to invest in more volatile cryptocurrencies rather than stablecoins, which may indicate an increase in confidence in the market overall.
3. Dispersion of Liquidity: The decrease in USDT dominance means that market liquidity is distributed to assets other than USDT. This could result in a more diversified market structure, with market volume spread across other coins.
4. Beginning of Market Cycles: Declines in #USDT dominance can be interpreted as the beginning of a bull market cycle as investors turn to assets with the potential to appreciate rather than stablecoins.
CRYPTOCAP:USDT dominance decline may indicate that investors' perception of risk in the #crypto market has increased and they are seeking higher returns, but market conditions and other economic factors should also be taken into account. 🤝

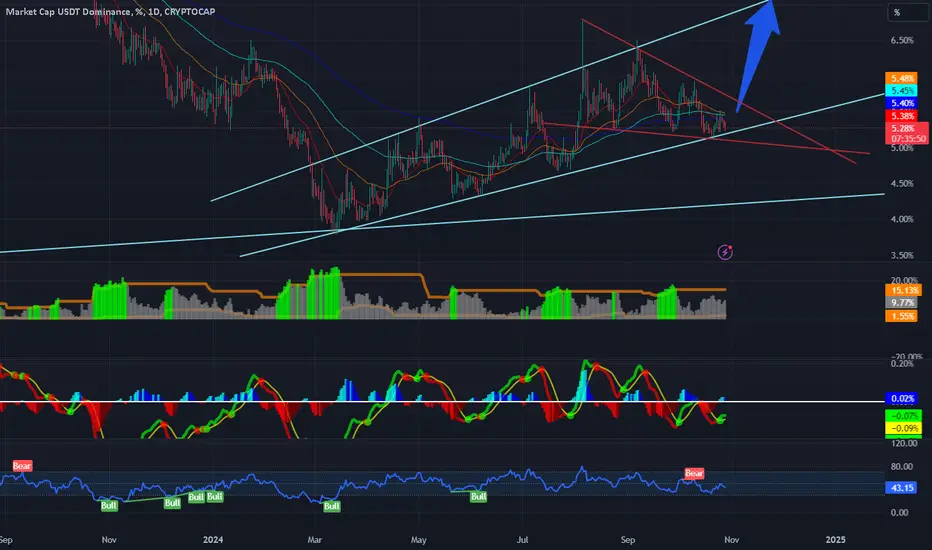
USDT dominance is descending in weekly time frame.USDT dominance In the weekly time frame, bearish signs can be seen in the indicators. In the daily time frame whose chart is shown, it is at an important point and upon reaching the important intersection of the middle of the descending channel and the resistance of the ascending channel that was left out of it, signs of weakness can be seen. I personally believe that it will continue to decline again in the coming days and we will have a sharp fall on today's date