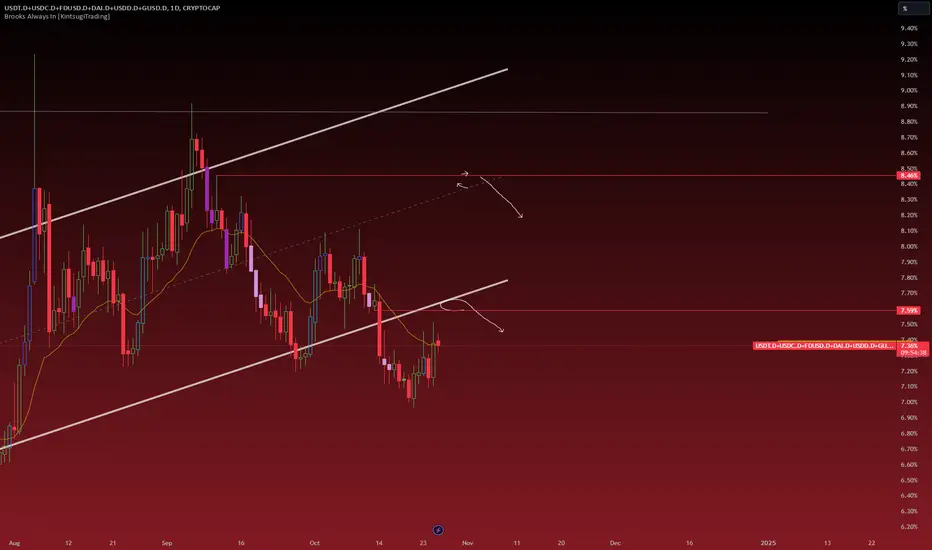
All Stablecoins DTwo possible return lvls for stable coins.There is USA election. So everyone waits.
USDT.D trade ideas
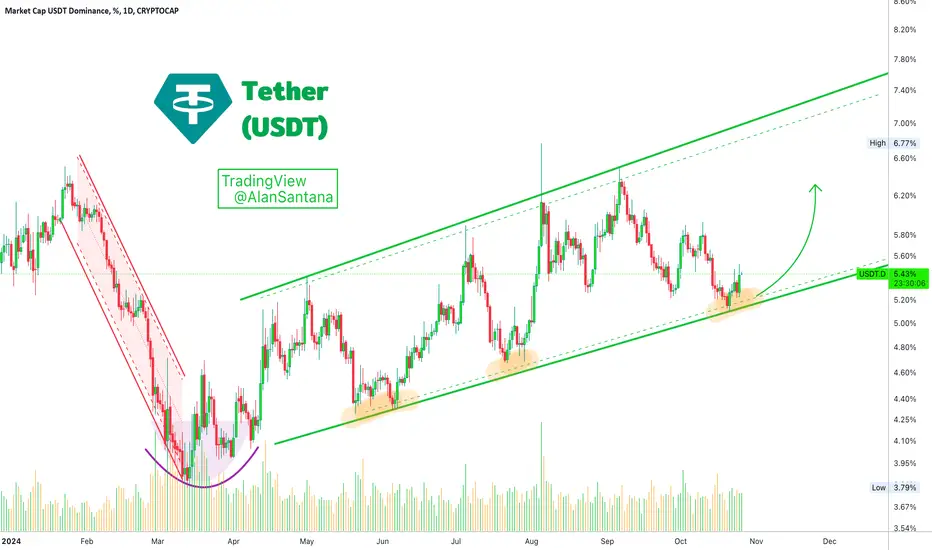
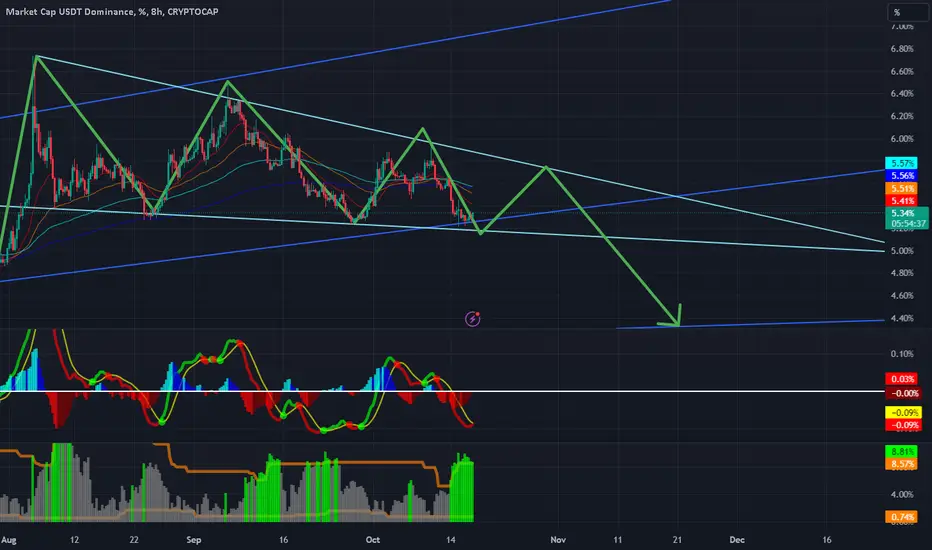
Tether Dominance Says Bitcoin Is Going DownTether Dominance's decline ended in March 2024. If we look at the chart before this date, all we have is bearish action, lower highs and lower lows.
The last drop was very steep and produced a rounded bottom. Out of this rounded bottom USDT.D entered a rising channel and is moving within it. We can see a clear pattern of rising values and the biggest volume bar is green.
Each time the lower boundary of the channel is tested, we get a bullish move. Each time there is a bullish move, Bitcoin goes down.
➖ Bitcoin was moving up between 6-September and 21-October.
➖ USDT.D was moving down between 6-September and 21-October.
Now, USDT.D started to move up. This development can be used as signal that says Bitcoin is about to move down.
This is what the chart is currently saying.
Thank you for reading.
Namaste.
USDT.d looks bullish#usdt #tether dominance has bounced after made the double bottom and still looks bullish in lower time frame. Bullish #usdtd = bearish #crypto . Not financial advice.
Stable coins vs Bitcoin Total stablecoins dominance (Tether Dom.+ USDC Dom.+ DAI Dom.) vs Bitcoin price comparison of last 5 years and future performance prediction.

USDT Dominance Bearish Pattern: What’s Next for BTC and AltcoinsHey everyone!
If you’re finding value in this analysis, don’t forget to hit that 👍 and follow for more updates!
USDT dominance is a key indicator of market sentiment and liquidity flow between stablecoins like USDT and more volatile crypto assets like Bitcoin and altcoins.
How USDT Dominance Impacts BTC and Altcoins:
📈 USDT Dominance Rising: This usually signals fear or uncertainty in the market, acting as a bearish sign for BTC and altcoins.
📉 USDT Dominance Falling: Indicates growing confidence, often leading to a rally in BTC and altcoins.
Current Market Analysis:
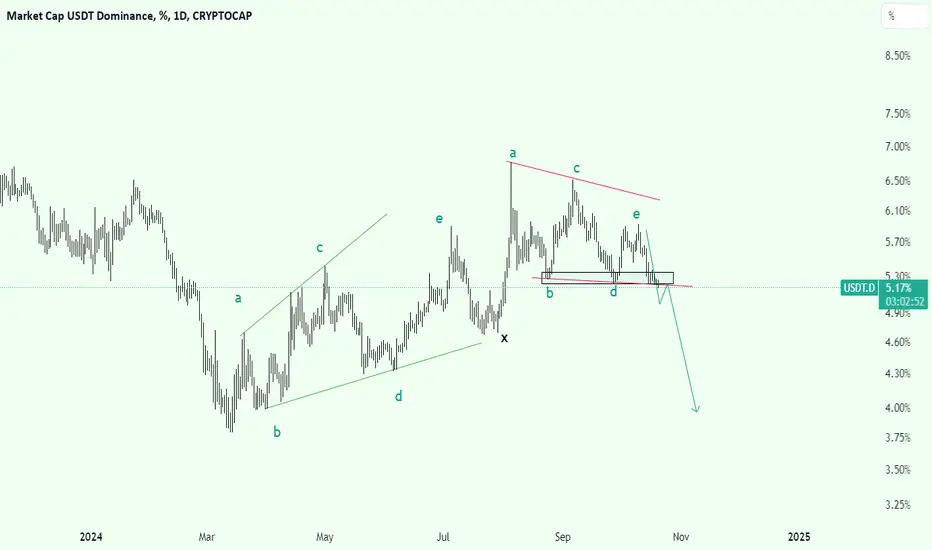
As shown in the chart, USDT dominance is forming a bearish flag on the daily time frame, which has already broken downward. It's now in the retest phase. Once this retest is confirmed, we can expect a significant drop in USDT dominance, likely triggering a strong pump in BTC and altcoins.
In my opinion, this could be the last good opportunity to accumulate BTC and promising altcoins before the next market rally.
What are your thoughts on this bearish pattern in USDT Dominance? Share your views in the comments below!

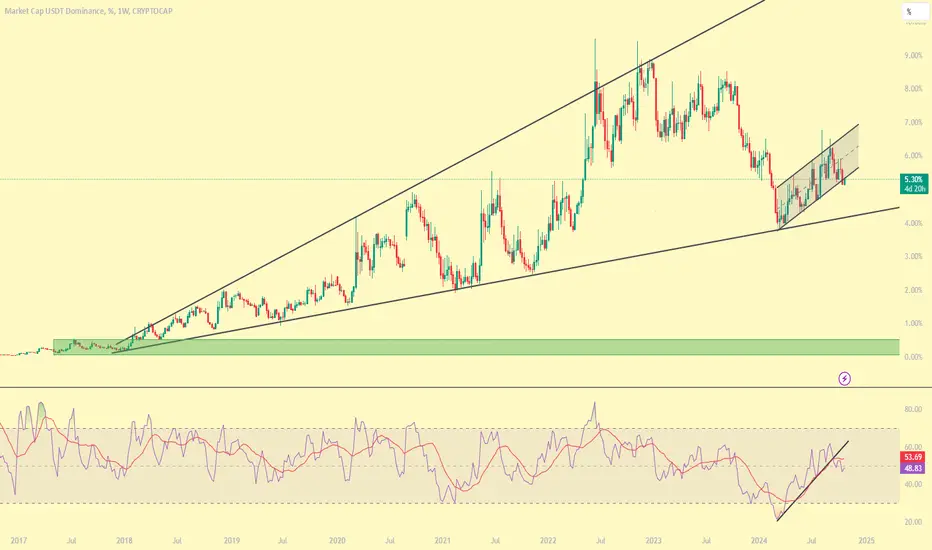
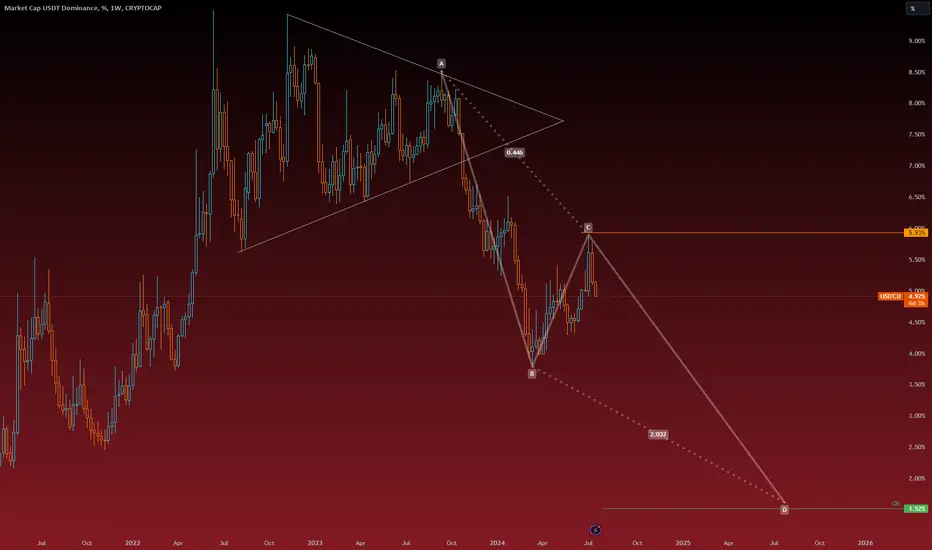
USDt.dSo we have a 8 year bearish consolidation pattern that is likely to break to the downside... The bear flag just broke on the weekly. So how bearish can we be on crypto?
usdt , usdt dominance, usdt.d Launched in 2014, Tether is a blockchain-enabled platform designed to facilitate the use of fiat currencies in a digital manner. Tether works to disrupt the conventional financial system via a more modern approach to money. Tether has made headway by giving customers the ability to transact with traditional currencies across the blockchain, without the inherent volatility and complexity typically associated with a digital currency. As the first blockchain-enabled platform to facilitate the digital use of traditional currencies (a familiar, stable accounting unit), Tether has democratised cross-border transactions across the blockchain.
USDT dominance Break down confirmed!!Join our community and start your crypto journey today for:
In-depth market analysis
Accurate trade setups
Early access to trending altcoins
Life-changing profit potential
Let's analyse USDT dominance:
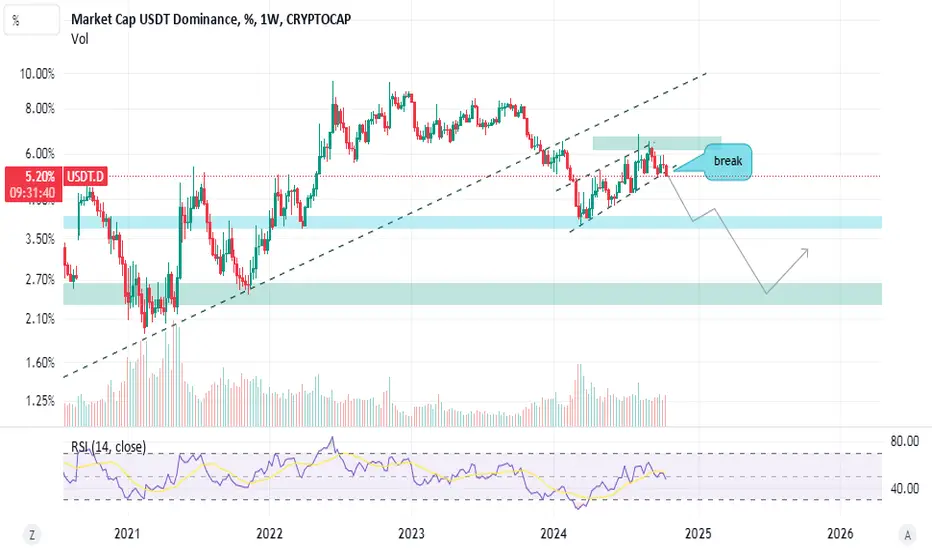
USDT dominance has recently broken below a rising channel, which it had been trading within for approximately 230 days. This breakdown could be a positive sign for both Bitcoin (BTC) and altcoins, as it suggests a potential shift in market dominance away from USDT towards BTC and altcoins.
The daily close confirmed this breakdown, reinforcing the bearish outlook for USDT dominance. A decline towards the support level of 5.06% is likely, followed by a possible retest before a further drop to 4.74%.
Key Levels:
Support: 5.06%
Resistance: 5.36%
If you find this analysis helpful, please hit the like button to support my content! Share your thoughts in the comments and feel free to request any specific chart analysis you’d like to see.
Happy Trading!!

Time to buy some crypto?USDT.D has broken out of an 8-month uptrend.
It seems that the crypto market will rise, possibly by around 30-40%.
Why not buy some crypto today?
usdt.d(D) [N.NZ]usdt.d(D) d in sup it can break to...or cp riz
MABY QM TO...but Mony flw isent Dat much g in usdt.d
Future_No_1_NZ
USDT.D Update the old chartSeems like time is not enough for alts.I expected them to rise until december.BUT they will up in 2025-2026 cycle I guess.Current btc reaccum target is 85k. CME:BTC1! BINANCE:BTCUSDT CRYPTOCAP:USDT.D
$70k Then ATH for $BTC Soon?Still following our use of the USDT Dominance Chart, we can see that the breakdown of the 5.3% resistance occurs as predicted. We should see all time highs for Bitcoin soon. Not a bad time to long your favourite coins; currently long on CATUSDT. Would post the chart next.

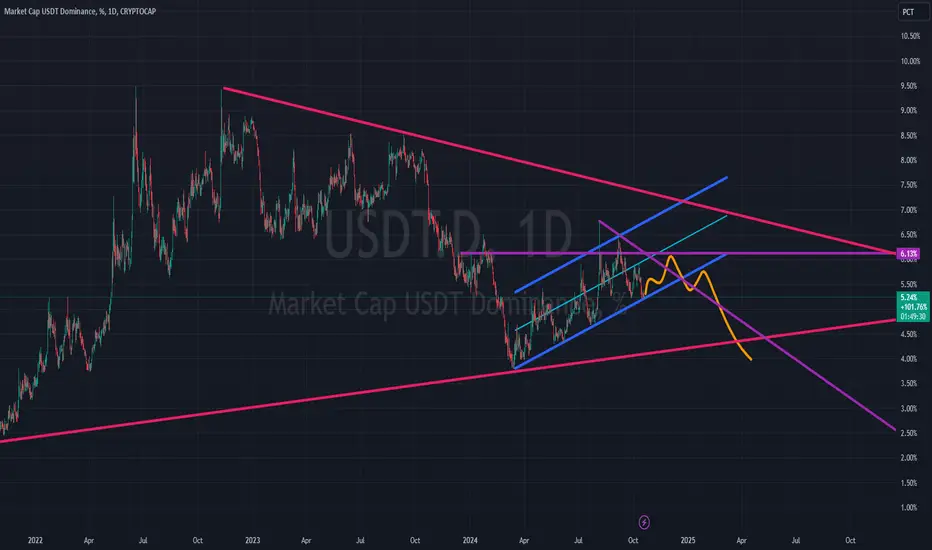
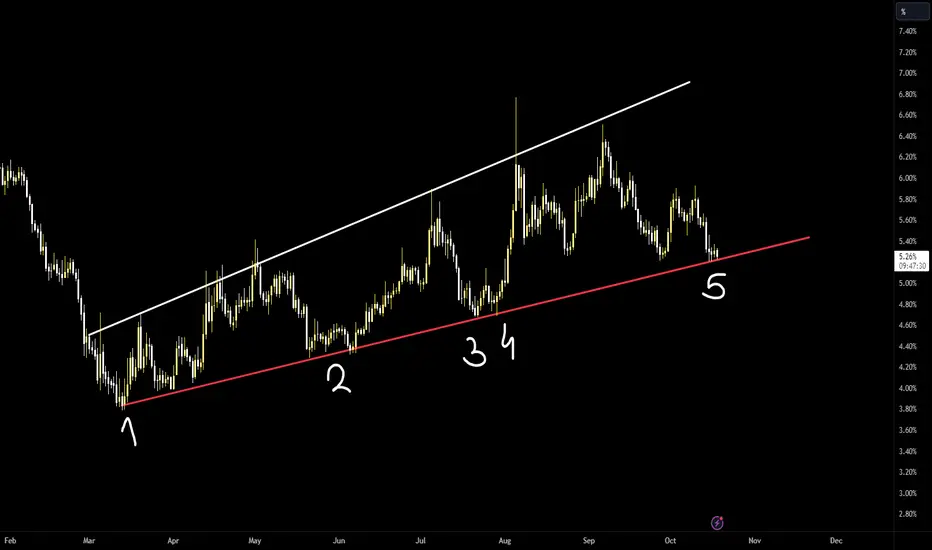
USDT dominance on the verge of a breakdown- it seems that USDT d. is mirroring btc with bitcoin being in a bullish wedge and dominance in an ascending broadening wedge which tends to be a bearish pattern
- price action looking like distribution and with the 5th touch of the trendline it is likely the macro broadening pattern resolves to the downside
- a breakdown that should be bullish for crypto
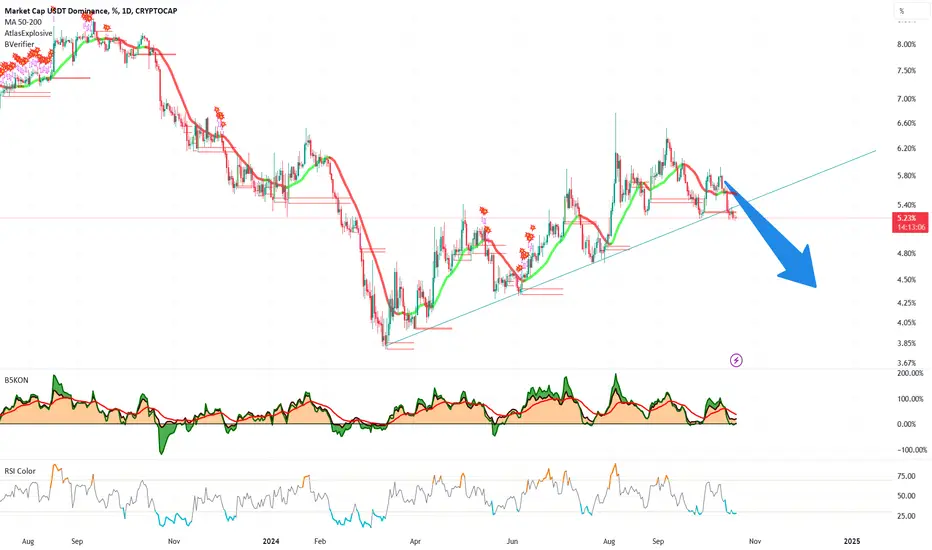
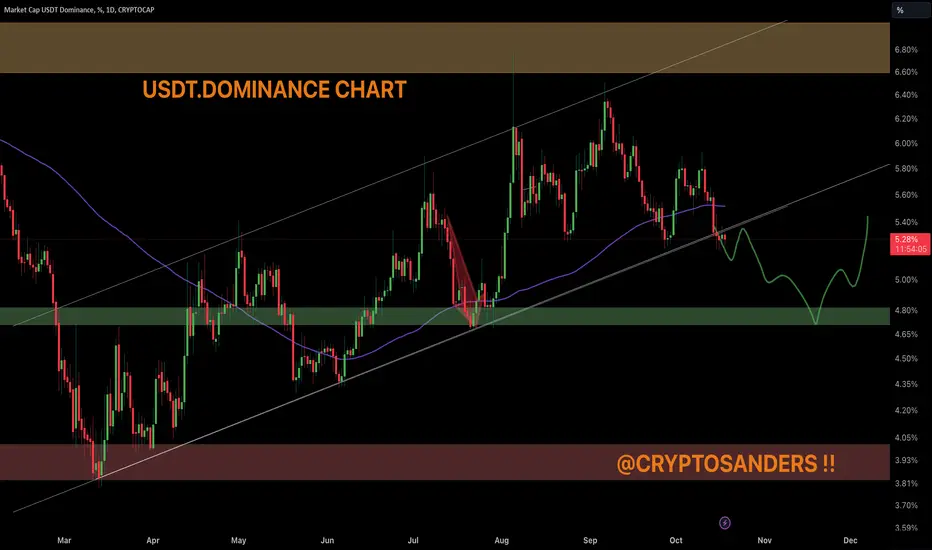
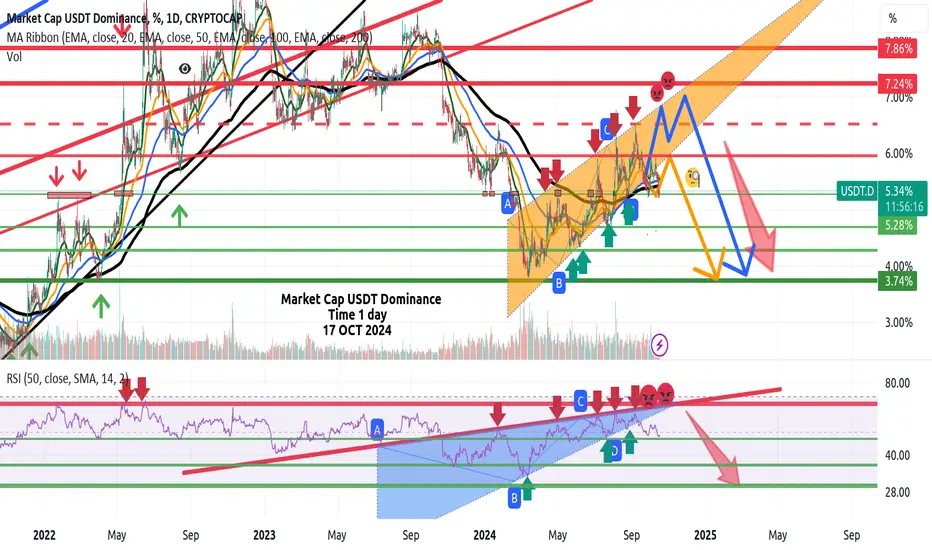
USDT.DOMINANCE UPDATE !! USDT dominance shows that the breakdown from the ascending channel pattern is being confirmed as the 100-day moving average remains below both. This indicates bearish momentum in USDT dominance, which often inversely correlates with the broader crypto market.
USDT dominance has successfully broken out of the ascending channel pattern and is staying below key support levels, strengthening the potential for further declines.
The 50-day and 100-day moving averages are acting as resistance barriers, suggesting that bearish momentum may continue to push prices lower.
A continued decrease in USDT dominance is usually a bullish signal for the crypto market, as funds may flow from stablecoins like USDT to other cryptocurrencies.
USDT dominance continues to decline and fails to rise above key resistance levels, it could signal a shift in market sentiment towards a more bullish trend for the broader crypto market. This chart update should be closely monitored as it could have significant implications for potential price movements across various crypto assets.
Disclaimer: This analysis is for informational purposes and is not financial advice. Always stay updated with market movements and adjust your trading strategies as needed.
You can DM us for information on any other coin.
@Peter_CSAdmin
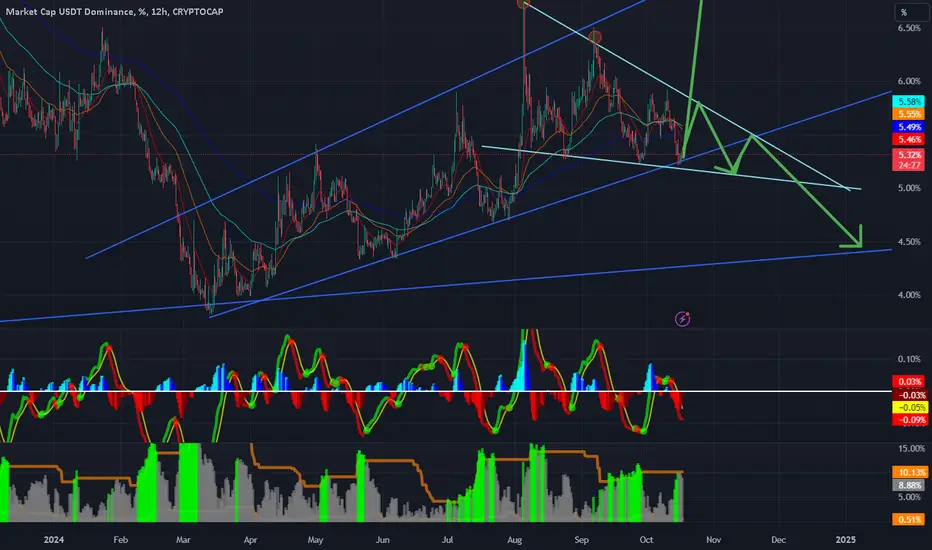
USDT 12 H AnalysisUSDT Started channel since April 2024
This channel is still moving same shape
Right now is critical moment if we broke it down we will touch weekly support (Bull RUN)
If we could not we may move in the lower Channel or even worse by touching the top soon
which may lead to Crash market
Better wait not taking decision now till the direction is clear .
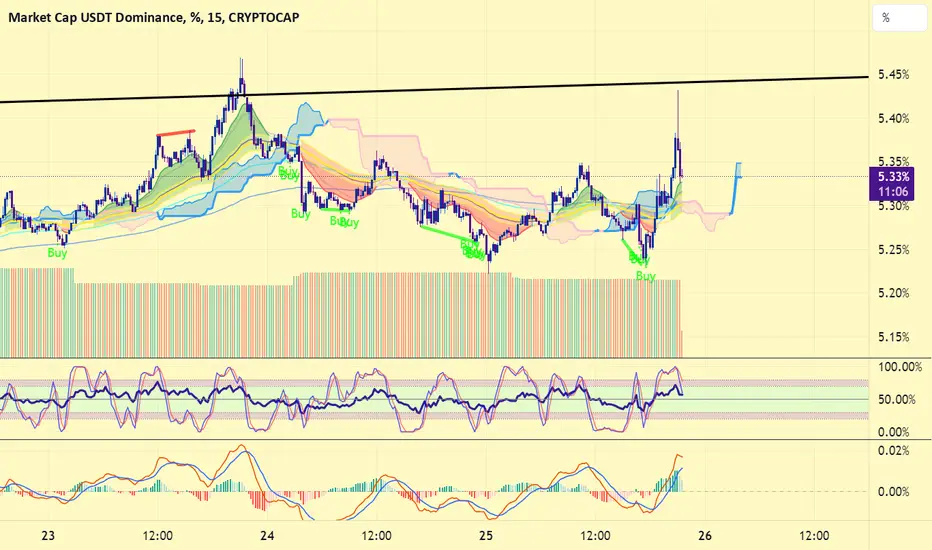
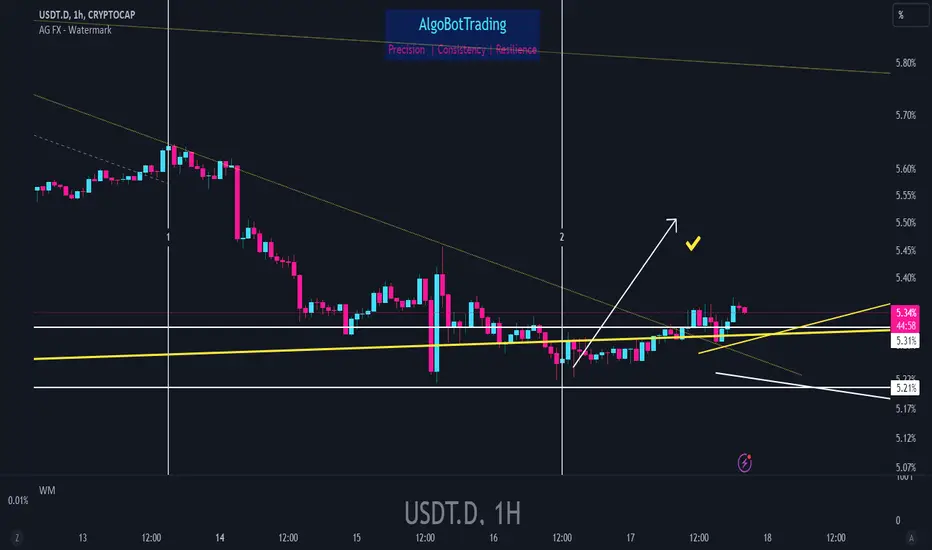
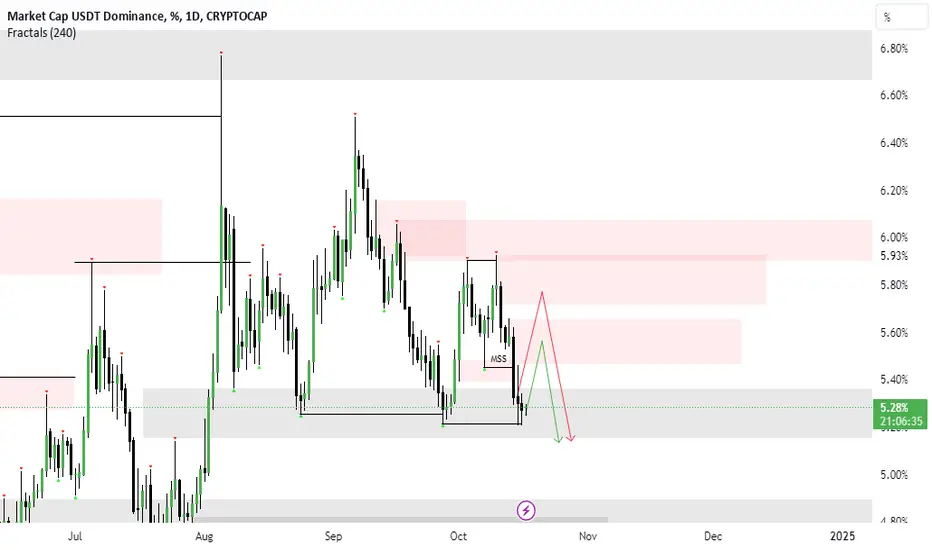
USDT.D 1H update - Oct 17 2024So far so good! #USDT dominance has managed to hold above 5.21% level and has crossed above its descending trendline according to yesterday's analysis.
it seems USDT.D is heading for 5.46% as the first target so it's safe to assume that BTC and other coins will probably dump some more.
USD.D Forcasting (Update)Always and at all times. All events will occur in the chart.
Trend Prediction - USD.D Forecasting - Resistance and Support Lines
**** Yousef Sharafi ****
Follow me here for more analysis
USDT D Order Flow continuesas my view USDT D continue to down trend, but at this point USDT D will bouns back to the valid sell areas, its can effect to the all ALT market to hardly, NFA
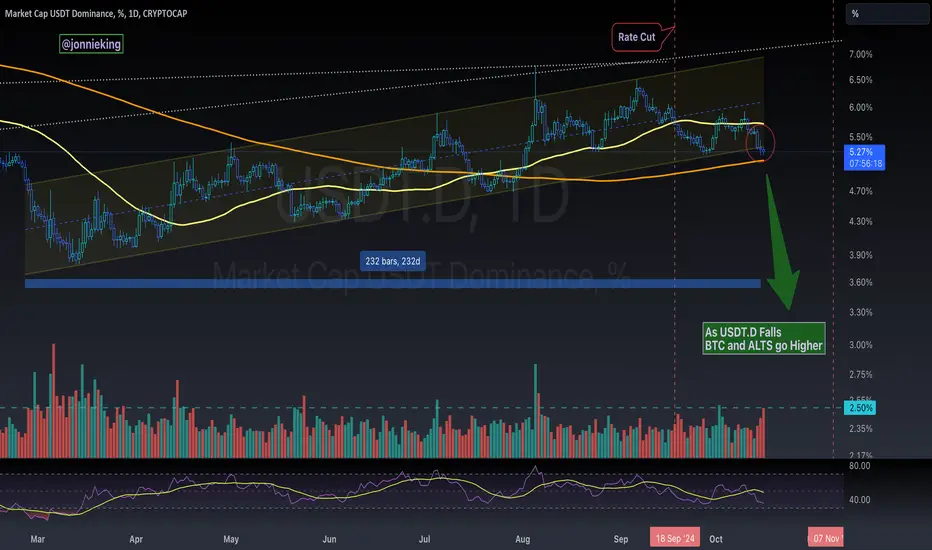
$USDT Dominance BREAKS OUT of 232 Day Parallel ChannelCRYPTOCAP:USDT Dominance has broken out and Closed below its 232 Day Parallel Channel.
Expecting a test on the 200DMA.
Once that breaks, and we get the Death-Cross, CRYPTO GOES PARABOLIC
I’ll post a full breakdown of the Weekly Close on Sunday.
End of cycle target will be 2.5%
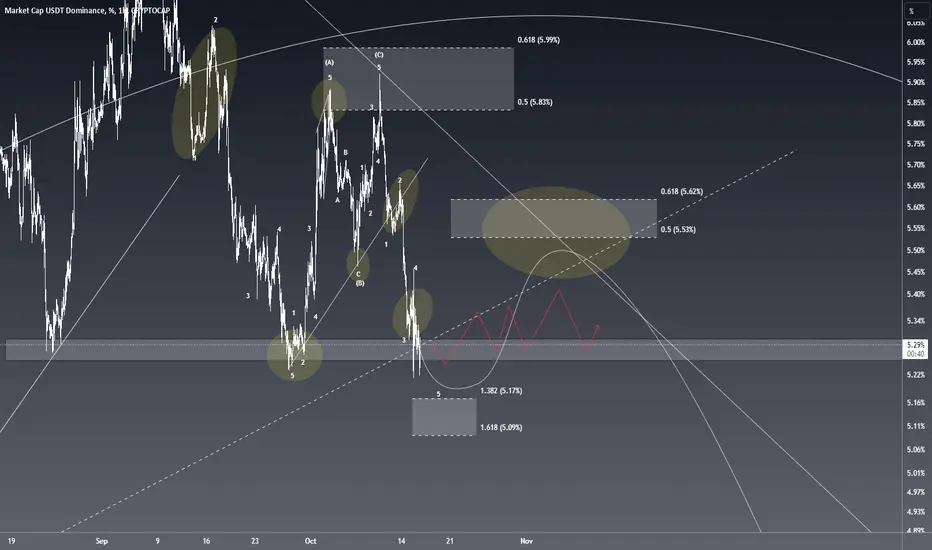
USDT.DWe expect two types of correction scenarios. 1- In the form of erosion correction. 2- Correction to the Fibo range, so I think the price will continue to fall.
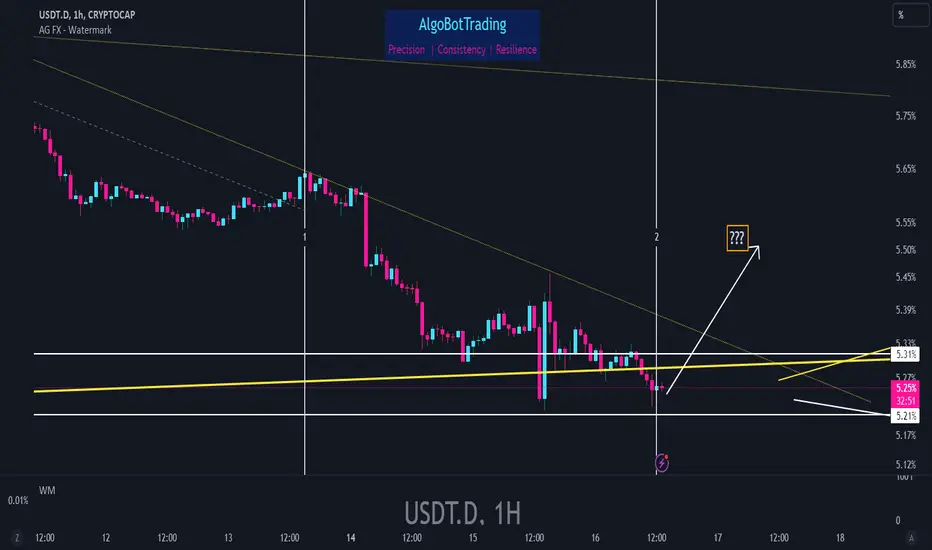
USDT.D 1H update - Oct 16 2024While BTC has touched levels above 66,500 (not a solid daily close yet), USDT dominance has not yet broken below the 5.21% level and some bullish signs are visible. Since the chart has reached a time element in 1H timeframe and will reach the 4H time element by Friday, we might see some upward reaction in USDT.D meaning that there will probably be some dump in the market.
if demand doesn't add up in USDT.D, it will break the support zone and the entire market will pump following a daily close below the 5.21% level.
As it's already stated, market's in a critical zone atm.