USDT.D UPDATEThere is such a formation in USDT dominance and it is about to break. Often, to trigger this type of formation, they first do the opposite and then start it. It is worth being careful. Don't be in a heavily loaded coin.
USDT.D trade ideas

usdt.dHello friends (I haven't been watching the market for a long time because a lot of bad things happened to me in the last year). Today I was watching the crypto market and I saw that Tether's dominance could move in this direction. I wanted to share with you and this is just my personal opinion. Good luck.

July 2025 - Will Tether (USDT) decouple from its $1 peg in 2025?Firstly, it is not the intention of this post to spread FUD (Fear, uncertainty, & doubt), but rather a word of caution to all who use USDT. You should read this idea in conjunction with the recently published “ Is Alt season dead? - June 2025 ” idea, there’s a remarkable alignment between them, should you understand what the 6 week chart above is telling you.
The argument presented here is for a failed redemption request on the Tether network, ultimately resulting in the collapse of the Tether stable coin. The event is expected to occur during the month of September, which will be the expected end of the Bitcoin bull market.
Throughout the years freshly printed USDT has been the life blood of alt tokens, that’s a fact. As supply and dominance increase, so does the size of the alt token market (including Ethereum). Those two conditions are an undeniable fact, look left. Fresh USDT is the alt token traders drug, they're addicted. Jump down to Reason 3 for a detailed comparison.
We’re now heading into a period of time where the opposite appears to be unfolding, and no one is talking about it. No one. But more on that later. This is about Tether itself.
Whatever is about to happen to Tether, it will be a first in its near 11 year history. You only need look left to see, this time is very different from previous market cycles. In the near term (weeks ahead) a collapse in Tether dominance is likely to print. Ultimately this will be at first a good thing for the alt token market, at least that’s how it will be perceived, but afterwards..
If you’ve studied the $1 peg failure of Terra Luna’s stable coin, then you’re likely looking at USDT.d chart and wondering where you’ve seen this before. The Luna crypto network collapsed in what's considered the largest crypto crash ever, with an estimated $60 billion wipeout, life savings were lost, dreams crushed. Many lost a great deal of money they thought was safe. Could the same happen with Tether? And what could cause such an event?
Let’s explore this…
What is the Tether stable coin?
The core idea behind USDT is that each token is backed 1-to-1 by real U.S. dollar reserves. This is what's supposed to give a "stablecoin" its value, it should always be tradable with $1 USD. Unlike a bank, Tether does not create money, it digitises it, which is sort of how you use your debit card to make purchases every day. Real cash never touches your fingers, the only difference is the money in your bank is insured, protected by the government in the event of default, whereas your USDT.. it is a private company, if it fails, it’s gone.
Naturally Tether does not maintain a real cash equivalent for each USDT token in circulation, that would be impractical for a profit making business. Ironically, Tether is more liquid than most high street banks. And yet, there’s a growing risk ignored by the market. In fact, during research of this idea, it is surprising how far under the RADAR this risk has gone unnoticed. It is the same risk that allowed US Banks, Silicon Valley Bank and Signature Bank to fail (chart at bottom of page, does it look familiar to above?).
The collapse - but how?
Reason 1 - BONDs, Precious metals, & Bitcoin market exposure…
Tether has become one of the largest holders of US Treasury bills globally. Reports indicate that exposure to US Treasuries (direct and indirect, via money market funds and reverse repo agreements) has approached or exceeded $120 billion as of Q1 2025. As a matter of fact it is said so on their own website.
In the last audit (March 2025) where it was recorded, a U.S. Treasury Bill exposure of $98.5b “with a residual average maturity of less than 90 days”, to use their own words.
Source :
In their own words “The breakdown of the reserve backing the fiat denominated Tether tokens in circulation is.. . “, the highlights:
A precious metal exposure @ $6.6 billion and spot Bitcoin reserves @ $7.6 billion and somehow secured loans of $8.8 billion (plot twist, Micro strategy! Or Strategy as they’ve now chosen to name themselves) and around $64 million in cash.
The total assets as reported tied up in various financial instruments: $149,274,515,988, with approximately 66% tied up in the Bond market (and let’s ignore both Bitcoin and Gold are at historic overbought levels, $13.2billion is at considerable exposure to volatility.)
Circulating tokens: 158.6 billion
$149,274,515,988 (Reserves) / 158,600,000,000 (Tokens) ≈ 0.9412 per token
At this moment in time should the market exercise a full redemption request (very unlikely), 94 cents is the best they could offer, which is I stress, better than most high street banks. However the argument is not the backing, it is the access to it. Just as with Silicon and Signature banks, Tether appears to have ample liquid assets, but can it access them when it needs to?
If Tether needs to increase its cash position to support the network with real cash during a sudden demand spike, treasuries must first be sold. You may have noticed, but right now buyers for US treasuries are not exactly lining up outside the door to offer America cash. You don’t want to be a large holder of US treasuries during a period of rapid falling demand.
90 day US Bond market is on the verge of collapse. Imagine one of the largest holders of 90 day treasuries at this juncture. Sell into strength, not collapse.
Reason 2 - Inability to meet redemption demands
Tether's peg relies entirely on the market's belief that 1 USDT can always be redeemed for $1 USD, regardless if the liquidity is there. This uncertainly ultimately caused Terra Luna’s stable coin to de-couple. Trust took years to build hours to lose.
If this belief falters, or if the mechanism for redemption breaks even if only for hours, the peg collapses. Bond market exposure introduces several pathways to this breakdown:
Liquidity Mismatch, the "Run on the Bank”:
The Problem: Bonds, even highly rated ones, are not instant cash. Selling large quantities of bonds takes time, and doing so quickly can depress their price, especially if the market for those specific bonds is thin or stressed.
Imagine a widespread loss of confidence in Tether (perhaps due to rumours, a major regulatory action, or a general crypto market crash). Millions or even billions of dollars worth of USDT holders rush to redeem their tokens for actual USD.
The de-peg: If Tether's $120 billion (or a significant portion) is tied up in bonds that cannot be sold quickly enough at their face value, Tether would be unable to meet all redemption requests promptly. This would lead to a backlog of redemptions.
As the market sees that Tether isn't honoring redemptions on demand, panic sets in. USDT holders would then try to sell their USDT on secondary markets (exchanges) for less than $1, accepting a discount just to get out. This is the decoupling.
Reason 3 - An important alignment with " Is Alt season dead? - June 2025 ” idea
Historically, the relationship between USDT dominance and alt token performance is often seen as inverse. Here's why:
USDT as a "Safe Haven" when the crypto market is in a risk off phase, or experiencing uncertainty, investors tend to move their capital into stable coins like USDT. This increases USDT dominance, as a larger percentage of the total crypto market cap is held in USDT. During such time alt coins often struggle as capital flows out of them.
Capital rotation into alt coins (aka alt season): Conversely, a decrease in USDT dominance is often interpreted as a bullish signal for alt coins. It suggests that capital is moving out of stable coins and into riskier assets, including Bitcoin and then alt coins, in search of higher returns. This period is often referred to as "alt season" where alt coins significantly outperform Bitcoin. (This worked well prior to the Bitcoin ETF as liquidity entered spot Bitcoin, which would then eventually turn to the alt token market. However in this cycle the liquidity is trapped inside ETFs (Exchange Traded Funds). But this dichotomy will not arrest the enthusiasm of rose tinted glasses wearing influencers.)
Is it that really true, a general fall in dominance is good for the alt token market?
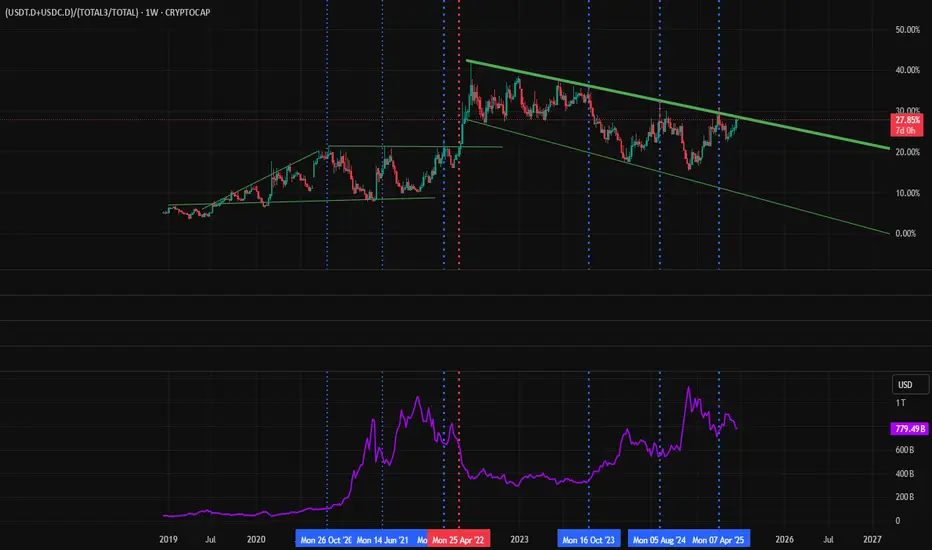
An overlay of TOTAL2 (market capitalisation of all tokens except Bitcoin) on the chart of Tether Dominance since 2016 (below) reveals a contradiction to this popular belief that declining dominance benefits alt tokens.
The chart clearly shows that strong Tether dominance is necessary for strong alt token market performance, especially after each Halving (vertical yellow lines). Influencers throughout the space are now calling for amazing performance well into 2026, how can this be compatible with a clear trend reversal in USDT dominance?
6 week TOTAL2 compared with USDT dominance since 2016
Why is this change in Dominance a de-pegging risk?
Recall in reason 1 the Bond risk, the time it might take Tether to liquidate treasuries to service redemption requests (remember the business is operating with a small cash position as percentage of their market capital). Keep this number in mind. Now flip over to the “ Alt season dead? - June 2025 ” idea, notice the bear flag forecast? It calls for a correction of around $200 billion, returning the market to 2017 levels. A 50% correction across OTHERS, if into USDT, would demand the complete liquidation of Tethers Bond position. But why? In a word, contagion. Especially amongst DeFi protocols.
It is worth remembering the OTHERS market total ticker is limited to the top 125 tokens excluding Bitcoin, Ethereum, Tether, XRP, and BNB. The market will more than likely try to escape into USDT, but what if that is not possible? The supply of Tether tokens is finite. What if the supply is increased to service the sudden demand without the backing?
A loss of confidence. If USDT dominance collapses and alt coins fail, it could suggest a loss of confidence in Tether or stable coins in general.
A de-pegging event: A major de-pegging of USDT from the US dollar (i.e. USDT trading significantly below $1) would be a primary cause. This would erode trust in USDT as reliable store of value and a medium for trading, leading to a mass exodus.
Liquidity criss: USDT is the most widely used stablecoin for trading alt coins. If its dominance collapses due to a lack of trust, it would severely impact liquidity across the alt coin market.
Contagion effect: A collapse in USDT could trigger a wider contagion throughout the crypto system:
DeFi instability. Many DeFi protocols rely on stable coins as collateral, especially USDT. A USDT collapse would lead to liquidation events of a size never seen before in the alt token space.
Bitcoin as the “Ultimate safe haven”. I keep asking myself, where is the liquidity for Bitcoin’s final push to the $145-150k market top coming from? While Bitcoin is volatile as old wallets liquidate their positions at all time highs, in extreme crisis, Bitcoin is often seen as the last resort in crypto due to decentralised nature and first mover advantage.
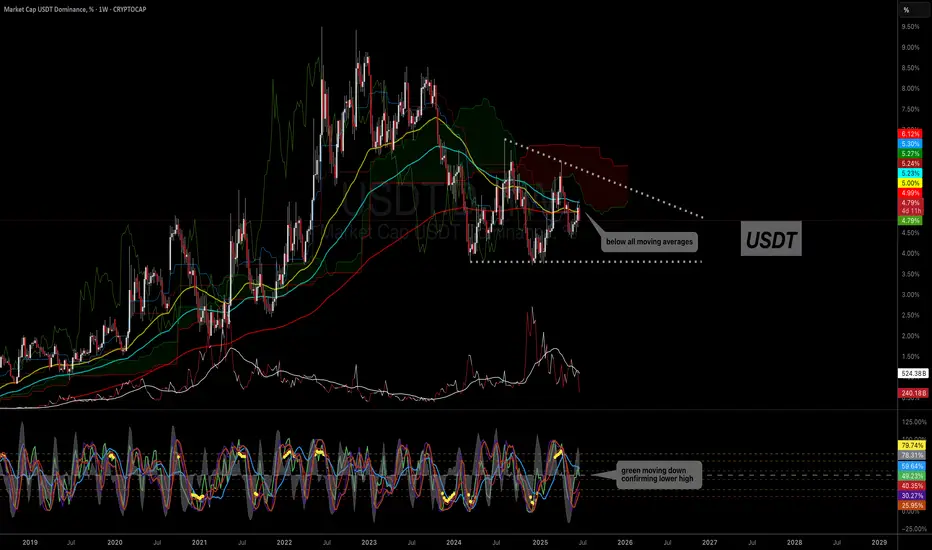
Reason 4 - The chart
The chart informs us something no user of USDT should ignore. For the first time in its almost 11 year history, dominance has printed:
1. A post Halving dominance collapse. Look left.
2. Broken market structure.
3. A Death Cross (available across multiple time frames)
4. Failed legacy support since 2018.
5. A collection of bearish engulfing and Gravestone DOJI candles.
If an increasing USDT dominance has historically been positive for alt tokens, then a macro reversal implies something very bearish for the alt token market going forward.
Notice the marking for each 4 year cycle alt token end point? Make a note of that!
Ww
Signature Bank before collapse

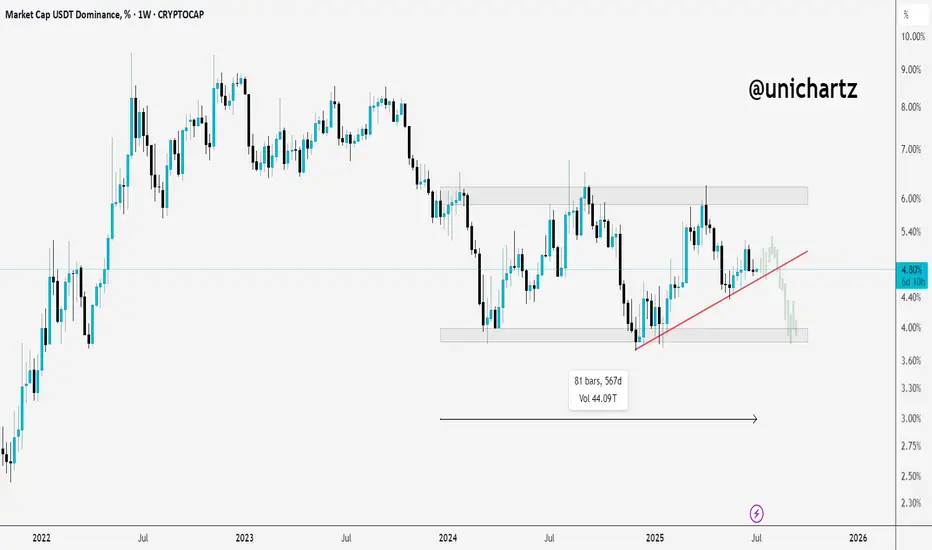
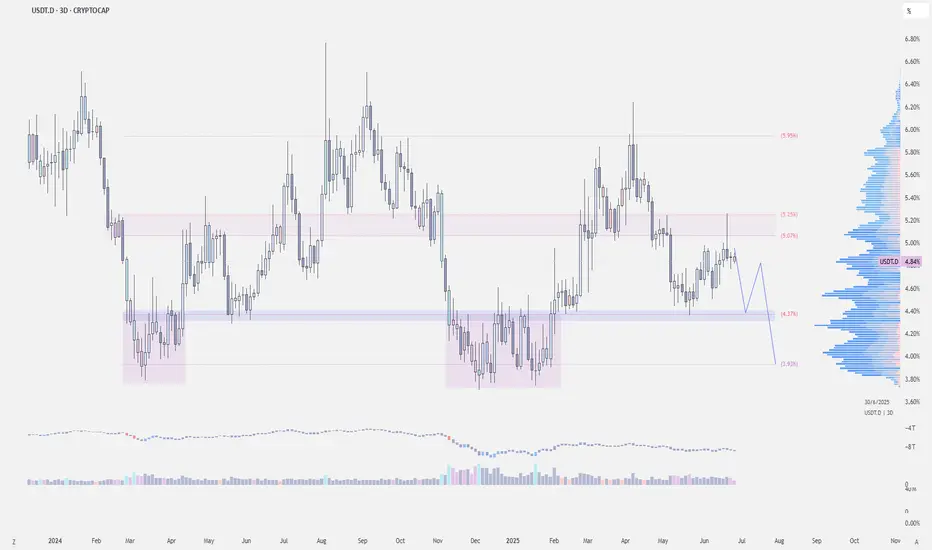
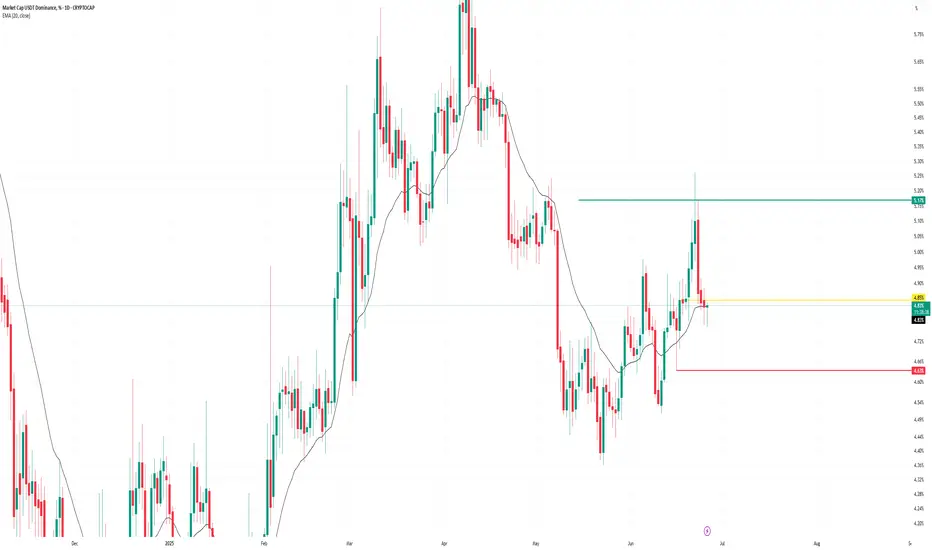
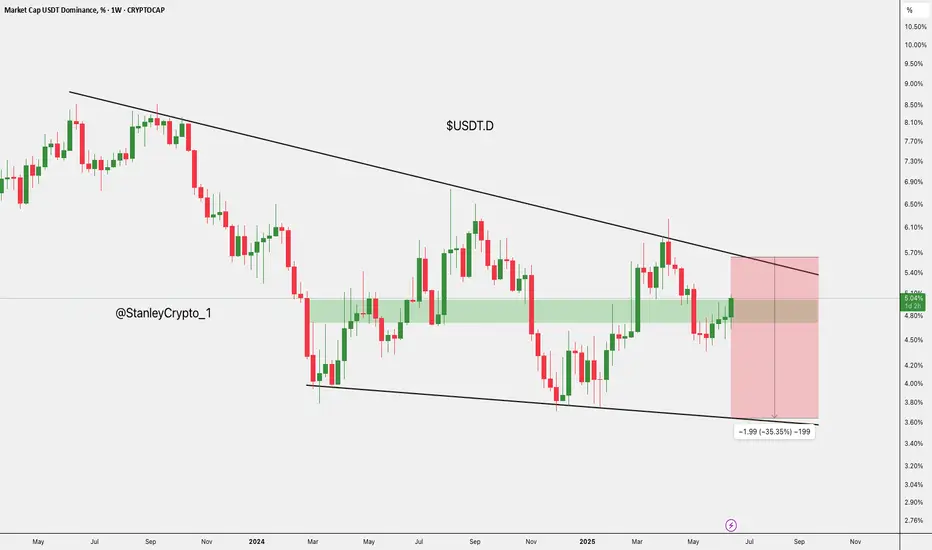
USDT Dominance Locked in Range – Altseason Not Ready Yet?USDT Dominance has been trading inside a wide sideways range for the last 567 days — bouncing between the 3.6% demand zone and the 6% supply zone.
The recent price action shows a rejection from the top of the range and now heading toward the mid or lower part of the channel. A minor trendline (in red) had shown some short-term support, but it looks weak now.
As long as this range holds, true altseason may remain on pause. The big move will come only when USDT.D breaks out or breaks down from this range.
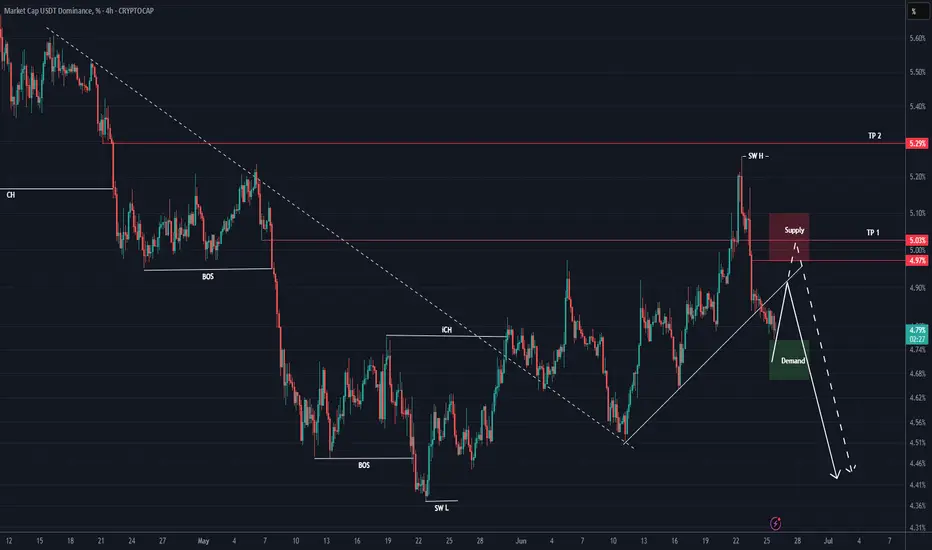
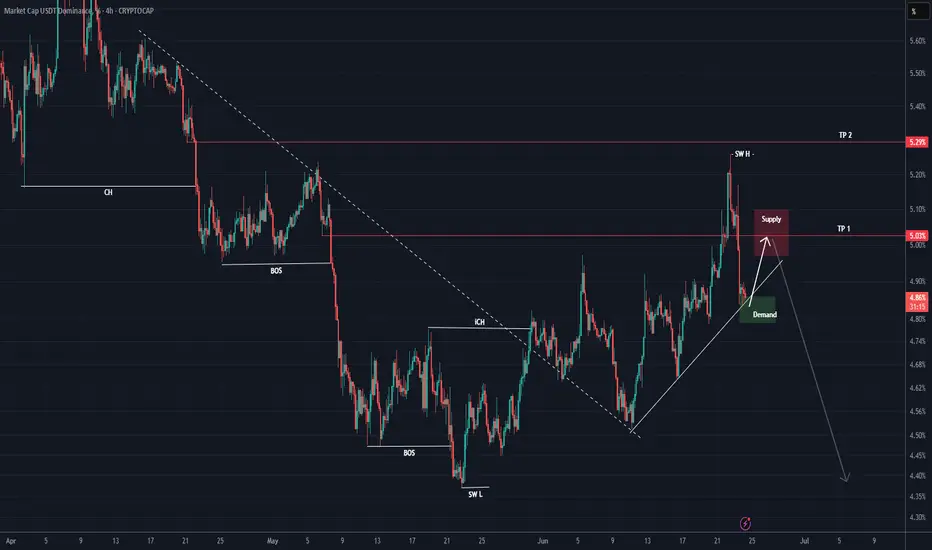
USDT DOMINANCE New Update (4H)This analysis is an update of the analysis you see in the "Related publications" section
The green box from the previous analysis was engulfed, and a new demand zone has been added to the chart.
Before the main drop, we still expect a pullback from this index
For risk management, please don't forget stop loss and capital management
Comment if you have any questions
Thank You
USDT cup and handleWell, we got some kind of cup, and we did touch the 0.5 fib, wiche could be the handle. If we break down this could mean there will be a alt season. For now i think most the low on most coins are in and we will make a nice rally.

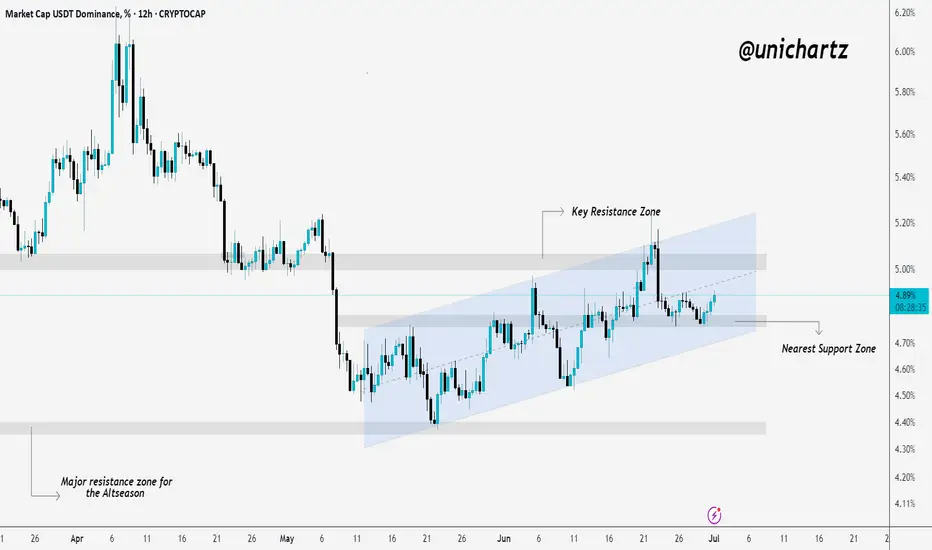
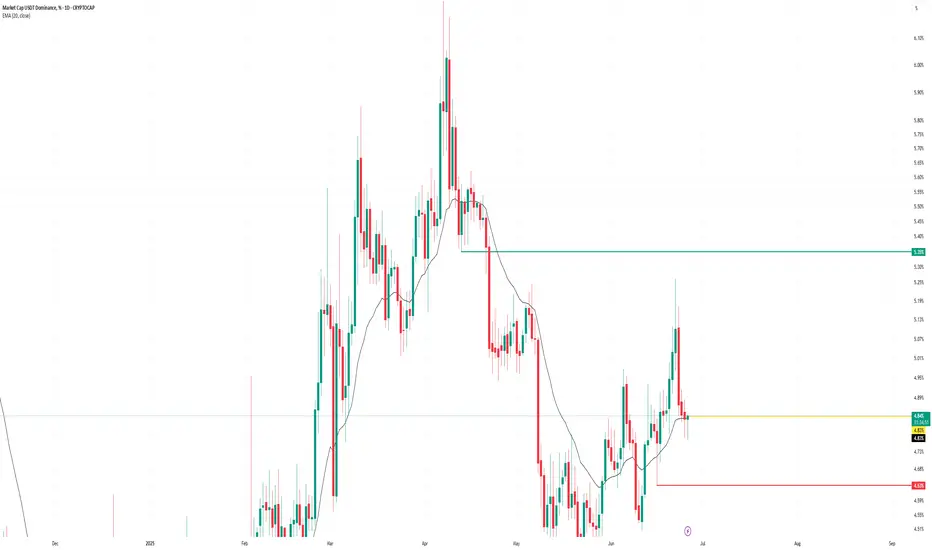
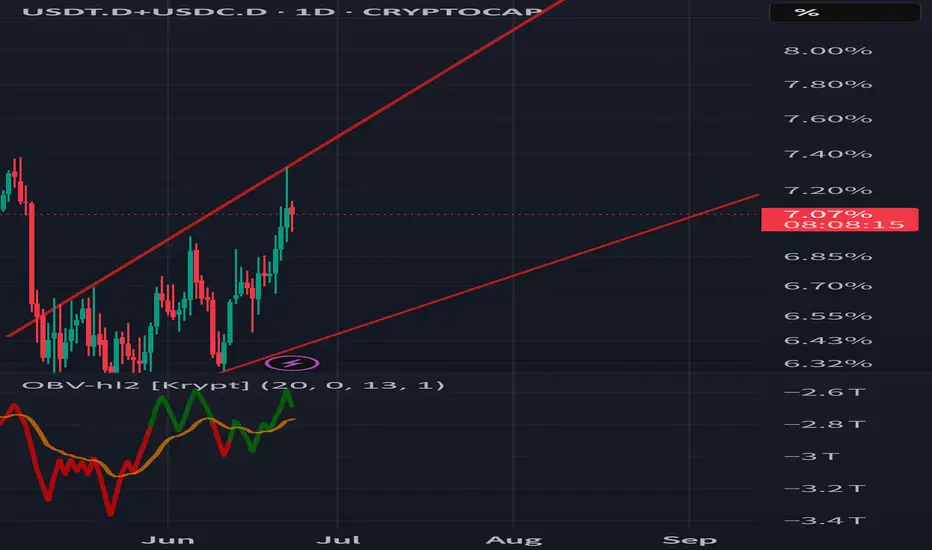
USDT.D Showing Signs of Bounce – Altseason at Risk?USDT Dominance is still moving within a rising parallel channel, holding just above the nearest support zone. After a brief dip, price is now showing signs of recovery from the lower boundary of the channel.
However, the key resistance zone near the top of the channel has proven tough to break — it rejected price on the last attempt.
Until we get a clear breakout or breakdown from this channel structure, the market may remain choppy. A breakout above 5.00% could signal risk-off sentiment (bad for alts), while a drop below the support zone may trigger altcoin momentum.
Stay cautious — the market is still undecided.
USDT.D HTF AccumulationThats the HTF accumulation model i use as confluence to the potential HTF BTC distribution. I have inverted the chart so it's easier to see. I am watching one of these 2 demand zones for either a model 1 or 2. Can't wait to see how it will play out.

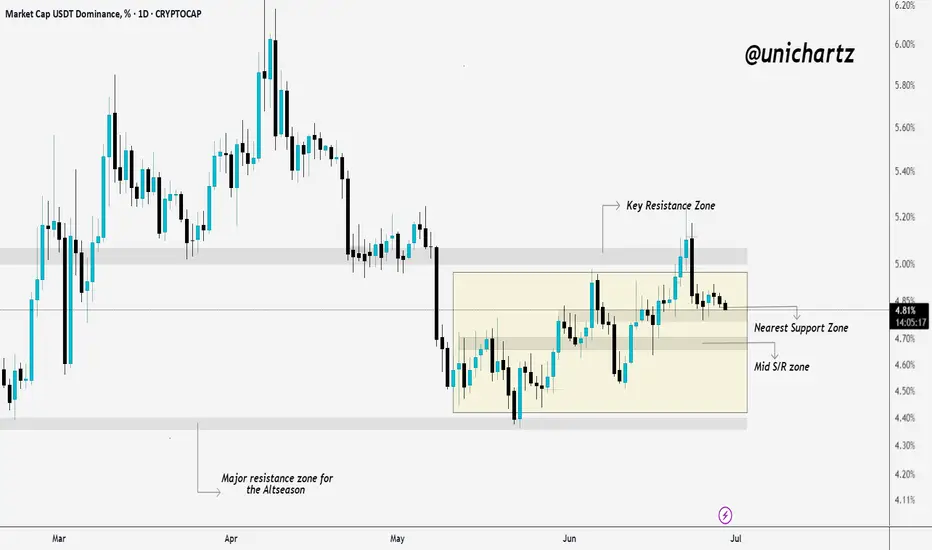
USDT Dominance Consolidating — Major Move Loading?USDT dominance is currently stuck in a sideways range between key resistance and strong support zones.
We’ve seen a rejection from the upper resistance, and now price is drifting toward the nearest support. If this zone holds, expect another bounce. If it breaks, altcoins could finally catch a strong bid — possibly the early signal for altseason.
No rush here. Just keep your eyes on that mid S/R level. It’s a key battleground.
$USDT.D: Bearish ChartCRYPTOCAP:USDT.D | 3D
Price action on USDT dominance has been significantly cleaner than CRYPTOCAP:BTC in recent weeks, providing much clearer pivot signals.
On the 3-day chart, we can see that the 5% level has turned into a strong supply zone and is currently being rejected. If the price fails to reclaim the 5% level, it will likely move back down toward the 4.30% level.
Outlook: Expecting CRYPTOCAP:BTC to sweep local highs while CRYPTOCAP:USDT.D remains bearish.
Potential downside levels: 4.5% and possibly even 3.90%
USDT - Head and Shoulders PatternA bullish head and shoulders pattern is an inverse head and shoulders. A bullish formation appears in a downtrend and signals a bearish-to-bullish trend reversal. The positions are opened according to the same logic as in a bearish modification. You need to expect the breakout of the neckline and its test. Then the bullish head and shoulders pattern stocks, for example, signals to enter a long.

USDT.D is primed to fallI'd say USDT.D going to fall to at least 2.85%. That's the golden pocket of the previous uptrend.
Marcet Cap of USDT Dominance Tether is fiat-collateralized stablecoin that offers individuals the advantages of transacting with blockchain-based assets while mitigating price risk. Tether is primarily issued on the Ethereum and Bitcoin blockchains and corresponds on a 1:1 basis with US Dollars sitting in bank accounts.
USDT - Hope AheadMorning my friends,
Figured I'd share a little bit of this USDT chart.
Deff showing a downtrend, even though our beloved coins are still suffering. Thats mainly because of BTC.D.
Once USDT moves lower, signaling a breakdown we should get a big relief, that if maybe paired with BTC.D moving lower as it is also near very strong resistance a bull market for alts will begin.
Keep an eye on this descending triangle breakdown.
Trade thirsty, my friends!
USDT DOMINANCE New Update (4H) First of all you should know that "USDT Dominance" is always moving inverse of BTCUSDT .
In this analysis, we want to examine this index on lower timeframes. It has reached a support zone and a trendline.
Ideally, we should see a pullback from the green box toward the red box.
There is a high chance of price rejection from the red box to the downside, which could lead to a bullish move in the market.
Let’s see how the price reacts to the red box.
For risk management, please don't forget stop loss and capital management
Comment if you have any questions
Thank You
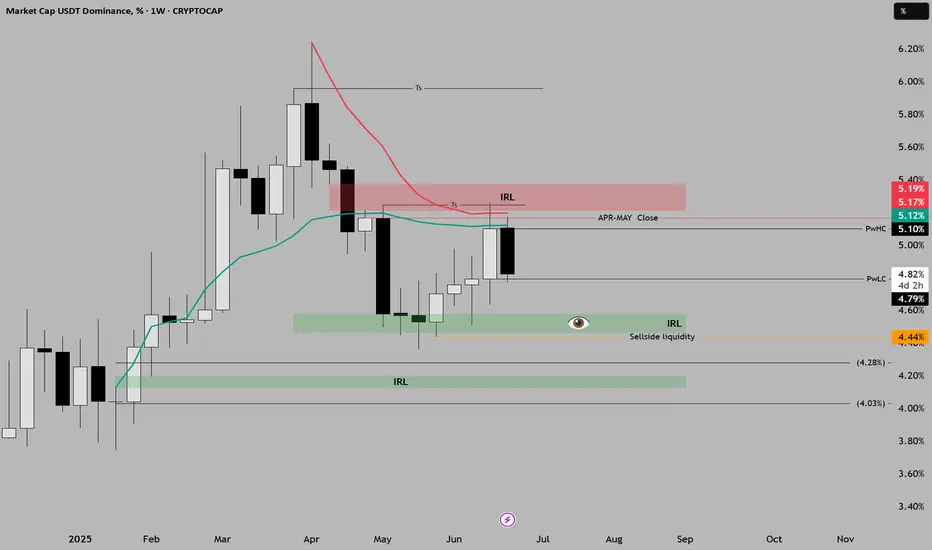
USDT Dominance Update USDT Dominance got rejected from the 0.5 Fibonacci level and has broken down from the rising wedge pattern.
There’s short-term support at 4.81%, but if that breaks, we could head toward 4.37%, a major demand zone where dominance previously bottomed out.
A breakdown to that level could trigger strong momentum in altcoins!
If you find my updates helpful, don’t forget to like and follow for more!
DYOR, NFA
#USDT #Dominance
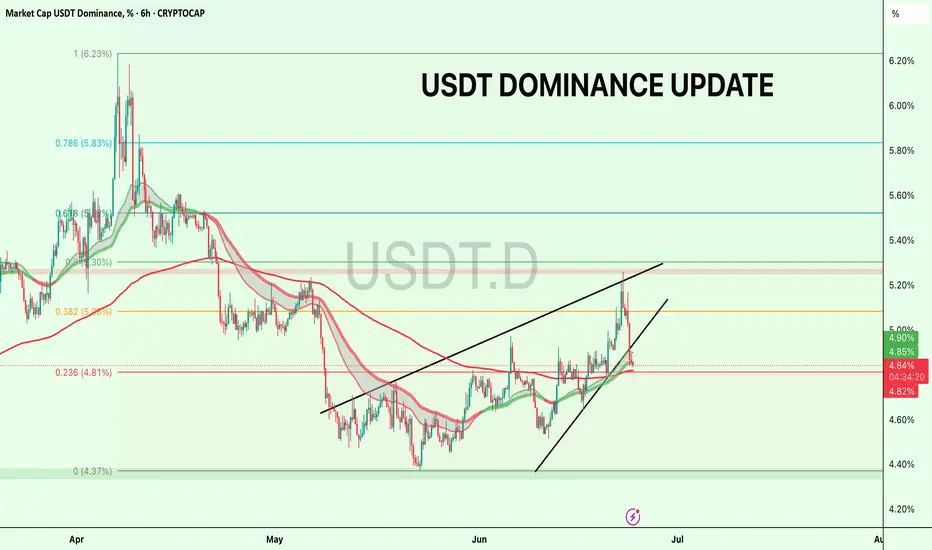
$USDT.D Reversal Incoming USDT.D is facing rejection at key resistance near 5% within a descending wedge.
If the trendline holds, we could see a sharp - 35% drop, a strong bullish signal for altcoins and the possible start of altseason.
DYOR, NFA
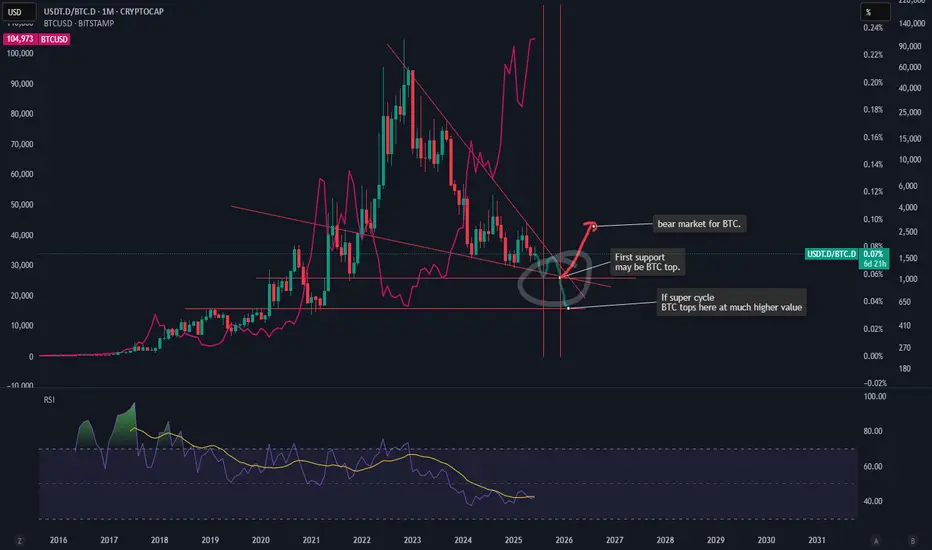
BTC: Top and bottom for this cycleHello
Looking at this chart, BTC will go make new ATH very soon and might peak out in Dec 2025.
As per previous cycle 2026 is going to be the bear market.
Trade carefully
Cheers $CRYPTOCAP:USDT.D/CRYPTOCAP:BTC.D
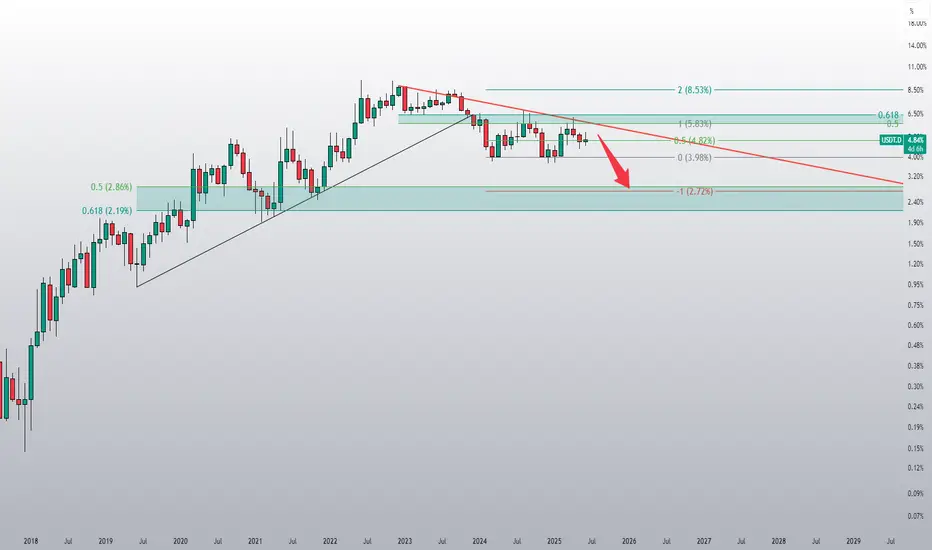
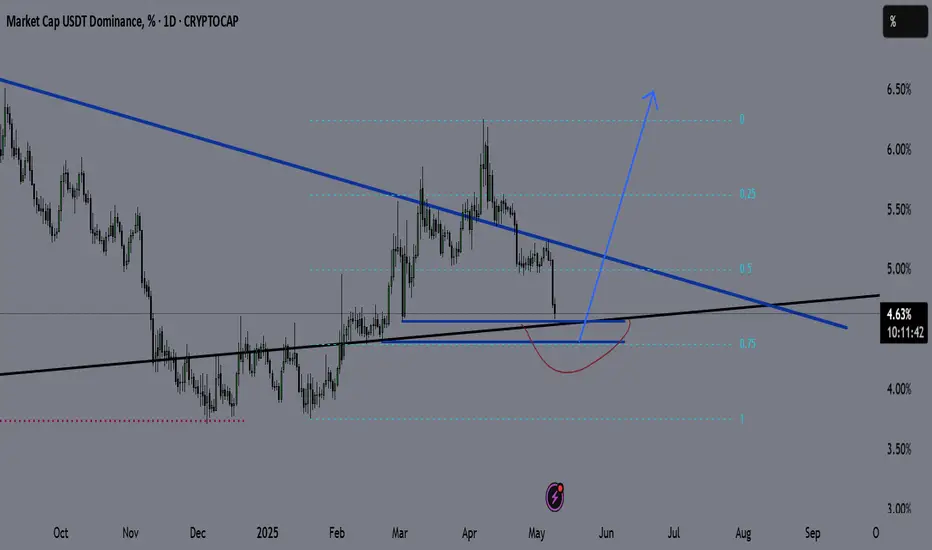
USDT.D LONG - MID TERM PLANUSDT.D is one of the best tools to understand what's happening in the crypto market.
It shows the dominance of USDT across the entire space — and has a strong inverse correlation with BTC and crypto assets.
Technicals:
USDT.D is approaching its long-term support trendline.
I expect a deviation below that line — possibly toward the 0.75 Fibonacci level — before a strong move up.
That move could last 1–3 months, which means more downside for alts during this time.
Plan:
Shorting altcoins — especially ETH-related tokens and memecoins.
Looking to buy back around early August.
AvroAvro Ta. 2025. for andrew only.It’s useful to look at stock market levels compared to where they’ve been over the past few months. When the S&P 500 is above its moving or rolling average of the prior 125 trading days, that’s a sign of positive momentum. But if the index is below this average, it shows investors are getting skittish. The Fear & Greed Index uses slowing momentum as a signal for Fear and a growing momentum for Greed.