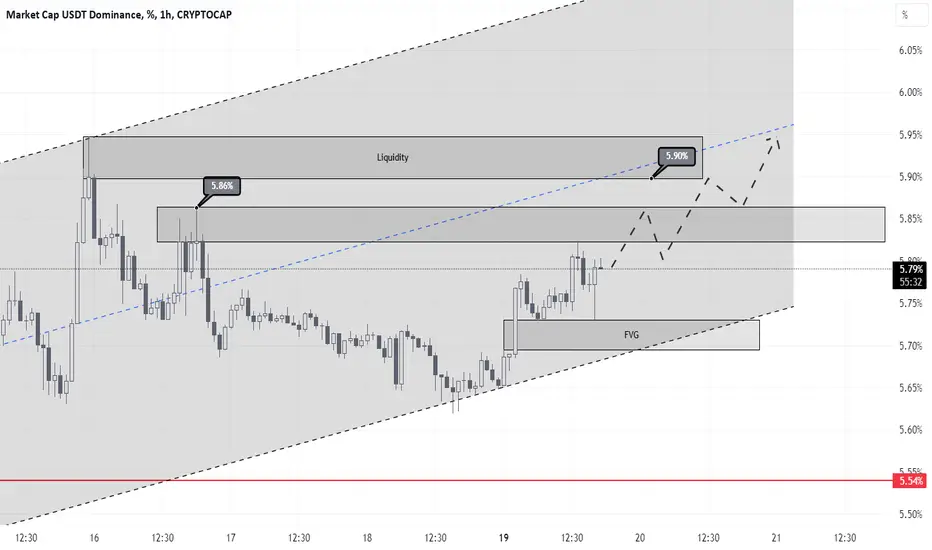
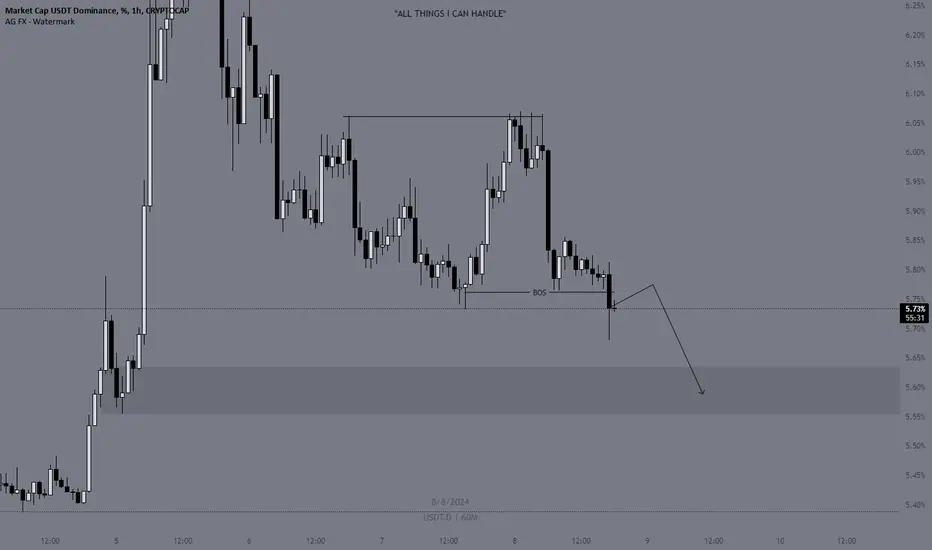
Analysis of Dominance by the mallicast TeamFor the analysis of USDT Dominance on the 1-hour chart, the following prediction can be made:
Currently, USDT Dominance is around 5.73%, which is considered a liquidity gathering zone. Given the current conditions, there is a possibility for USDT Dominance to rise to 5.86%. After reaching this level, a corrective drop to 5.80% might occur. Following this correction, a further rise up to the 5.90% area is anticipated.
In summary, USDT Dominance is expected to first rise to 5.86%, then experience a corrective drop to 5.80%, and finally, see another rise to 5.90%.
USDT.D trade ideas
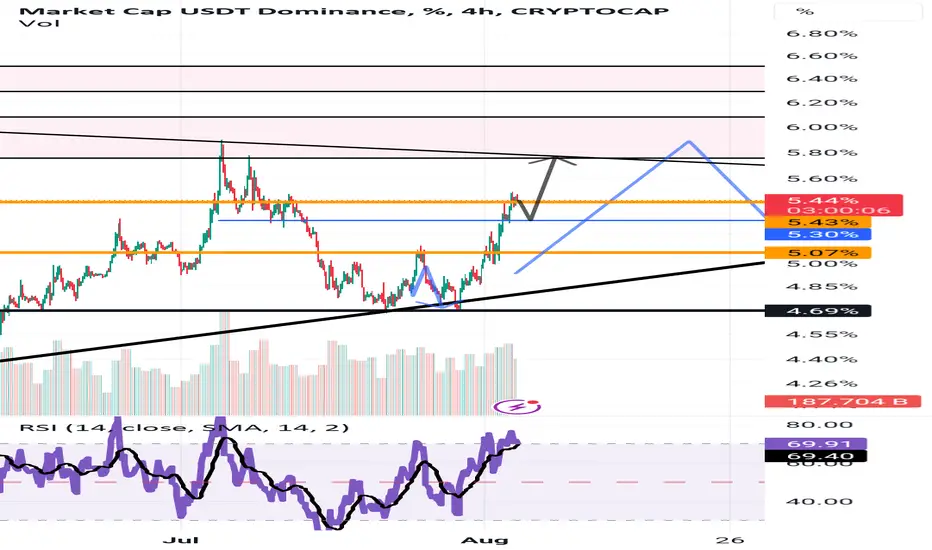
USDT Dominance (USDT.D) Short Update. USDT dominance is currently trading within a symmetrical triangle formation. The price has been recently rejected at the Ichimoku Cloud resistance level, leading to a slight pullback. However, the 200-day moving average (200MA) remains a key support level beneath the current price, suggesting the potential for a bounce if the price reaches this area.
If USDTD breaks below the 200MA, this could indicate a decline in dominance, which may lead to an upward movement in the broader cryptocurrency market. Traders should keep a close eye on these technical levels to anticipate a possible breakout or breakdown, which could provide insight into the next significant market move.
Stay vigilant and adjust your strategies according to these key technical indicators.
Remember: This is not financial advice. Stay tuned to us for further updates and analysis. Thank you!
USDT Dominance Update.. Bulls wake up!USDT Dom weekly chart looks bearish,
5.6% is hard resistance, tether dominance next Target will be 2% if it cant break the resistance.
Boost & Follow 👍👍

USDT.D on a mission USDT.D is on a mission. After BTC dumped with positive/neutral CPI USDT/D faked out and is now going back to the spring in order to jump to new highs.
Let's see if this plays out.
USDT.DIn my opinion, wave 4 of 3 is completed in the form of a triangle. For wave 5 of super wave 3, I expect a correction of the target indicated on the chart.
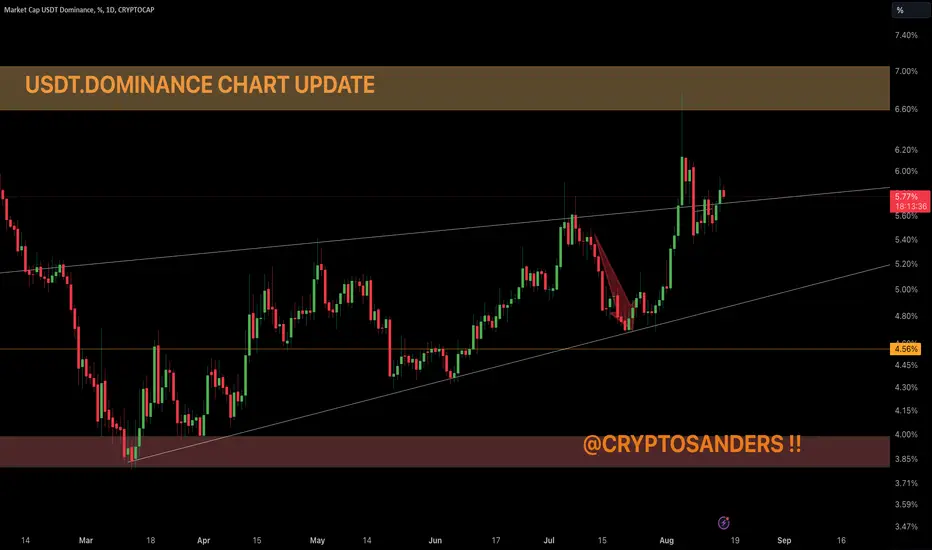
USDT.DOMINANCE 1DAY CHART UPDATE !!USDT dominance is currently holding above the critical support level of 5.20%. A bounce from this level could lead to a retest of the 6.00% resistance, with a potential breakout targeting 7.00%. Conversely, a break below 5.20% might lead to a decline towards 4.56%. Traders should watch volume and RSI signals to gauge market sentiment and potential reversal points.
Remember: This is not financial advice. Stay tuned to us for further updates and analysis. Thank you!

$USDT dominance still strong #usdt #tether dominance price had the correction of last pump aka #btc + #altcoins dump an now bouncing. It' ll be wise to watch out.
USDT.D - SHORTA clear BOS with market structure shift looking forward to go down even further, good for btc longs lets see.
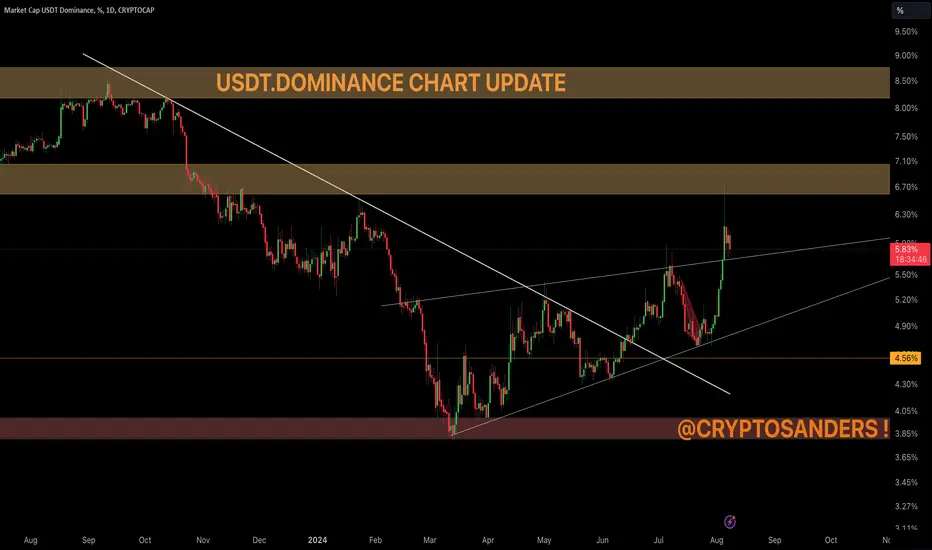
USDT Dominance Chart Update !!USDT Dominance Chart Update
USDT dominance has broken above the descending trendline.
The current level of 5.84% shows a slight pullback after reaching around 6.70%.
Immediate support is around 5.50%.
Long-term support is significantly lower at 4.56%.
The immediate resistance level is at 6.70%, which was recently tested.
Higher resistance is around 8.50%, which has not been seen since late 2022.
If USDT dominance can stay above the 5.50% support level and break the 6.70% resistance, it could target higher levels around 8.50%.
A break below 5.50% could lead to a decline towards long-term support at 4.56%.
Keep an eye on changes in volume to confirm the strength of the move.
Monitor the RSI for potential overbought or oversold conditions to identify reversal points.
USDT dominance is currently in a critical range. Traders should keep an eye out for a break above 6.70% for bullish continuation or a drop below 5.50% for further bearish action. The 5.50% and 4.56% levels are key support areas, while 6.70% and 8.50% are important resistance areas to keep an eye on.
Remember: This is not financial advice. Stay tuned to us for further updates and analysis. Thank you!
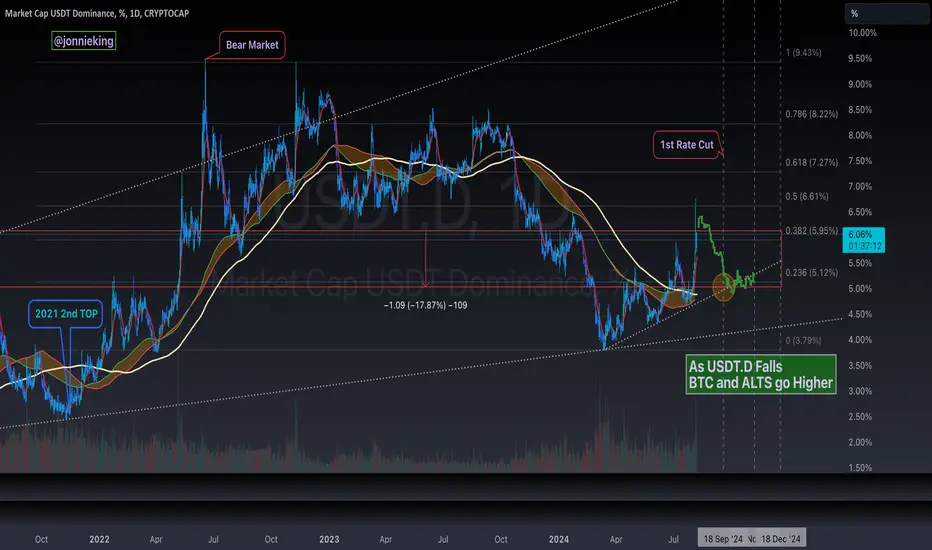
$USDT Dominance On The Rise = More Pain AheadBeen riding this trendline since March.
Well above the 200MA and Bull Market Support Band
Battling the .382 Fib today
I expect it to breakthrough and grab liquidity around the 6.50 region for a bit, then make its way back down to the trendline when rate cuts are announced September 18th.
Will then have to break that trendline to take the next leg in the bull market.
Remember, as CRYPTOCAP:USDT.D Falls CRYPTOCAP:BTC and Alts go higher.
Danger Danger!!!Dominance Tether is ready to grow again, ready to blood the market again. Be careful with your transactions.
Danger Danger !!!Dominance Tether is ready to grow again, ready to blood the market again. Be careful with your transactions.

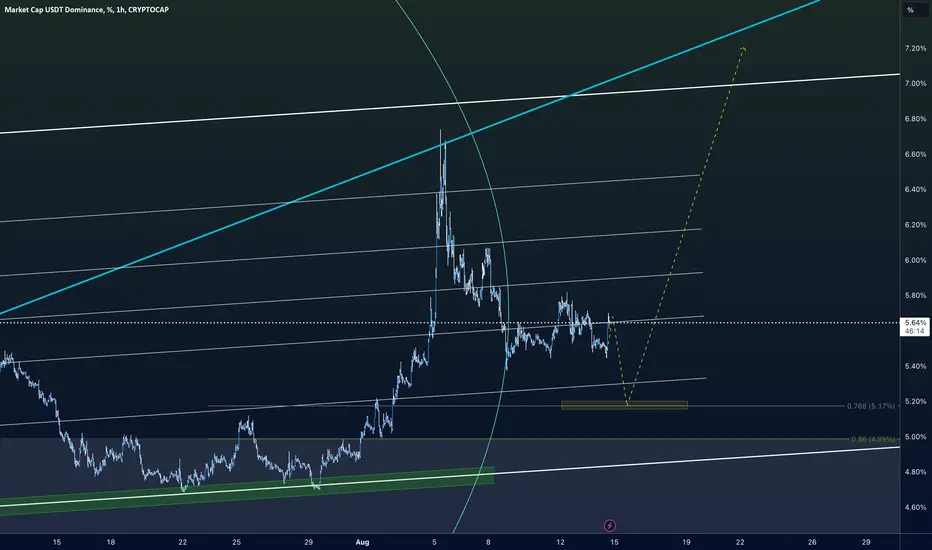
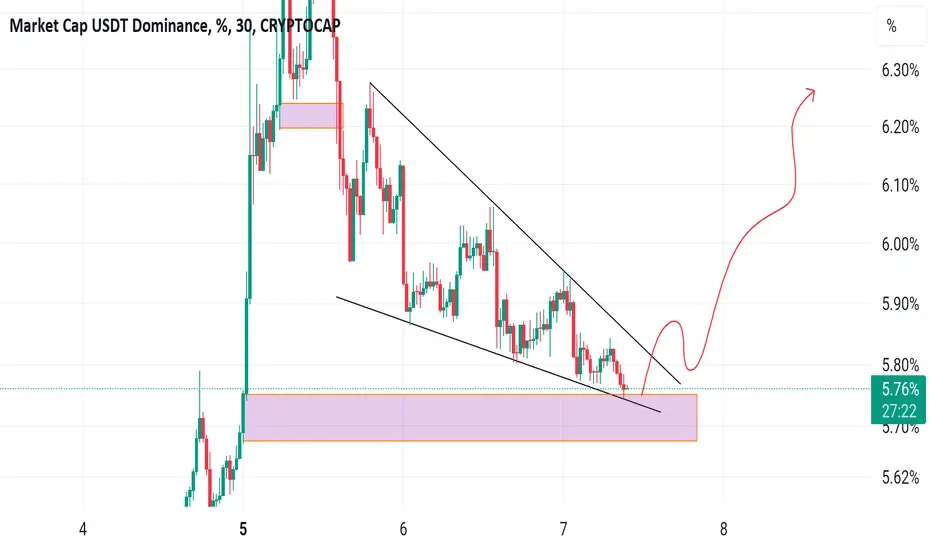
USDT.D bearflag pattern?Hello everyone,
USDT.D is one of the most important charts that indicate the percentage of USDT in every trader's wallet.
Seeing its dominance go down surely indicates whether traders are buying crypto against it or people are swapping USDT for another stablecoin (which typically happens only in a crisis).
The USDT.D chart is now clearly forming a bear flag with a target of around 2%.
Whenever it breaks the lower border, it will give the market a huge pump and start a strong bull season. You should always keep an eye on USDT.D.
That's it!
Have a nice day.

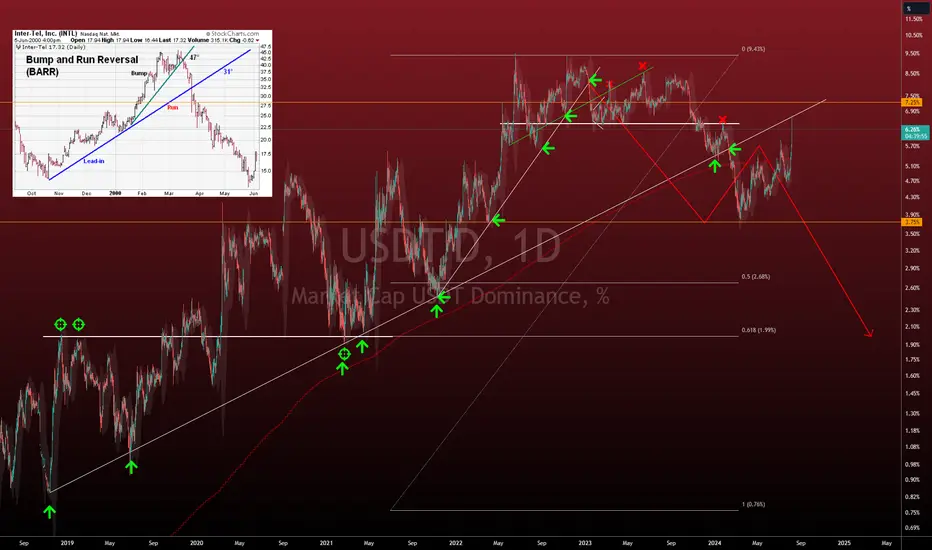
Bump and Run Reversal in USDT Dominance: Part 2Please refer to the USDT Dominance article I wrote over a year ago explaining what would happen (and what has happened so far):
In early 2024, the USDT dominance in the crypto market experienced a significant shift that marked the end of a long-standing trend. This change, driven by a classic "bump and run" reversal pattern, has broken the trend that I have been observing since the initial breakdown I discussed back in January 2023.
The Build-Up: 2022-2023
Looking back to 2022 & 2023, USDT dominance found strong support around the 6.5% mark. This level served as a critical floor, preventing further declines for much of that year and extending into 2023.
However, the breakdown that I anticipated eventually occurred. As USDT dominance dipped below 6.5%, the dominance entered a freefall (boosting crypto prices), eventually finding new support around 5.5% in late 2023. This was a crucial moment, as the 5.5% level had not been tested in such a manner in years, setting the stage for what was to come.
Breaking the Major Trendline: A Turning Point
What made this breakdown particularly notable was that it marked the first time USDT dominance had broken below a major trendline that had been holding firm since late 2018. This trendline had been a key reference point for me, acting as a stronghold for my bullish sentiment. Its breach signaled a significant shift in the market dynamics.
As USDT dominance continued to decline, it reached a low of approximately 3.75%. This dramatic drop indicated a loss of USDT's dominance over the broader cryptocurrency market and boosted the price of many other crypto assets. However, after this steep decline, the market began to correct in a slow, overlapping fashion. This corrective cycle is important moving forward.
By August 5, 2024, USDT dominance had ascended back to 6.77%, where it encountered double resistance. This level aligns closely with the trendline that was broken in early 2024, serving as a critical test for the market. The rejection at this resistance level suggests that we may be witnessing new buying opportunities, as the market tries to establish its next direction.
The Bump and Run Reversal: What It Means
The bump and run reversal pattern observed here is a powerful indicator of potential market reversals. Typically, once the major trendline resistance is broken, the market tends to return to the initial start of the "run." In the case of USDT dominance, this could mean a return to levels below 1%.
While a drop below 1% dominance seems extreme, it's a scenario that cannot be ruled out entirely. However, a more conservative and perhaps more realistic target would be a move to around 2% dominance. Such a shift would represent a significant rebalancing of the cryptocurrency market, potentially opening up new opportunities for altcoins and other digital assets to gain ground.
The Road Ahead: Caution and Optimism
Despite these potential shifts, it's important to remember that the cryptocurrency market remains a highly volatile and risky asset class. While the future of crypto is bright, you should approach it with caution, especially when considering leverage trading. This type of trading can amplify gains, but it can also magnify losses, making it unsuitable for those without significant experience.
Usdt dominance Analysis Usdt dominance - watch my analysis carefully guys , red box it's where we have to buy assets at cheaper price
Soon usdt dominance will reach 7.25-7.95 that's where you have to buy Alts at cheaper price.
Don't go all in Alts now , buy 20% at current price and buy remaining 80% at when usdt dominance reaches 7.25-7.95 for creating your generational wealth..
DYOR.

USDT.D: A big Retest !!USDT Dominance was trading within a well-defined channel. Following a breakdown from this channel, it rapidly dropped to the 3.8% level without undergoing a retest.
The absence of a retest at this critical level hinted at a substantial correction, which is a common occurrence.
However, the excitement and FOMO (US POLITICS) surrounding the BTC bull rally led many to overlook this. The failure to recognize the need for a correction or retest during such market moves can be a costly oversight, liquidating millions of dollars.
Always remember, charts provide a true reflection of market behavior; understanding and interpreting them correctly is essential for making informed trading decisions.

USDT Dominance analysisTether's dominance is near a resistance range that was the origin of a strong drop. In that range, we expect the reaction and the downward trend of the candles.
The targets are marked on the chart
Closing a daily candle above the invalidation level will violate the analysis.
Note that the financial market is risky, so:
Do not enter a position without setting a stop and capital management and confirmation and trigger.
When we reach the first TP, save some profit and try to move the stop continuously in the direction of your profit.
If you have any comments please post them, comments will help us improve our performance
Thanks

Dominance Tether is near a supply rangeFrom where we placed the green arrow on the chart, it looks like a diametric diamond is formed on the chart.
Now it seems that we are in the last wave of this diametric (wave G). It is expected that this wave will end soon and we will see a drop for Dominance Tether.
Closing a daily candle above the invalidatio level will violate the analysis.
invalidation level : 6.47
For risk management, please don't forget stop loss and capital management
Comment if you have any questions
Thank You

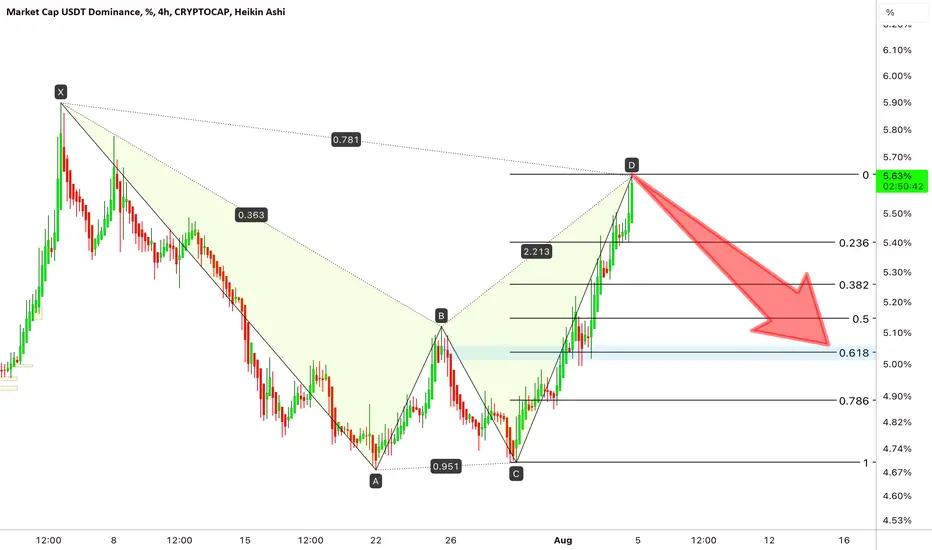
Destiny USDT.DHarmonic bear pattern is completed and there is a possibility of a fall to the 0.618 area, technically a fall is certain.
USDT Dominance Short term analysisHi dear traders, I think USDT Dominance come back to 5% in the short term, the long term will be bullish.

Kingbtc. Usdt.dusdt.d black fashion path can be considered for it, which will cause the market to fall further

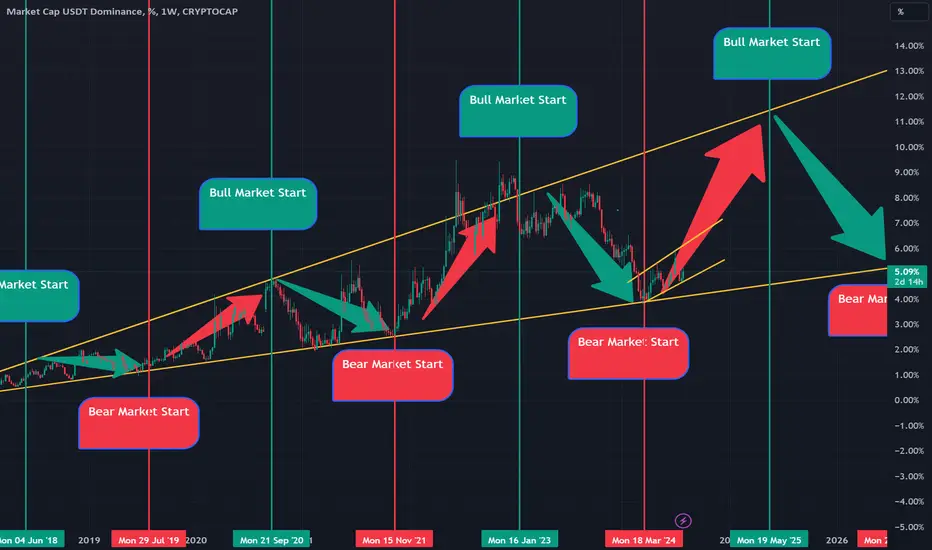
Bear MarketThis chart detect on real time , when bull market and bear market happend on crypto space