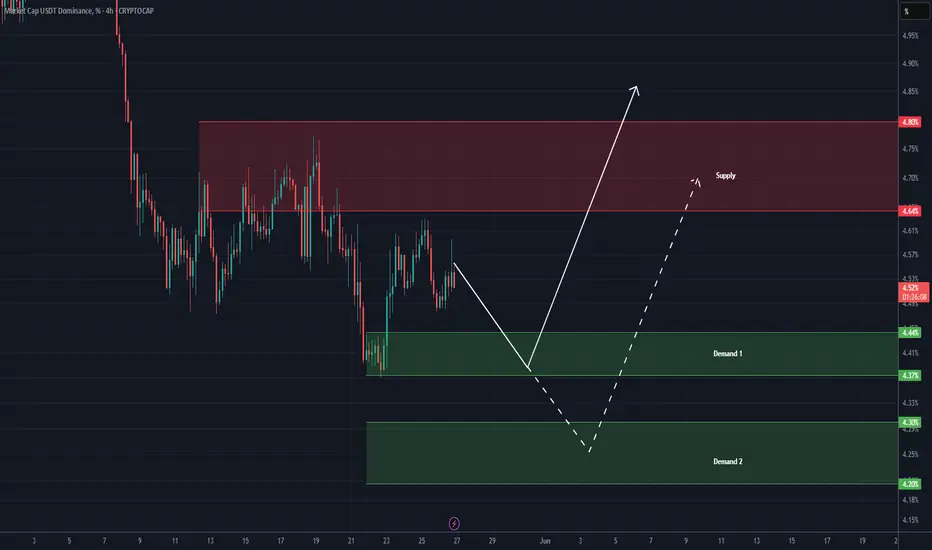
USDT DOMINANCE Update (4H) First of all you should know that "USDT Dominance" is always moving inverse of BTCUSDT .
This index is ready to retrace and bounce upward from either Demand 1 or Demand 2. Be cautious with this index and monitor it closely.
If the price gets rejected toward Demand 2, altcoins may experience some growth before undergoing another correction.
Let’s wait and see what happens.
For risk management, please don't forget stop loss and capital management
Comment if you have any questions
Thank You
USDT.D trade ideas
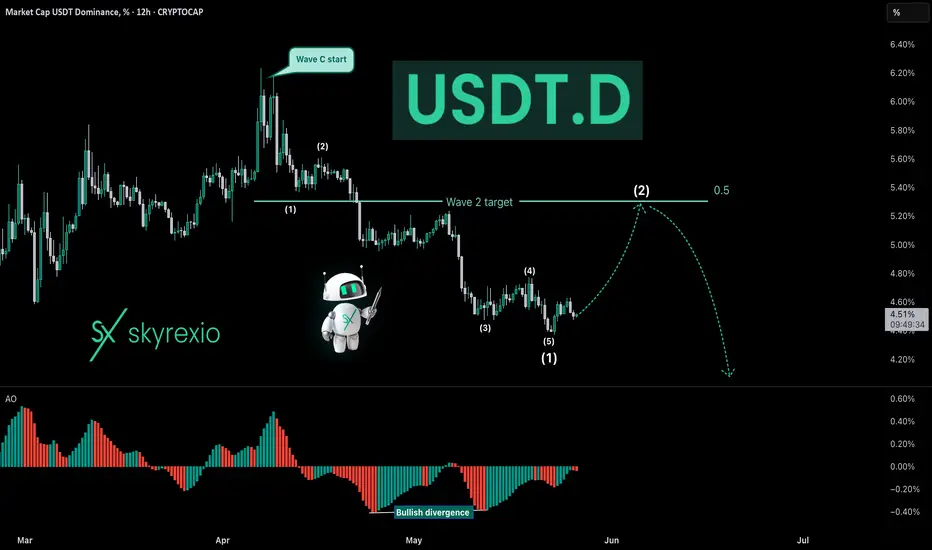
USDT Dominance Tells Us That Shakeout AheadHello, Skyrexians!
Despite most of traders now already do not believe in correction for Bitcoin, CRYPTOCAP:USDT.D is showing the potential warning sign. For sure my global forecast for this chart that Tether dominance will go below 2% is still actual. You can find it here . By the way it's playing out great. But in the short term shakeout is likely.
12 hours time frame Awesome Oscillator shows that wave 1 of global C has been finished. Now it's time for reactive wave 2. The most likely target is 5.3% at 0.5 Fibonacci. Only from there I expect crypto bull run continuation (for BTC) and start (for altcoins).
Best regards,
Ivan Skyrexio
___________________________________________________________
Please, boost this article and subscribe our page if you like analysis!
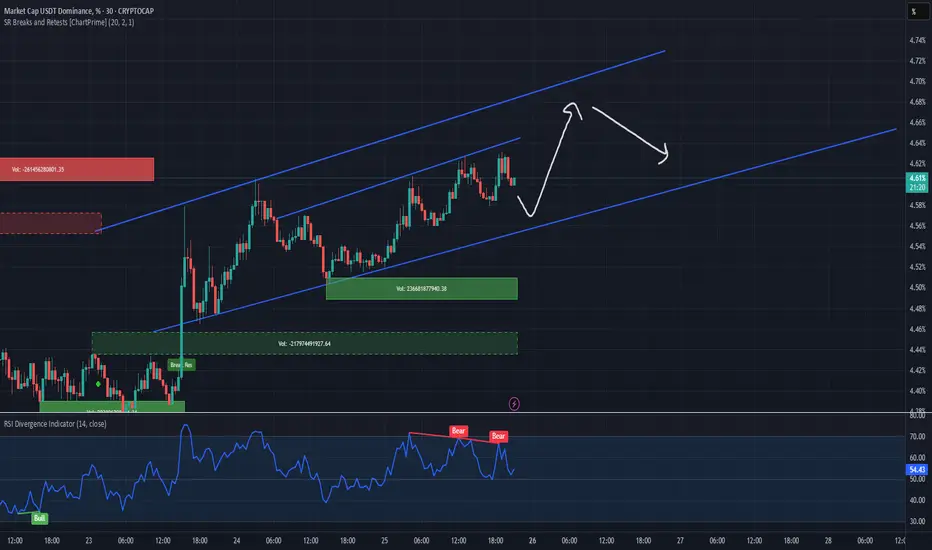
USDT Dominance Looks BullishHello all dear friends.👋
According to the chart that USDT Dominance shows, we have an upward trend up to 4.70%. Of course, we may have a slight downward trend before moving up. Based on this, there is also a downward trend ahead for Bitcoin .
❗Please be careful that this is an analysis and opinion.

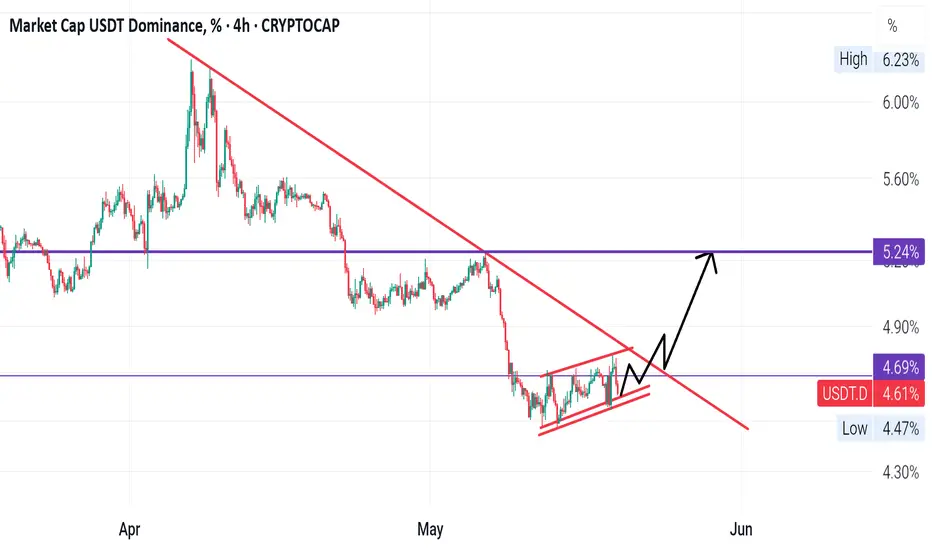
We are going down?Move toward 5.15% and further Bitcoin correction?
Tether Dominance is moving within a descending channel.
As you can see, each bearish wave has shown weaker momentum, pulling away from the channel's lower line — a sign of declining bearish strength.
If the channel trendline breaks, there’s only one major resistance ahead at 4.77%.
If that level is broken, the move could extend up to the 5.15% area —
which could signal more downside pressure on Bitcoin.

#USDT.D (dominence )It is also evident on the chart that
three strong red resistance lines and a strong resistance band are above the last candle.
Breaking all these lines may require Superman power.
Hope it will be pulled down

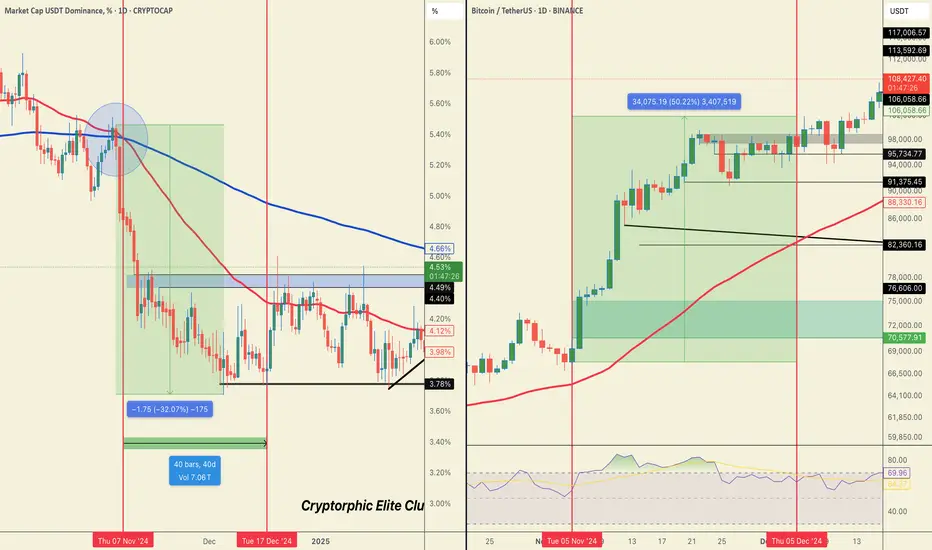
No one is talking about this! Big breakout Incoming! Here'S Why!CRYPTOCAP:USDT dominance is nearing a potential death cross on the daily chart. The last time this happened, we saw nearly 40 days of uninterrupted green across altcoins.
During that period, CRYPTOCAP:BTC rallied from $67,476 to $101,898. Many altcoins surged between 90% and 300%.
We’re now witnessing similar conditions unfold.
If this crossover gets delayed or invalidated (Less likely but entirely possible), altcoins may experience short-term corrections.
But the broader altcoin season remains inevitable.
If this helped you gain perspective, give it a like and repost.
You might want to bookmark it, I’ll update the chart as this plays out.
Don’t let short-term volatility shake you out of generational opportunities.
Be strong there, WAGMI!
#PEACE
Huge crash for Usdt Dominance Ignore the smaller Time frames guys let's see the bigger and better picture of where BTC can top this cycle
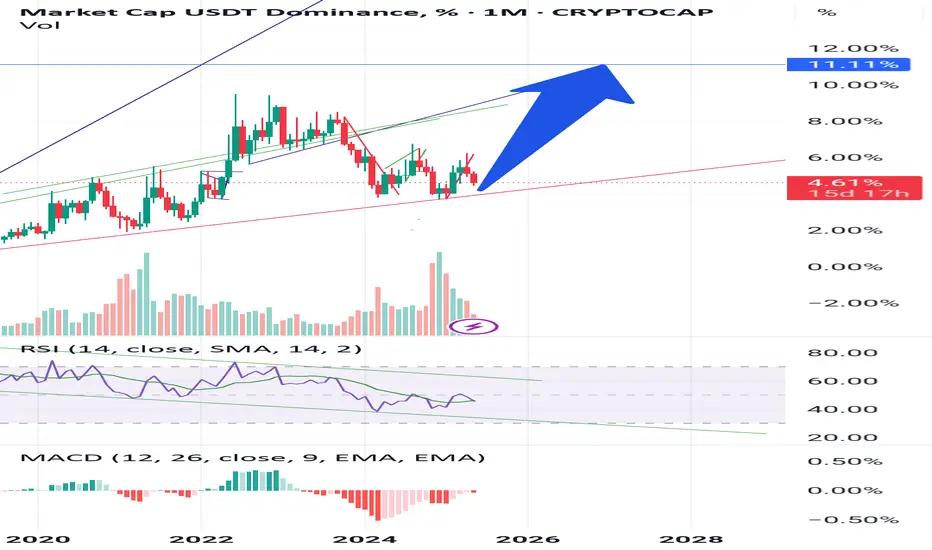
As you can see i have shared the Monthly Chart of USDT Dominance.
It's already broke the trendline support and rising channel on monthly. NOW we are heading to our targets of approx 1.91% and 1.5%. It seems like a joke today but yes it's possible. Ignore the 4h charts and total mess that people are showing. Hold Tight and Enjoy the ride.
Let's see where btc price can go if USDT dominance hits our targets.
If USDT dominance drops to 1.91% we can see Btc at range of 220000$ - 250000$
If USDT dominance drops to 1.51% we can see Btc at range of 250000$ to 350000$
Yes it's possible.
Wait and watch enjoy the ride you can exit anywhere you want it's not a financial advise.
But exiting too early after a long wait will be a regret.
👍 Regards Trader Scorpio ♏

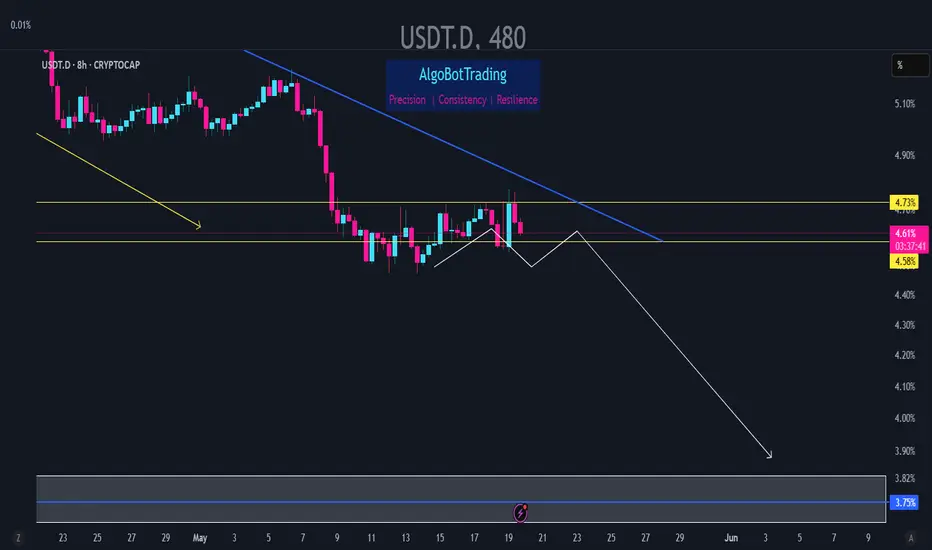
USDT.D (CryptoNation_369)🔮USDT.D Scenario 🔮
✅As long as USDT dominance (USDT.D) stays below 4.55%, the trend is bearish — good for altcoins.
✅Price might go back up slightly (possibly up to around 4.7%) to retest the old support, but this could be a fake move.
✅After that, it will likely continue dropping.
✅First target for the drop is around 3.82% — this is a strong support zone.
✅If USDT.D keeps falling, altcoins are likely to pump harder — because money is moving out of stable coins and into altcoins.

usdt.DHello friends. USDT.D will reach the targets indicated on the chart in the coming days, which will cause the market to grow

USDT.D update - May 19 2025Following the previous analysis on USDT dominance, the index has spent the past week having a slight upward correction and as a result BTC and altcoins has dropped somewhat in the past few days.
Looking at the chart right now, it appears that the index is ready to continue its downward move which means there are going to be good pumps across the market again.
A drop below the 4.47% level shall further confirm the downward move in USDT.D.

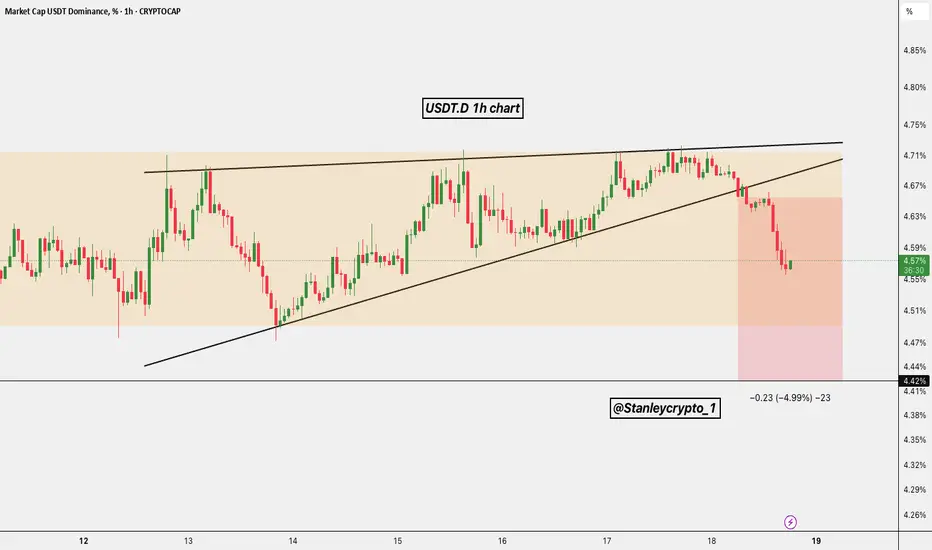
$USDT Dominance Breakdown Alert!CRYPTOCAP:USDT Dominance Breakdown Alert!
#USDT.D 1H chart just broke down from a rising wedge pattern, confirming a bearish reversal!
- Dominance dropped indicates money flowing out of stablecoins
- This often sparks altcoin rallies as capital rotates into
Riskier assets!
If this continues, expect altcoins to pump hard.
Eyes on altseason igniting! 🔥
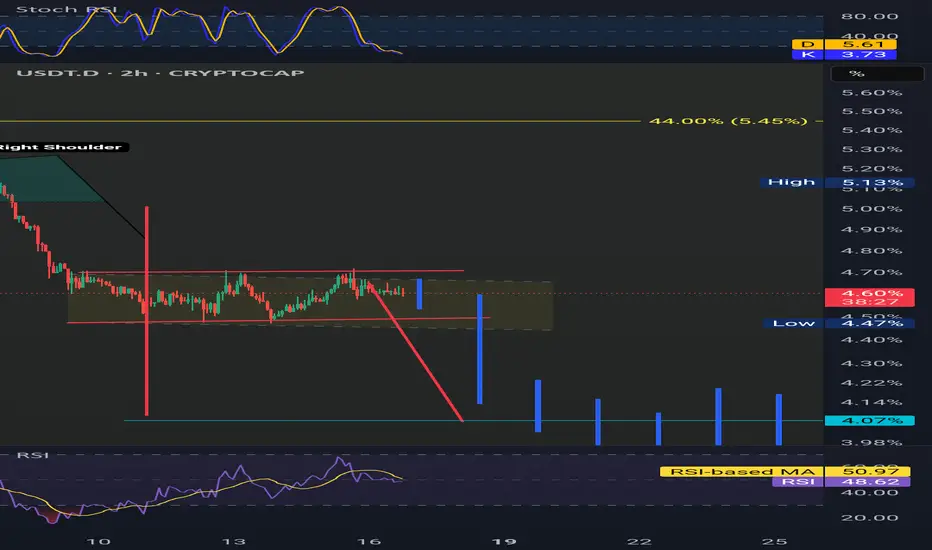
USDT.D Head & Shoulder Pattern: Target 4.00%UDST.D is showing signs that we're about to head into a major upswing in crypto and ignite ETH as well as alt-season.
The H&S target is 4.00% on the dot. Further downside from there likely if we hit our target which I'm guessing will happen in next 1-2 weeks.

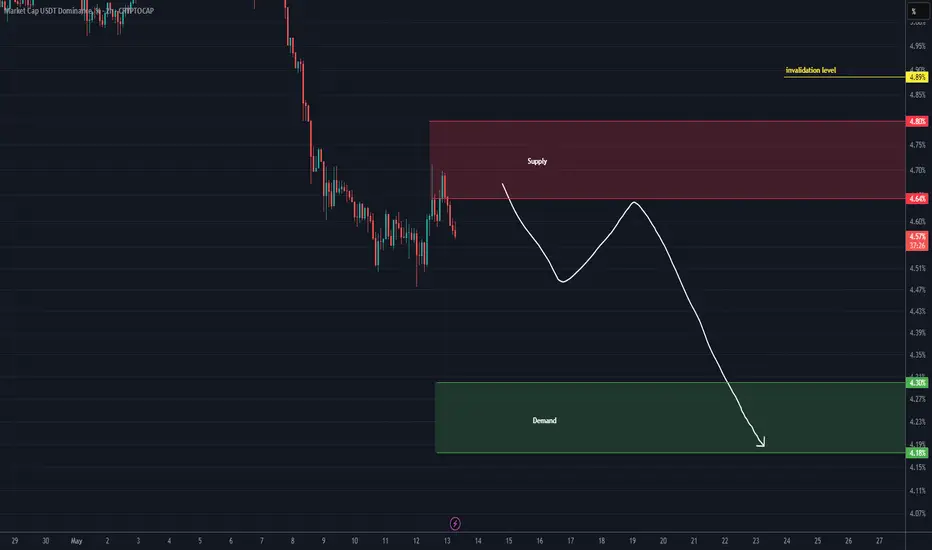
USDT DOMINANCE is bearish (4H)It is currently in a bearish power move, and if a pullback occurs to the red zone, the price could get rejected again toward the green area.
During this drop, altcoins are expected to perform well since Bitcoin dominance is also bearish. When both Bitcoin dominance and Tether dominance are bearish, altcoins tend to deliver the best returns.
Now that Bitcoin has seen significant upward moves, many might think it’s time to consider sell/short positions. But hold on | this is exactly when market makers want to create the illusion that the bullish phase is nearing its end. However, the charts tell a different story, especially for altcoins!
What better time for altcoins to turn bullish than now | when everyone is expecting a rejection and fearing a price drop
A daily candle close above the invalidation level will invalidate this outlook.
For risk management, please don't forget stop loss and capital management
When we reach the first target, save some profit and then change the stop to entry
Comment if you have any questions
Thank You
Finding BTC Top by Stable coin dominaceI think the next leg could be the final push of BTC in this cycle. However, it seems every time the Dominance of stable coins (in this case USDT+USDC) is dropping to certain point in larger timeframe can be relative to find the next top.
I think at least we can come back to 4.92% which it has been touched numerous time in this cycle such as 11/03/2024 and 09/12/2024.
It has the potential to fall a bit further to 4.64% or even 3.87 to 3.67% as well/

Monitoring USDT- Absolutely not a prediction.
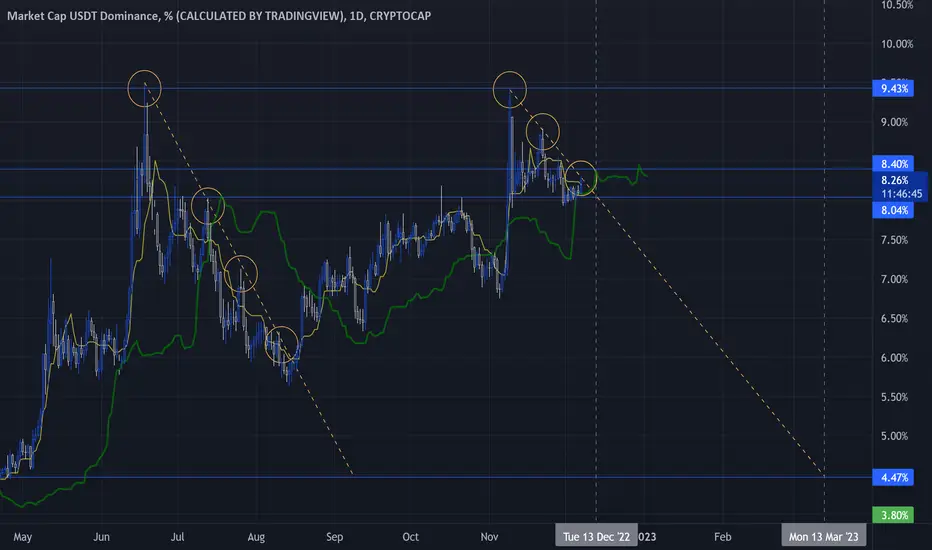
- Just doing this chart to observe 1D (smaller timeframe) on USDT Dominance & Sharing.
- I usually like to use larger TF to reduce the noise on charts ( 1W, 2W, 1M, 3M ).
- USDT.D have to break out 8.4% before 13th December.
- if it does, could mean BTC more downward pressure.
- if it fails, BTC could rally up.
- Patience is the key.
Happy Tr4Ding !
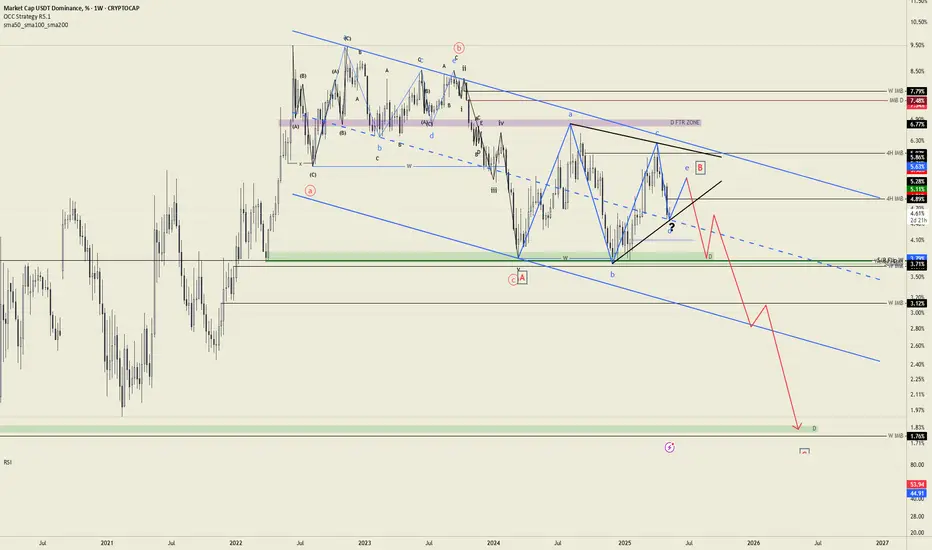
My usdt.d opinionThis is my opinion about USDT.D dominance. I think the rise of altcoins will begin after the last wave E, which will complete the triangle.
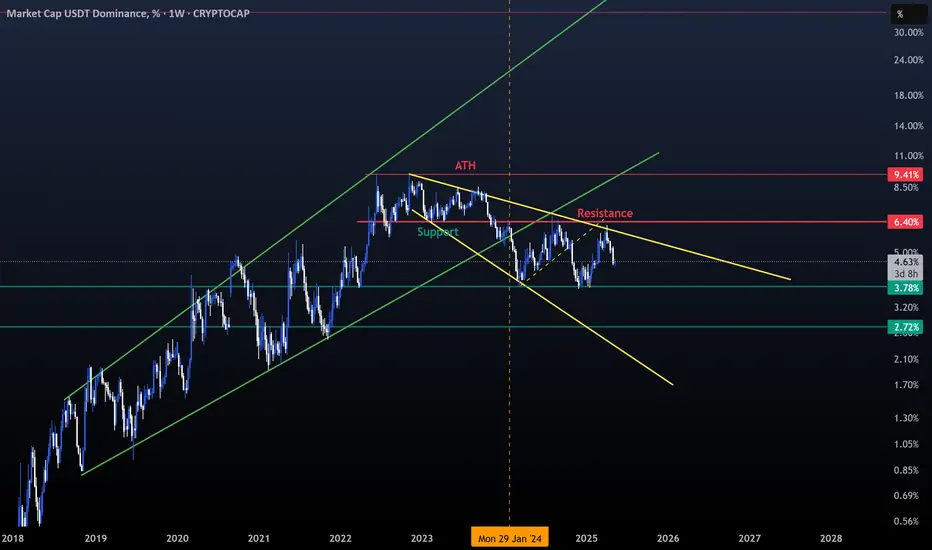
USDT Megaphones- Over the past few years, I've posted numerous charts on USDT and most of them have been spot on. In trading, what goes up must eventually come down. That's just how the market works. i will link my older analysis following this post.
- To predict a BTC pump using USDT dominance (USDT.D) is actually quite simple. When USDT printing slows down or stops, USDT dominance tends to rise, indicating less liquidity flowing into the market and BTC usually drops. But when more USDT is printed, it signals growing demand and inflow of capital. As a result, USDT dominance drops and BTC typically moves up.
- back to the trend :
You can clearly identify two megaphone patterns:
– The first began in 2018 and ended in 2022, following Bitcoin’s bull run to $70K. ( Green ).
– The second started in 2022 and is still unfolding today." ( Yellow ).
- the key point to look closely is 6.40% Dominance.
- From 2022 to 2024 this point acted multiple times as support.
- but from January 2024 ( Orange Vertical dotted Line) it started to act as resistance.
- As I always say, support has a nasty habit of turning into resistance, and once again, that’s exactly what happened here."
- USDT has now entered a bearish megaphone pattern, and I expect it to continue moving lower, if USDT.D broke down 3.80%, 2.70% is coming next.
Based on this, BTC is likely to move higher, the bull run isn’t over, time to stack more sats !
Happy Tr4Ding !
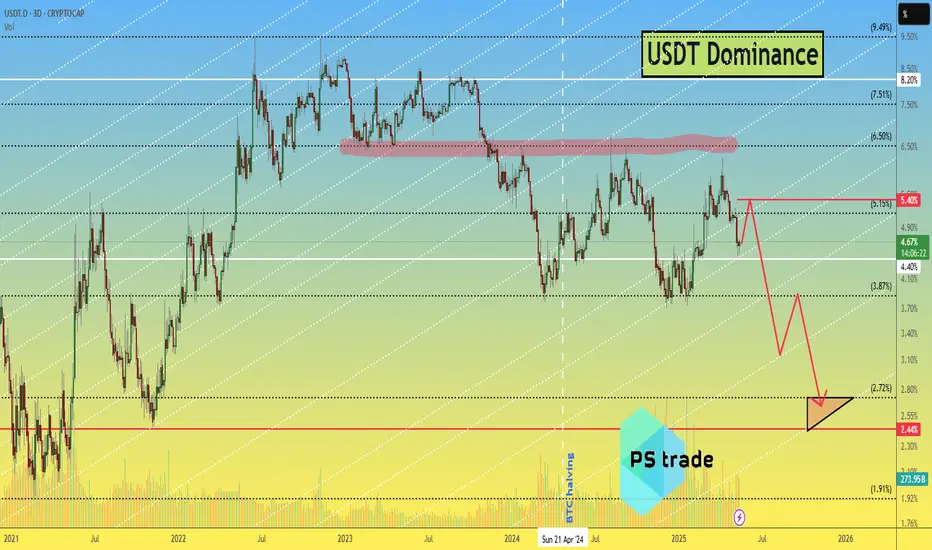
USDT.D Dominance analysis👨💻 Today, we'll talk about the USDT.D Dominance index, as two 3-day candlesticks are forming with shadows from below, which suggests that a rebound upwards is possible.
If USDT Dominance is growing, it means that people are "leaving" CRYPTOCAP:BTC and altcoins for stablecoins, which means that the crypto is being sold = the price is falling.
🔴 The fall in crypto prices can be rapid and severe if BTC.D grows, or it can be moderate in the form of a logical correction if BTC.D also falls along with crypto prices.
🟢 That is, in the next month, a trend will be formed until the end of 2025. And it will be possible to see this in advance by some metrics (if you don't see it, we will tell you - so you need to subscribe and follow the posts!)
I want the capital to finally start flowing into altcoins, at least a "decent of them" part, and not into all the "garbage" that is created in 30 seconds.
💰 Returning to USDT.D - it is necessary that the rebound of this index is weaker, then its future dive will be deep.
👆 5.40% is the maximum critical level for a rebound
👇 In turn, we would like to see a global drop in USDT.D in the range of 2.44-2.72%.
_____________________
Did you like our analysis? Leave a comment, like, and follow to get more