USDT Dominance is finally Breaking down. Usdt dominance is finally topping out and going to start it's new downtrend
And massive bull run in Bitcoin and your altcoins as well like i have discussed with you in my previous ideas you can check them out.
But 3.7% support is now weak
My potential targets for usdt dominance reveal is approx 2.7 and 2.5 range
So plan accordingly don't exit too early and don't try to sell exact top.
Work without emotions and stick to the plan
Sayonara
USDT.D trade ideas

USDT.D UPDATEIf the dominance channel breaks down, the market will rise. We could see 86-89k in Bitcoin

USDT.DThis is the seventh daily candle of this index closing as a doji right on the support trendline. The market is still in decision-making mode. We've explained the details in the pinned post, but there's one more point we'll cover in the next post.

Bears and Bulls playing Cat and MouseCRYPTOCAP:USDT.D CRYPTOCAP:TOTAL
It's been quite choppy to the upside in this area. Price action is printing tight descending channels within a larger ascending channel.
So the bear and bull are playing a game of cat and mouse on a significant demand line and right below the 50 EMA.
The micro descending channel that is printing now within the ascending channel suggests another minor wave up and slightly above is a larger time fame supply/resistance trend line combined with the 0:0.382.
Considering we now have candles printing below the demand line of the trend up, developing an ascending channel, this looks like a cause building event for deeper retracement.
If this was a descending channel/ bullish pattern separation, this would hence continuation to the upside. But that is not the case here.
The lower 0:2.272 ratio band is significant support, paired with the 500 EMA.
When the wave down starts, get ready for some more pumps throughout the market.
- Not Financial Advice-

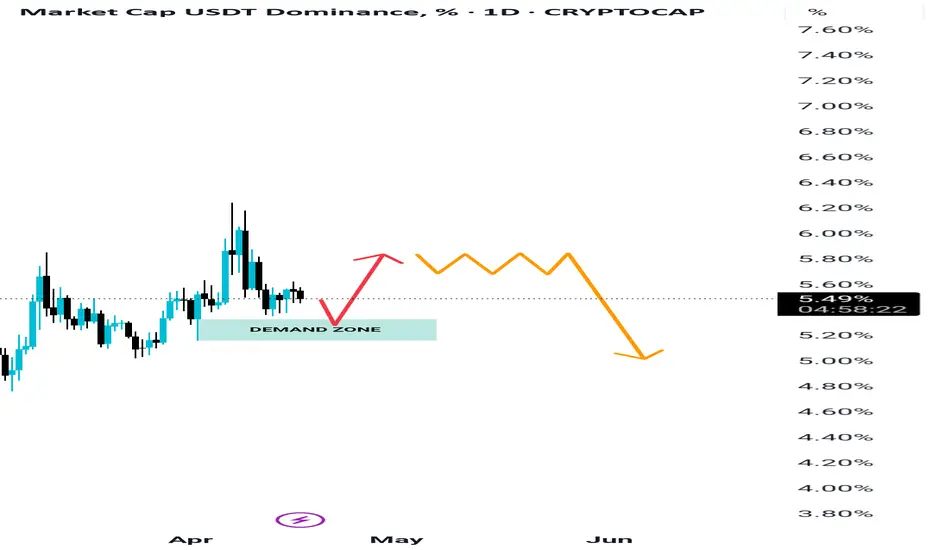
USDT DOMINANCE UPDATE: What to Expect Next? USDT Dominance is currently heading toward a key demand zone between 5.33 and 5.16, which could act as a strong support area. From this zone, we might witness a short-term bounce or upward movement. This could temporarily cause corrections in both Bitcoin and altcoins, so don't be alarmed—this is a healthy part of market behavior.
After a possible slight move upward, USDT dominance may go sideways for a while, showing some consolidation. But here’s the important part: this move is likely the beginning of its next downtrend. And when USDT dominance starts falling, it typically signals the start of an uptrend for Bitcoin and the overall crypto market.
So, stay calm and stay prepared. I'm sharing this so the market doesn’t catch you by surprise. Because you’re following me, I’ll make sure you stay ahead of the moves with timely updates.
Everything will be fine—this is just part of the cycle.
shortHello friends, we have USDT dominance on the weekly timeframe and it is facing a strong weekly block order. It will probably test it once more and then start to decline towards the bottom of the channel.

USDT Dominance Analysis + $BTC priceBased on USDT dominance movements I predicted the CRYPTOCAP:BTC price for 2 years ahead.
This is just a prediction based on technical patterns and not financial advice.

BTC and USDT.D
Both USDT.D and BTC charts on both 4h and daily timeframes, are on the mean value of 50rsi..
Which basically means the charts imo are on the turf of decision.

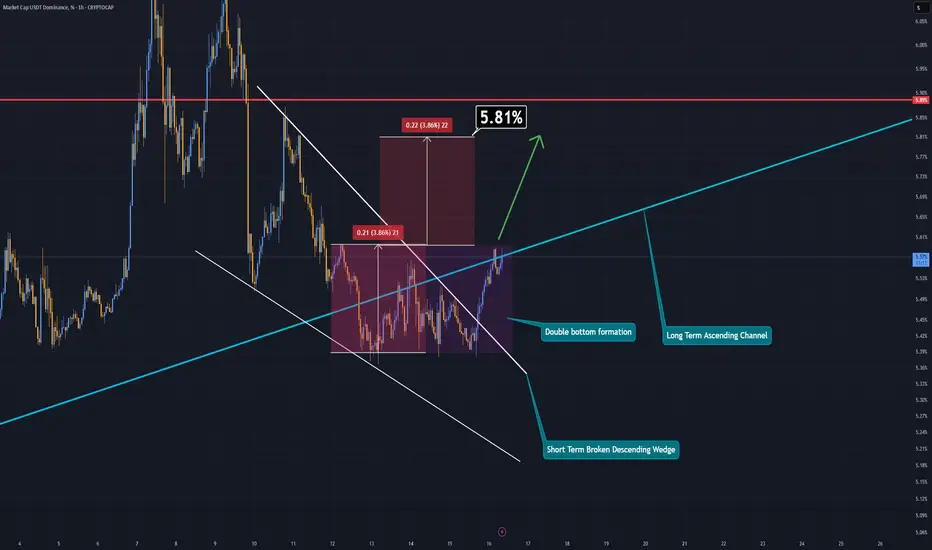
USDT Dominance Update (1H)First, it’s important to remember that USDT Dominance (USDT.D) tends to move inversely with the market. In simple terms:
— If USDT.D rises, the crypto market usually drops.
— If USDT.D falls, the market typically rallies.
On the lower timeframes, USDT.D has broken out of a descending wedge formation, which is generally considered bullish.
Additionally, a double bottom pattern appears to be forming and is on the verge of breaking out to the upside.
Taking all of this into account, USDT.D could potentially rise toward the 5.81% level — suggesting that the broader crypto market may experience a short-term correction.
This outlook also aligns with one of my recent Bitcoin analyses.
Be sure to check my latest Bitcoin breakdown to understand where the market might be headed next.
— Thanks for reading.
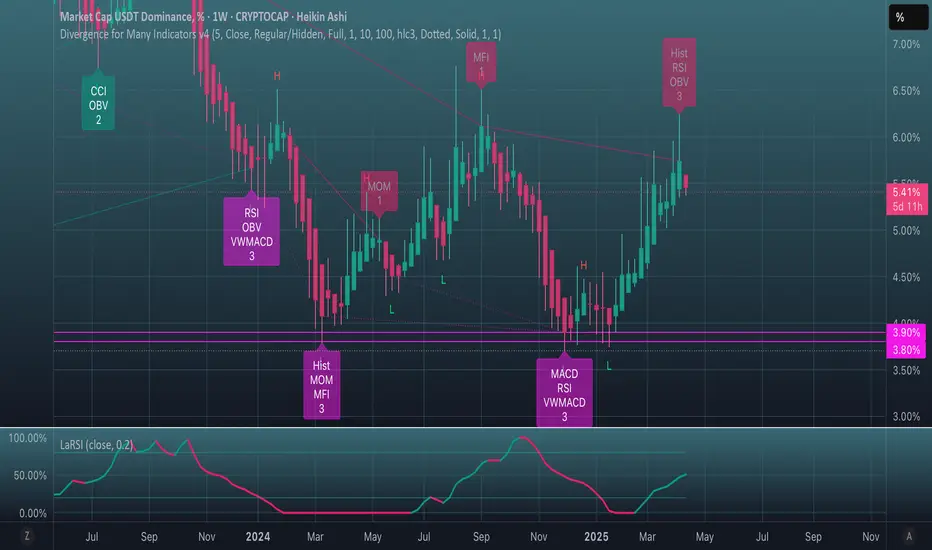
Weekly signal.Also consider the dominance of the USDT.
Last week closed with a confirmed hidden bearish divergence.
The opening of the week brought a red candle.
A positive sign for OTHERS (one of).
USDT.DSecond Point:
The USDT Dominance on the daily timeframe is showing the exact opposite behavior of Bitcoin. It has reached a supportive trendline which, for the past 3 months, has led to a reversal every time the index has touched it — pushing the market one level lower. And now, we're back at that critical zone again.
Will things be different this time?
This current touch appears to be a wave F, and perhaps we could even consider a potential wave G, which would imply one final leg up for USDT Dominance. However, there’s no certainty. There’s also the possibility that the trendline breaks, tether gets deployed, and the market becomes just a little — just a little — more pleasant.
We're literally on the edge right now, and this is where market pumps and dumps tend to occur — right in these key zones.
When will the situation become clear?
We have an important time zone coming up, and it’s likely that within the next couple of days, market makers will show their hand.
What do you think will happen?
Trendline breaks → Market pump
Trendline holds → Market dump ❤️

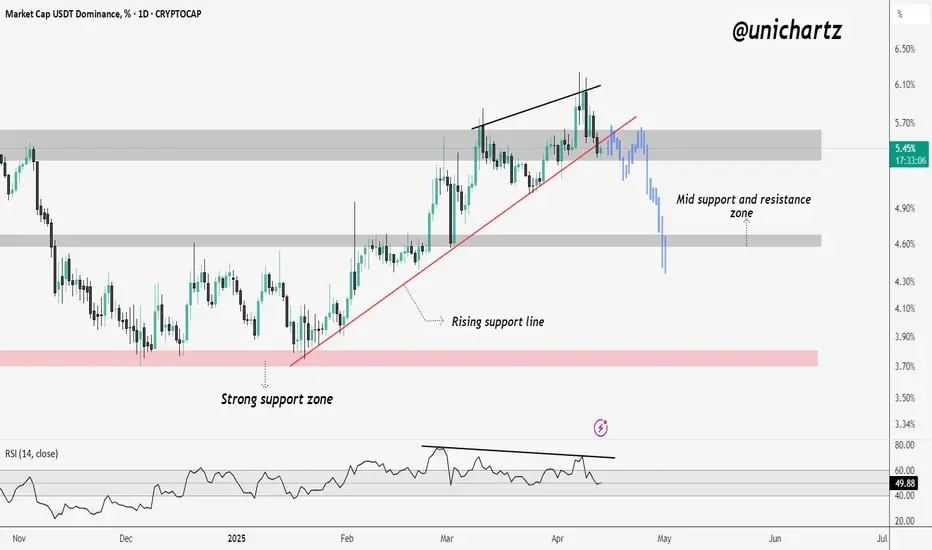
USDT Dominance Drops – Altcoin Surge Incoming?
USDT.D has broken below the rising support line and is currently testing the grey-marked support zone. If this support fails to hold, we could see a sharp decline toward the mid support/resistance zone.
Such a move would likely trigger a strong upside in altcoins as capital rotates out of stablecoins.
Usdt dominanceUsdt at resistance , money will flow back to the market . Trump will make tariff deal with all the World and fed will soon lower interest rates . I think the market has found bottom when all this uncertsiny settles the markets will boom. Dont forget alot of alts found were filed for ETfs soon will get aproved .
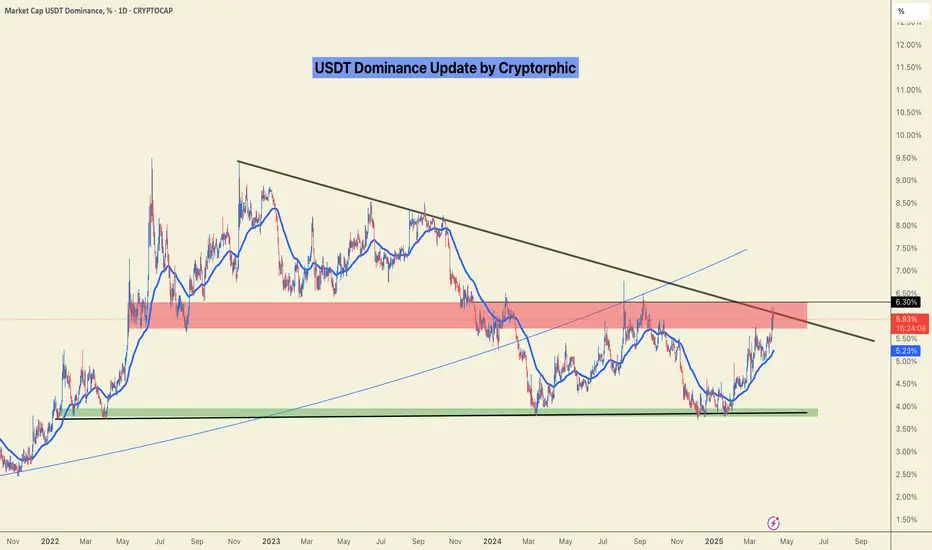
A Quick Look at Tether DominanceTether Dominance has reached a strong support level.
If it breaks below its long-term trendline, that could signal a bullish move for the market.
However, if it holds above the trendline and breaks through its one-hour trendline to the upside, we might see further downside in the market.
Let’s see how it plays out

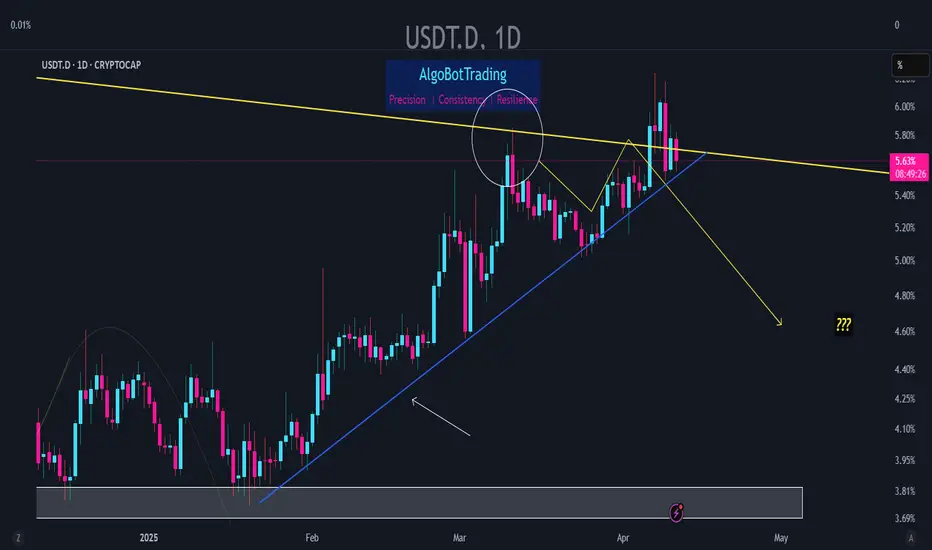
USDT.D update - April 11 2025USDT dominance has beautifully followed last month's analysis so far. Looking at the chart right now it seems the index is going to continue following the predicted path in which it crosses below the indicated blue trendline.
The said crossing shall result in heavy upward moves in BTC and many other altcoins. A daily close below the 5.0% level shall further confirm USDT.D's drop towards lower levels.
USDT.D(based on NEowave)check the long term of usdt dominance then you will understand this.
according to bow tie diametric(from 12H counting) we will see a new bull run and this is the last wave of that.

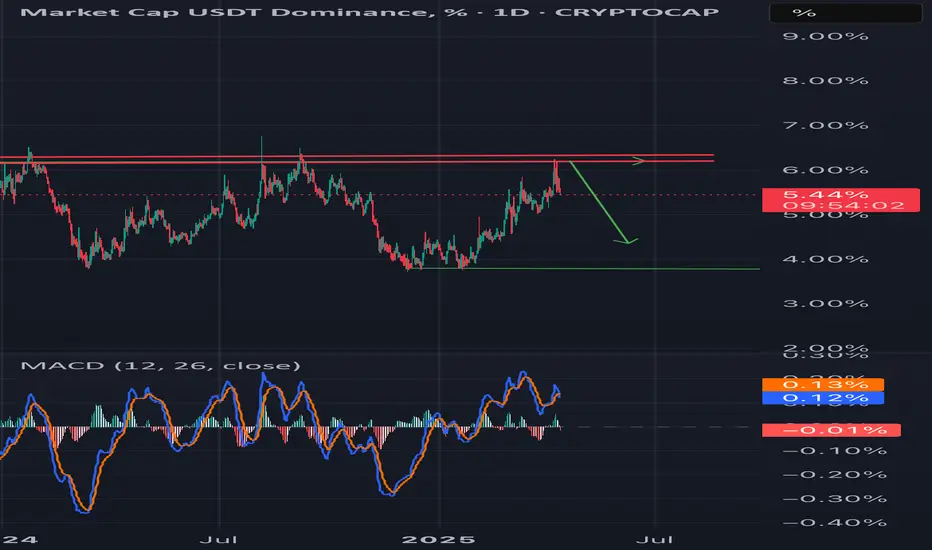
Tariff Pause = Crypto Pump?USDT Dominance is testing strong resistance (5.60%–5.80%) while holding a rising support line. A break below 5.40% could signal a shift to risk-on sentiment, triggering a move into Bitcoin and altcoins.
Trump’s 90-day tariff pause may further boost market confidence, reduce demand for stablecoins, and support crypto inflows. If dominance breaks down, it could spark an altcoin rally. If it holds above 5.80%, caution remains. This is a key turning point.

USDT Dominance at a Make-or-Break Level – Altseason on the LineJoin our community and start your crypto journey today for:
In-depth market analysis
Accurate trade setups
Early access to trending altcoins
Life-changing profit potential
USDT.D is approaching a key resistance zone between 6.5% to 6.9%. This area will likely determine the next major move in the crypto market.
Rejection here could trigger a BTC + altcoin reversal, potentially kickstarting an altseason.
Breakout above 6.9%? Expect continued dominance, which means no altseason anytime soon.
Meanwhile, BTC is already forming monthly lows, adding weight to this pivotal moment.
Watch this zone closely—the market sentiment could shift fast.
Chart it. Trade it. Please don’t ignore it.
USDT.D Resistance levels:
6.5%–6.9%
If you find this analysis helpful, please hit the like button to support my content! Share your thoughts in the comments, and feel free to request any specific chart analysis you’d like to see.
Happy Trading!!

BREAKING: Tether at Decisive point! Rejection means Reversal!$Tether is approaching a key resistance level.
A rejection here could trigger a temporary recovery in the broader market.
This rejection may signal a potential trend reversal if confirmed on higher timeframes.
However, a break above this resistance would likely mean no altseason for the next few months possibly until the end of the year.
If you found this helpful, please hit that like button.
I’ll update this chart and share insights you can use in your trading decisions.
Also, drop your thoughts in the comments I’d love to hear what you think.
Thank you.
#Peace ✌️
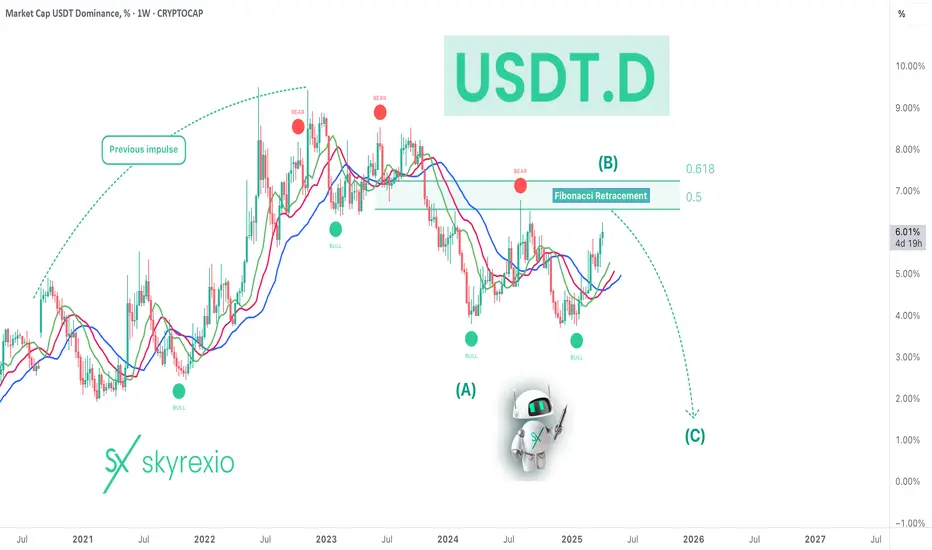
USDT Dominance Confirms Bull Run ContinuationHello, Skyrexians!
Yesterday we shared the analysis when told you that the first confirmation of altcoin season has been received. For sure, Bitcoin dominance still has not confirmed reversal. Today we will show the third important chart. CRYPTOCAP:USDT.D also can help us to predict altseason.
Let's take a look at the weekly chart. Tether dominance has been in the large uptrend wave and now it's in the major correction. Wave A has been finished, wave B has the flat shape and it's also almost done. Fibonacci target area has been almost reached. We want to see the red dot on the Bullish/Bearish Reversal Bar Indicator as a huge confirmation, but it's not obligatory.
Best regards,
Skyrexio Team
___________________________________________________________
Please, boost this article and subscribe our page if you like analysis!
"4-hour chart of USDT dominance shows a forming triangle, indicaWe have a clear triangle formation on the chart, indicating a bullish trend. I’ve also drawn the Elliott wave, and we are currently in the ABC phase. In simple terms, Bitcoin is the key driver here. Tether dominance (USDT) shows a similar pattern, with Bitcoin in a downtrend, and a gap filled with liquidity, likely waiting for withdrawals from institutions."

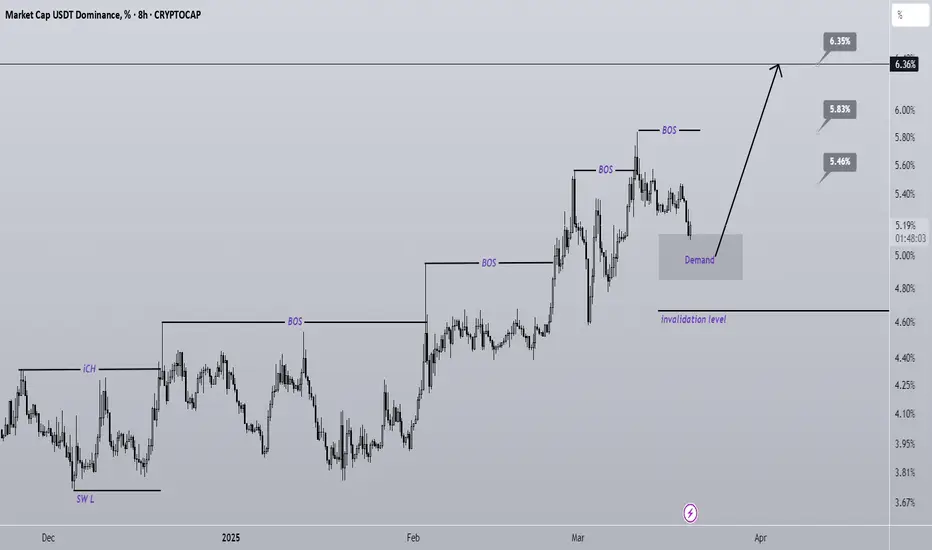
USDT DOMINANCE is bullish (8H)We have a bullish structure on the chart, and in a broader view, there is a double-bottom pattern. The price is currently supported by these formations.
Recently, the price has also reached a demand zone, so a pump is expected soon. Be cautious with buy/long positions.
A daily candle closing below the invalidation level will invalidate this outlook.
Do not enter the position without capital management and stop setting
Comment if you have any questions
thank you
crypto downtrend exhaustion indicatorsA couple facts:
1) usdt.d is above 5.60% for ~two days. This is a major fact. We have an early bull market end confirmation, or at least the end of an impulse structure of intermediate degree. There is a probability that the structure of the current bull market will be either extended or will end with the final diagonal.
2) usdt.d below 5.60% is confirmation of current dump exhaustion.
3) Crossing down one of the trend lines at BTC dominance chart will mean start of alt season. The target for the mini alt season is ~53% at BTC.D;
4) The terminal target for upcoming Dogecoin rally is range between 0.5 - 1.37 USD. Beware pullback, i look at whole crypto market structure and anticipate one.
