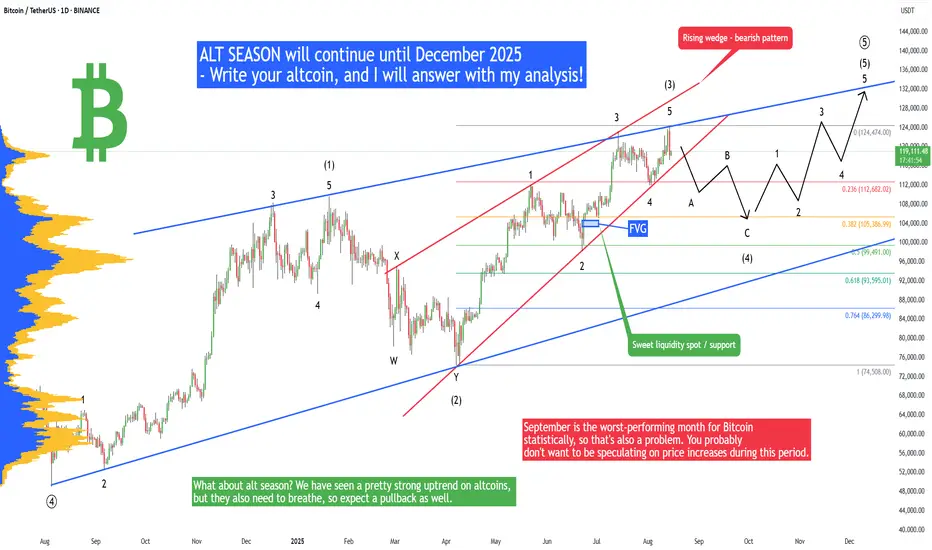
Bitcoin - Huge drop will continue! Then a new ATH (buy here)Bitcoin and mainly altcoins have been pumping in the recent weeks, so the important question is - will this trend continue, or is it over? My Elliott Wave analysis on Bitcoin suggests that we should see a correction to 105,000 USDT before another push to the upside. Why? I see a completed Impulse wa
Related coins
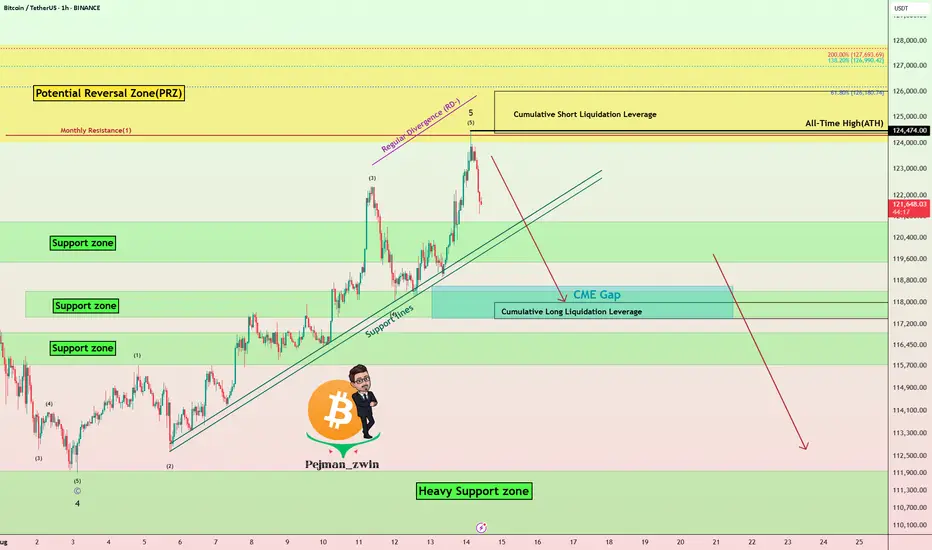
Bitcoin Hits New ATH – Is This the Final Pump Before a Crash?Bitcoin ( BINANCE:BTCUSDT ) reacted well to the Potential Reversal Zone(PRZ) that I told you about in the previous idea and started to decline, but Bitcoin managed to create a new All-Time High(ATH=$124,474) in this rally.
Do you think Bitcoin can create a new All-Time High(ATH) again in the
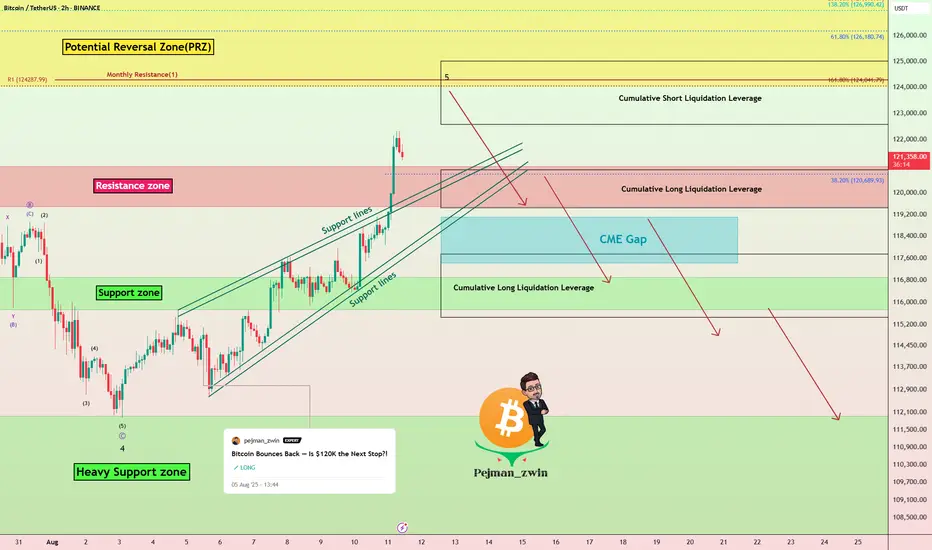
Bitcoin Near $125K Resistance — Is the Rally Over?Bitcoin ( BINANCE:BTCUSDT ) increased to $120,000 after breaking resistances , as I expected in my previous idea .
Bitcoin has already managed to break the Resistance zone($121,000-$119,000) and is moving near the Potential Reversal Zone(PRZ) .
According to Elliott Wave theory , Bitcoin
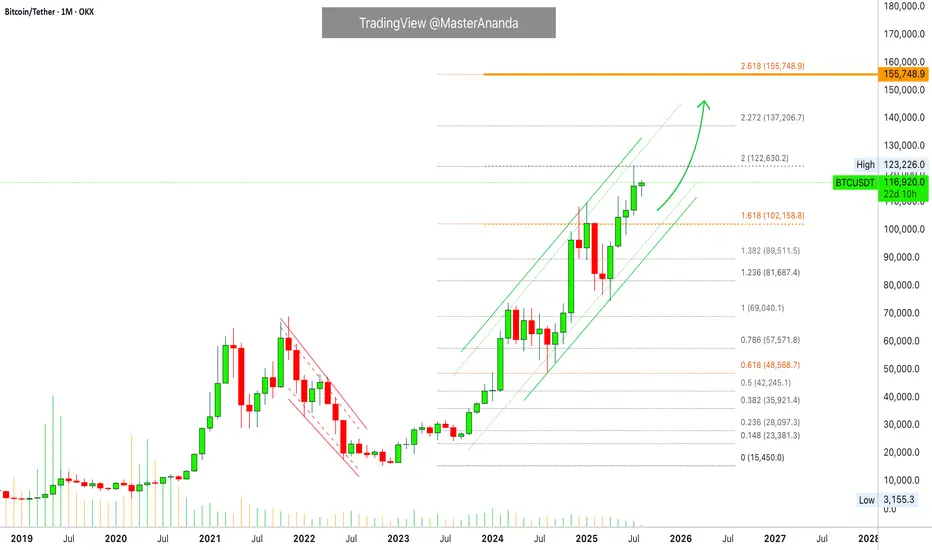
Bitcoin Monthly Update + Top Altcoins Choice, Your PickThis is a monthly Bitcoin chart and is really interesting, it supports without a shadow of doubt a strong continuation and bullish bias.
First, the month started red but is now green. This is always a strong signal when the action starts bad but recovers quickly during the month just to end up good
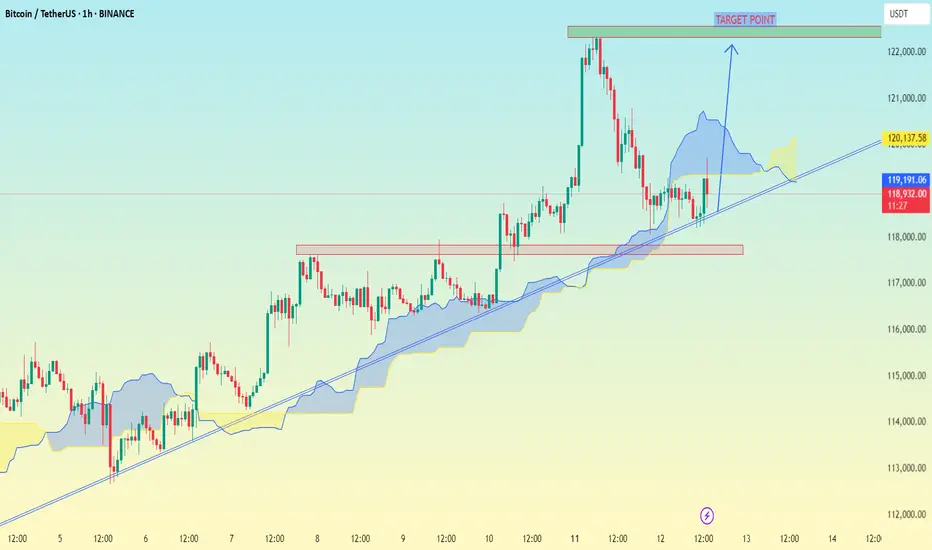
BTC/USD 1h chart Pateern.From this updated chart, "TARGET POINT" label more clearly.
The horizontal green box you marked is roughly between $122,000 and $123,000 (though this seems like a different scale—possibly a derivative or index, not direct BTC price in USD).
The price is breaking above the descending trendline and h
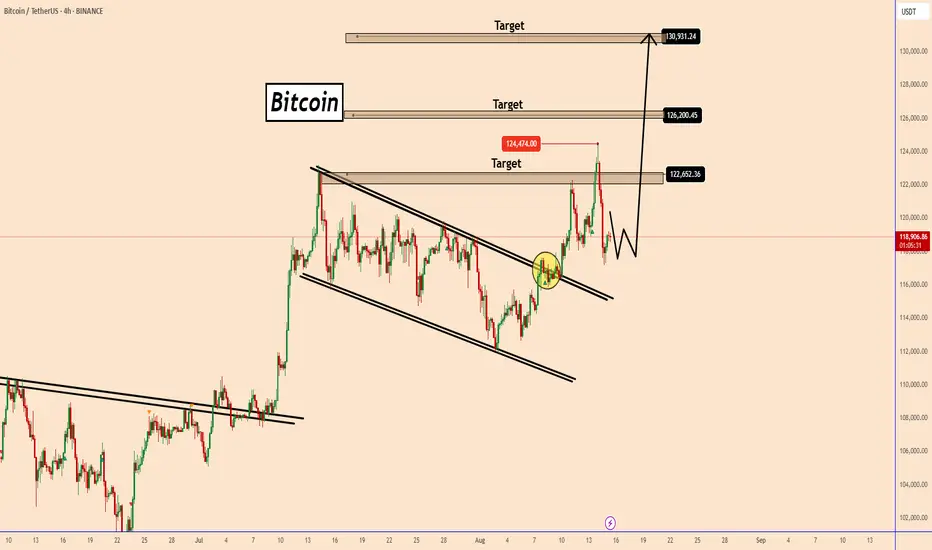
BTC: Uptrend remains strong despite a slight sell-offBTC: Uptrend remains strong despite a slight sell-off
From our previous analysis, BTC rose beyond our first target and turned back down.
Once again BTC proved to be the market favorite, reaching a new all-time high near 124500.
So far we can see a sell-off that could be a profit from the unkno
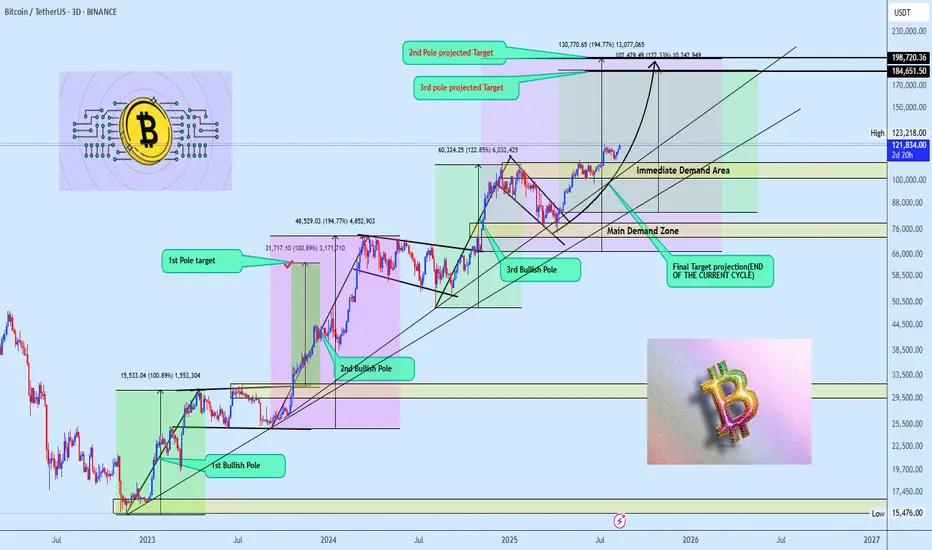
Bitcoin’s Triple Bullish Pole Sequence Next Stop $184K+? Bitcoin’s long-term bull run is unstoppable, powered by a sequence of bullish flag and pole formations. The first pole delivered $63K. The second is still in play, aiming at $198K. The third, born after a breakout above its own flag and the all time high, now eyes $184K with price cruising above $12
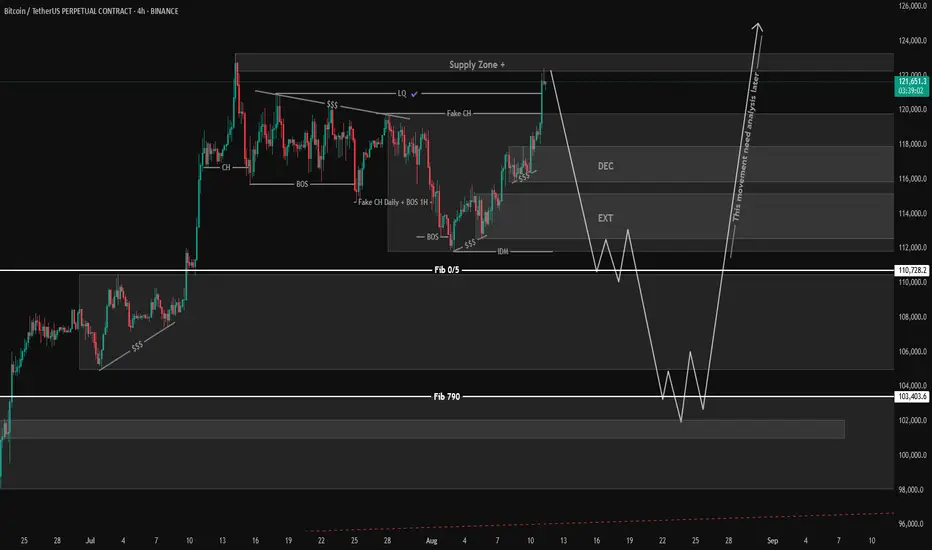
#BTC #BTCUSD #BTCUSDT #BITCOIN #Analysis #Eddy#BTC #BTCUSD #BTCUSDT #BITCOIN #Analysis #Eddy
I have identified the important supply and demand zones of the higher timeframe for you.
This analysis is based on a combination of different styles, including the volume style with the ict style.
Based on your strategy and style, get the necessary
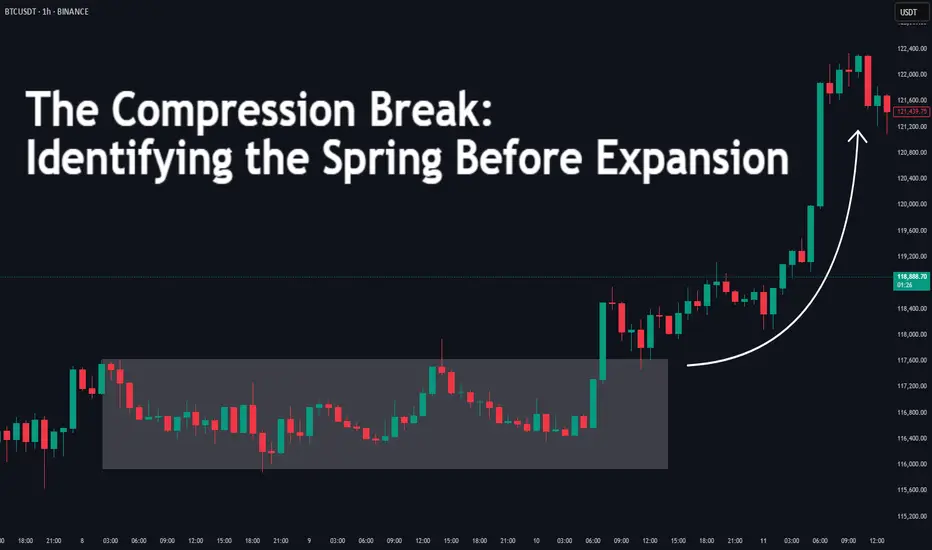
The Compression Break: Identifying the Spring Before ExpansionDifficulty: 🐳🐳🐳🐋 (Intermediate)
This article is for traders who want to recognize and trade explosive moves that form after periods of tight price compression. Perfect for those familiar with structure, volume, and volatility concepts.
🔵 INTRODUCTION
Price doesn’t move in a straight line — it
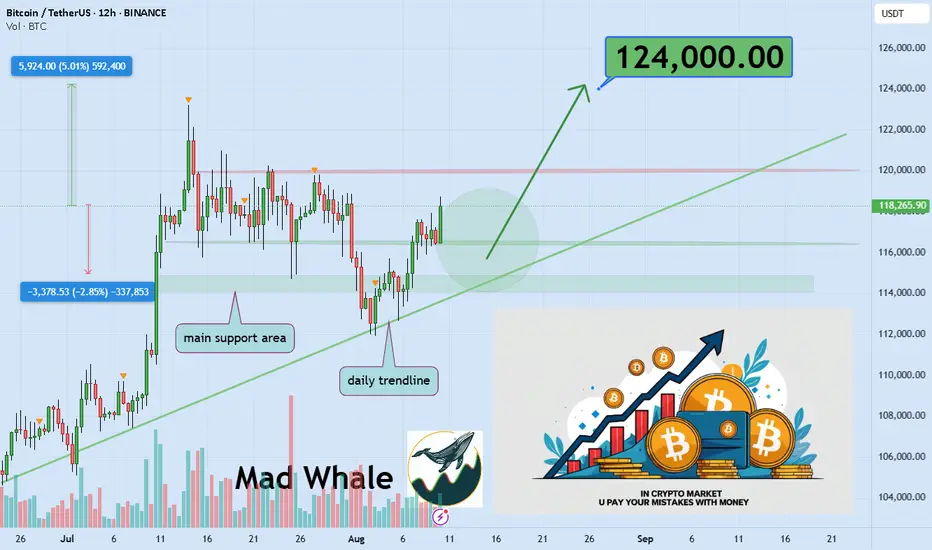
Mistakes Cost Real Money, In trading world In the crypto market, a mistake is not just a note on paper, it’s money leaving your pocket.
Sometimes you need to lose money to feel the real lesson.
If you learn from it, that loss can make you a better trader.
Hello✌️
Spend 2 minutes ⏰ reading this educational material.
🎯 Analytical Insight
See all ideas
Summarizing what the indicators are suggesting.
Oscillators
Neutral
SellBuy
Strong sellStrong buy
Strong sellSellNeutralBuyStrong buy
Oscillators
Neutral
SellBuy
Strong sellStrong buy
Strong sellSellNeutralBuyStrong buy
Summary
Neutral
SellBuy
Strong sellStrong buy
Strong sellSellNeutralBuyStrong buy
Summary
Neutral
SellBuy
Strong sellStrong buy
Strong sellSellNeutralBuyStrong buy
Summary
Neutral
SellBuy
Strong sellStrong buy
Strong sellSellNeutralBuyStrong buy
Moving Averages
Neutral
SellBuy
Strong sellStrong buy
Strong sellSellNeutralBuyStrong buy
Moving Averages
Neutral
SellBuy
Strong sellStrong buy
Strong sellSellNeutralBuyStrong buy
Displays a symbol's price movements over previous years to identify recurring trends.