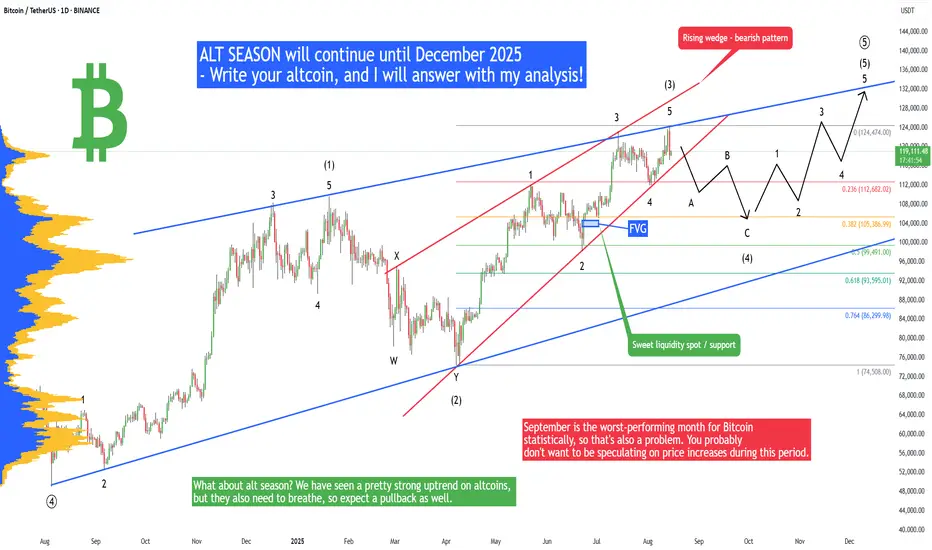
Bitcoin - Huge drop will continue! Then a new ATH (buy here)Bitcoin and mainly altcoins have been pumping in the recent weeks, so the important question is - will this trend continue, or is it over? My Elliott Wave analysis on Bitcoin suggests that we should see a correction to 105,000 USDT before another push to the upside. Why? I see a completed Impulse wave 12345 inside the rising wedge pattern, so this is a pretty bearish combo, to be honest. What's more, September is the worst-performing month for Bitcoin statistically, so that's also a problem. You probably don't want to be speculating on price increases during this period. I recommend buying in October and riding the bullish cycle until December 2025.
Where should we buy BTC? When we take the Fibonacci retracement tool on the whole 12345 impulse wave, we have 105,386 - a strong Fibonacci 0.382 support. In confluence with the previous price action, there is a FVG (Fair Value GAP) between 103,399 and 104,622 on the daily candles. That's a pretty high-probability setup for buying BTC here, so thank me later!
What about alt season? We have seen a pretty strong uptrend on altcoins, but they also need to breathe, so expect a pullback as well. Of course, some altcoins will start pumping pretty much because we are in the alt season, but let's say the major altcoins in the TOP20.
Write a comment with your altcoin + hit the like button, and I will make an analysis for you in response. Trading is not hard if you have a good coach! This is not a trade setup, as there is no stop-loss or profit target. I share my trades privately. Thank you, and I wish you successful trades!
USDTBTC trade ideas
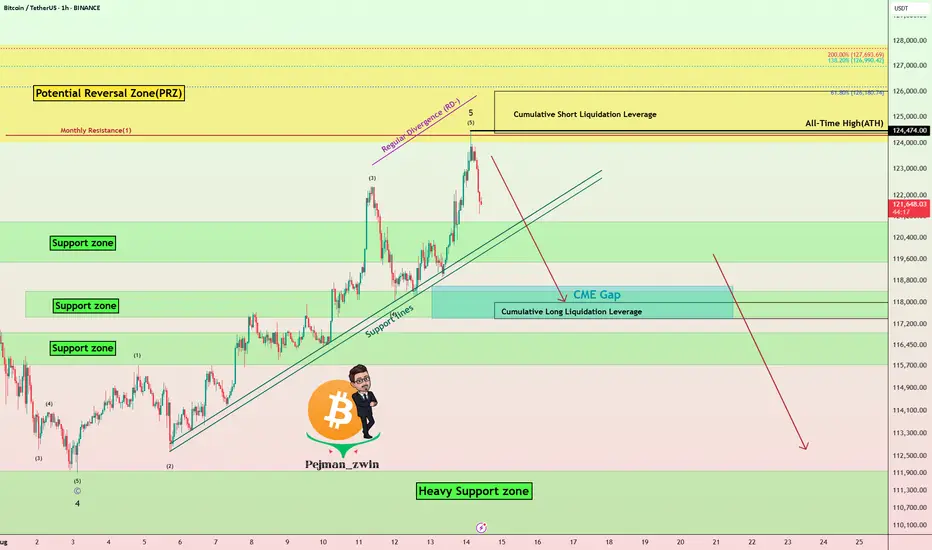
Bitcoin Hits New ATH – Is This the Final Pump Before a Crash?Bitcoin ( BINANCE:BTCUSDT ) reacted well to the Potential Reversal Zone(PRZ) that I told you about in the previous idea and started to decline, but Bitcoin managed to create a new All-Time High(ATH=$124,474) in this rally.
Do you think Bitcoin can create a new All-Time High(ATH) again in the coming hours or should we wait for a main correction?
In terms of Elliott Wave theory , Bitcoin appears to have completed the main wave 5 in the Potential Reversal Zone(PRZ) , and we should expect corrective waves .
Also, we can see the Regular Divergence(RD-) between Consecutive Peaks .
Looking at the USDT.D% ( CRYPTOCAP:USDT.D ) chart, it also seems that with the breaking of the upper line of the descending channel, we can expect an increase in USDT.D% , which could cause a decrease in the price of Bitcoin .
I expect Bitcoin to at least move towards filling the CME Gap($118,600-$117,425) AFTER breaking the Support lines .
Cumulative Short Liquidation Leverage: $126,000-$124,367
Cumulative Long Liquidation Leverage: $118,000-$117,400
Note: Stop Loss(SL): $126,123
Please respect each other's ideas and express them politely if you agree or disagree.
Bitcoin Analyze (BTCUSDT), 1-hour time frame.
Be sure to follow the updated ideas.
Do not forget to put a Stop loss for your positions (For every position you want to open).
Please follow your strategy and updates; this is just my Idea, and I will gladly see your ideas in this post.
Please do not forget the ✅' like '✅ button 🙏😊 & Share it with your friends; thanks, and Trade safe.
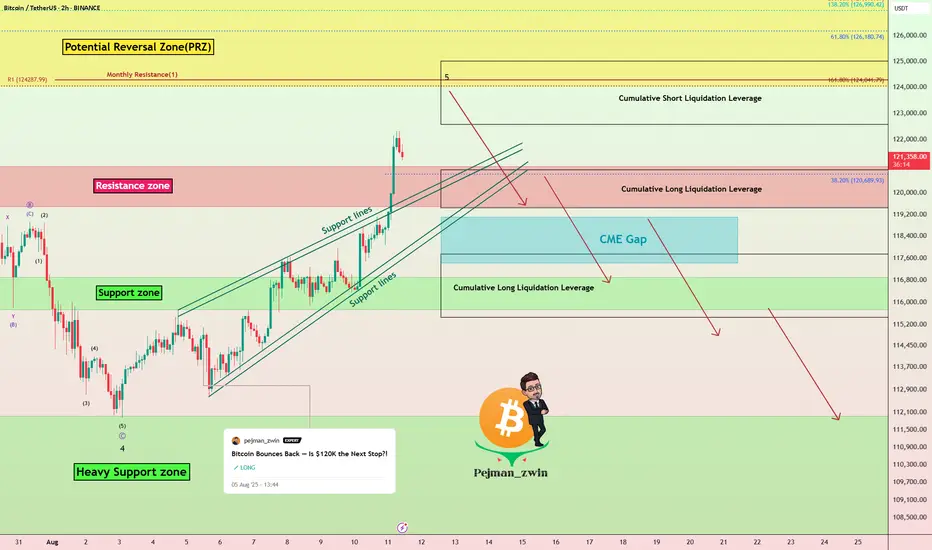
Bitcoin Near $125K Resistance — Is the Rally Over?Bitcoin ( BINANCE:BTCUSDT ) increased to $120,000 after breaking resistances , as I expected in my previous idea .
Bitcoin has already managed to break the Resistance zone($121,000-$119,000) and is moving near the Potential Reversal Zone(PRZ) .
According to Elliott Wave theory , Bitcoin is completing the 5th major impulse wave . In my opinion, this is the last bullish wave of Bitcoin, and after that we should wait for the main correction of Bitcoin . Do you agree with me that it is time to run and take profit!?
To get a better view of the main waves , I suggest you look at the idea below .
Also, since Bitcoin is correlated with the S&P500 Index ( SP:SPX ) and since I also foresee the possibility of a correction in the S&P500 Index, it is also possible to expect a decrease in the price of Bitcoin based on the S&P500 Index analysis .
I expect Bitcoin to start declining after entering the Cumulative Short Liquidation Leverage($125,000-$122,580) and Potential Reversal Zone(PRZ) and at least fill the CME Gap($119,100-$117,425) .
Note: There are heavy sell orders around $125,000.
Cumulative Long Liquidation Leverage: $120,866-$119,442
Cumulative Long Liquidation Leverage: $117,743-$115,452
What is your opinion on Bitcoin and its trend? Can it see $130,000, or will a main correction begin?
Please respect each other's ideas and express them politely if you agree or disagree.
Bitcoin Analyze (BTCUSDT), 2-hour time frame.
Be sure to follow the updated ideas.
Do not forget to put a Stop loss for your positions (For every position you want to open).
Please follow your strategy and updates; this is just my Idea, and I will gladly see your ideas in this post.
Please do not forget the ✅' like '✅ button 🙏😊 & Share it with your friends; thanks, and Trade safe.
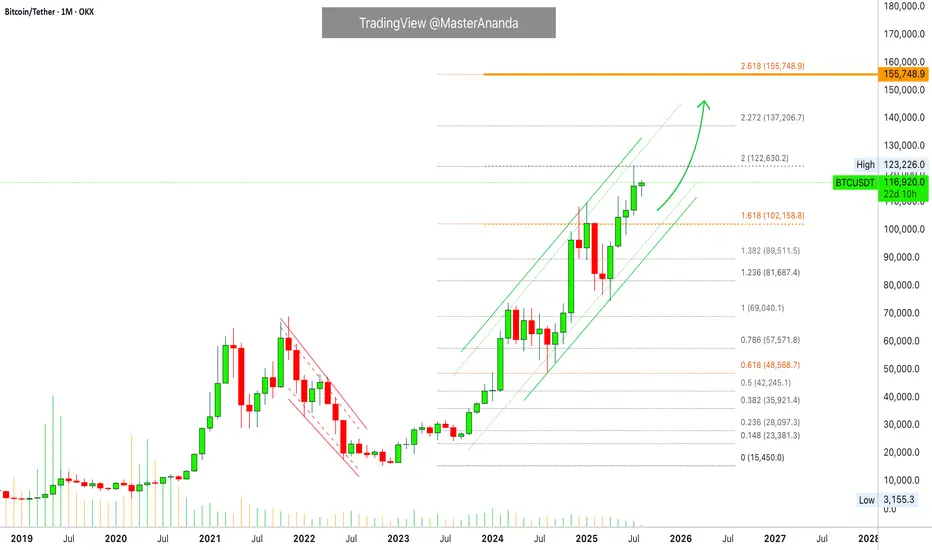
Bitcoin Monthly Update + Top Altcoins Choice, Your PickThis is a monthly Bitcoin chart and is really interesting, it supports without a shadow of doubt a strong continuation and bullish bias.
First, the month started red but is now green. This is always a strong signal when the action starts bad but recovers quickly during the month just to end up good. Starts red to end up closing green.
Bitcoin also closed four consecutive months green. This one will be the fifth month. Since the bears already gave everything trying to push prices lower and failed, we know higher prices are guaranteed next.
We also know this because Ethereum just hit its highest price since December 2021, near the top of the last bull market. Now we have Bitcoin, XRP and Ethereum, the top three Cryptos and the biggest projects, moving forward and doing great.
It is only natural. It is the logical sequence, the smaller pairs/projects will do the exact same.
Just as XRP gained in bullish momentum and hit a new all-time high, to follow Bitcoin, Ether did the same. Then we have Solana and Cardano, Dogecoin, Toncoin, Polkadot, Shiba Inu, Avalanche, Notcoin, Chainlink, Bitcoin Cash, Uniswap and the rest.
They are preparing to grow now and are bullish now. Ready to grow and strong.
No more retraces, no more corrections; the 2025 bull market wave & bull run is getting close.
The next immediate target is $137,206. Notice how the $122,630 target on this chart was hit perfectly. So these numbers are good and work long-term.
» After $137,206, Bitcoin is set to hit $155,000.
(Leave a comment with your Top Altcoins Choice, I will do an analysis for you!)
Thank you for reading.
Namaste.
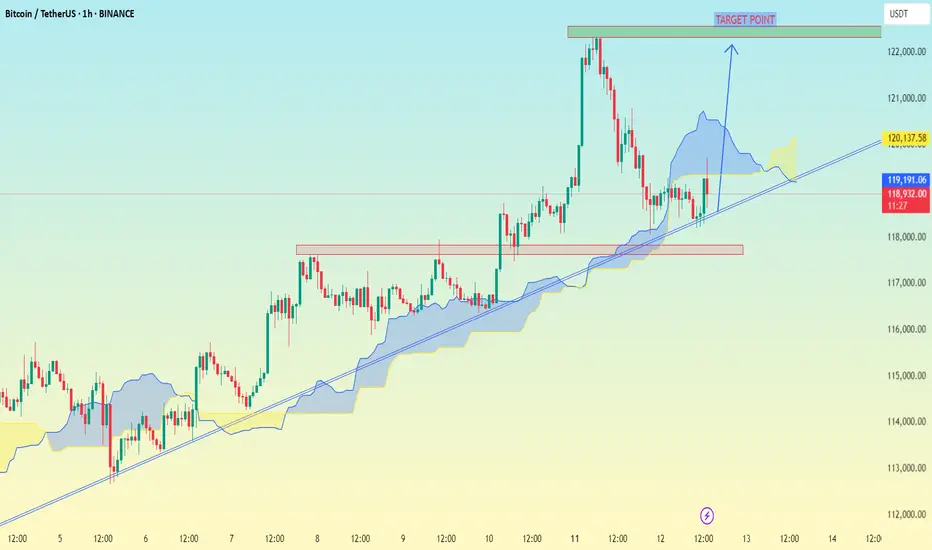
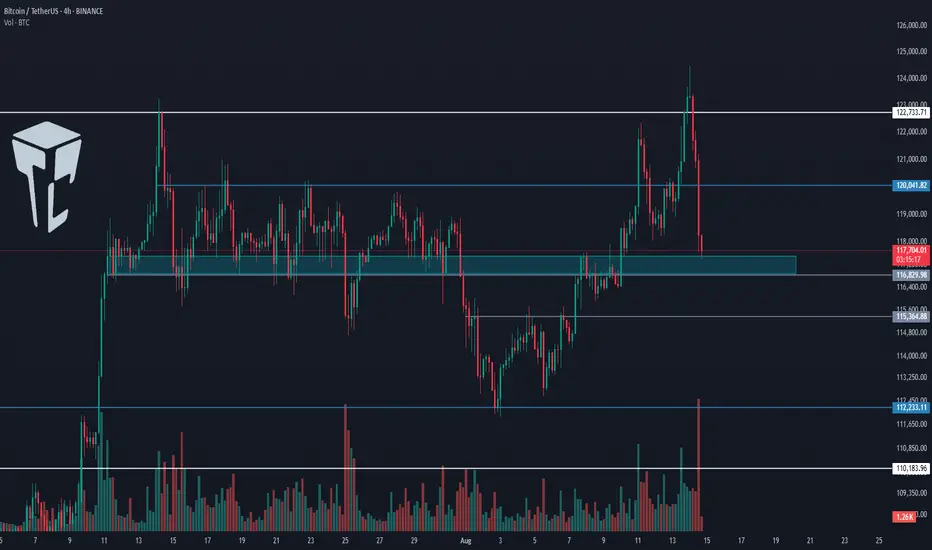
BTC/USD 1h chart Pateern.From this updated chart, "TARGET POINT" label more clearly.
The horizontal green box you marked is roughly between $122,000 and $123,000 (though this seems like a different scale—possibly a derivative or index, not direct BTC price in USD).
The price is breaking above the descending trendline and heading toward that high-volume resistance zone.
The main targets I see from your own chart markings are:
First target: around $118,991 (blue label) — likely the nearest resistance.
Second target: around $120,137 (yellow label) — next key high-volume node.
Final target (your green box): around $122,000–$123,000.
These seem to be based on volume profile gaps and resistance levels.
BTC: Uptrend remains strong despite a slight sell-offBTC: Uptrend remains strong despite a slight sell-off
From our previous analysis, BTC rose beyond our first target and turned back down.
Once again BTC proved to be the market favorite, reaching a new all-time high near 124500.
So far we can see a sell-off that could be a profit from the unknown, but the price is already preparing to face a strong price barrier.
BTC remains bullish, and as long as we don’t see any sign from the bears, the chances of an uptrend remain high.
Don’t forget that Trump Media holds $2 billion in BTC, bets $300 million in options.
Even if it moves a little lower, I think the price should continue to rise further to 126k and 130k.
You may find more details in the chart!
Thank you and Good Luck!
PS: Please support with a like or comment if you find this analysis useful for your trading day
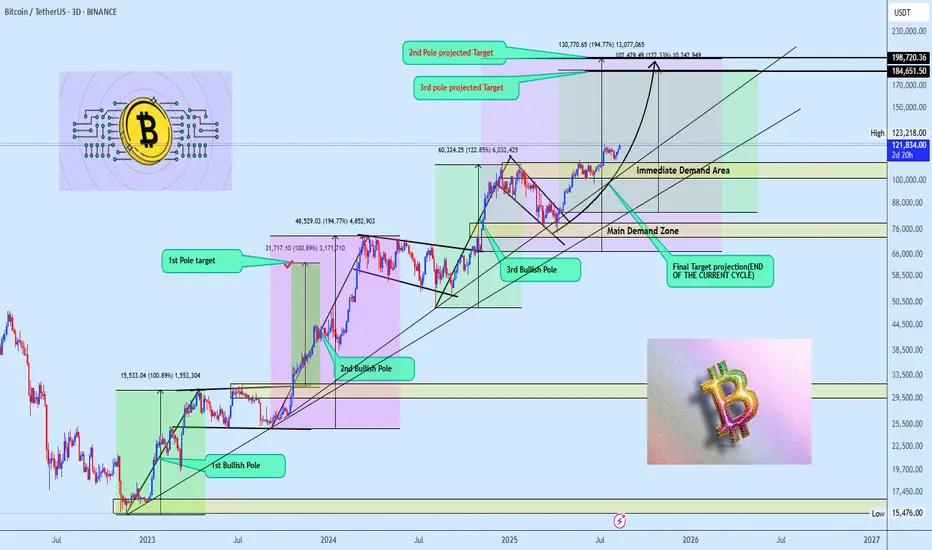
Bitcoin’s Triple Bullish Pole Sequence Next Stop $184K+? Bitcoin’s long-term bull run is unstoppable, powered by a sequence of bullish flag and pole formations. The first pole delivered $63K. The second is still in play, aiming at $198K. The third, born after a breakout above its own flag and the all time high, now eyes $184K with price cruising above $121K.
Since late 2023, a rock solid ascending trendline has been the market’s backbone, holding as dynamic support through every pullback. The immediate demand zone is your prime reload spot if price dips, while the main demand zone is a fortress level support for future positioning.
Momentum is strong, structure is flawless, and the path toward those pole targets remains wide open as long as support holds.
Now’s the time let’s ride this bullish wave! Drop your altcoin requests in the comments like we always do, and smash that like button to keep the energy flowing. 🚀
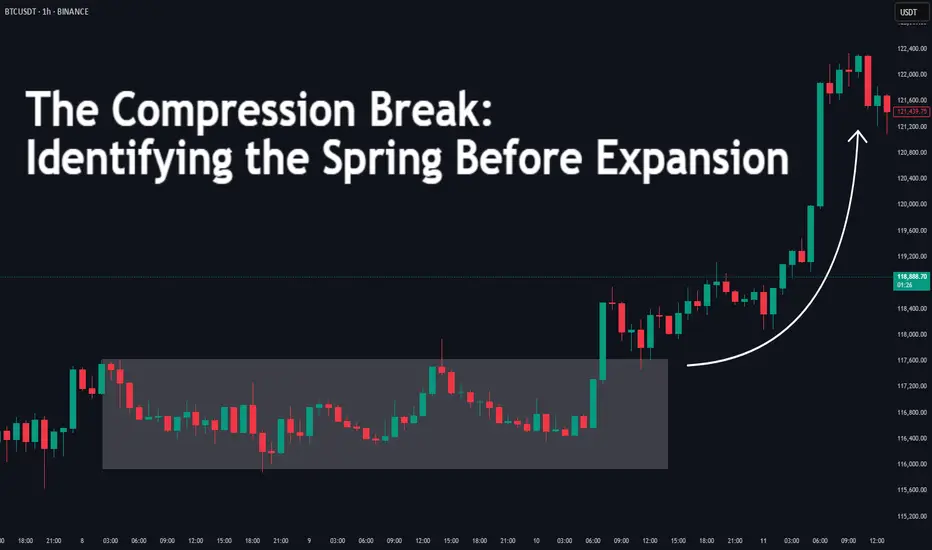
The Compression Break: Identifying the Spring Before ExpansionDifficulty: 🐳🐳🐳🐋 (Intermediate)
This article is for traders who want to recognize and trade explosive moves that form after periods of tight price compression. Perfect for those familiar with structure, volume, and volatility concepts.
🔵 INTRODUCTION
Price doesn’t move in a straight line — it breathes. It expands when there’s imbalance, and it compresses when the market is building energy. The most powerful moves often start with a compression phase — a tight, controlled price range — before a sudden breakout.
Learning to spot these “springs” before they snap can give you trades with excellent risk/reward ratios and clear invalidation points.
🔵 WHAT IS COMPRESSION?
Compression occurs when price volatility shrinks, and each swing becomes smaller than the last. It looks like price is being “squeezed” between converging support and resistance levels.
Common causes of compression:
Liquidity build-up before a major session open
Market waiting for a news release or key event
Institutional positioning before a drive
The tighter the range, the bigger the potential release.
🔵 WHY IT MATTERS
Compression is important because:
It reveals where the market is balanced and undecided
It creates a high-energy environment — a small push can trigger big moves
It offers tight stop-loss placement and clear breakout targets
Think of it like a coiled spring: the more it’s compressed, the more explosive the release.
🔵 HOW TO IDENTIFY COMPRESSION
1️⃣ Price Action Clues
Consecutive smaller candles with overlapping ranges
Lower highs + higher lows (triangle formation)
Reduced wick size in the final stages before breakout
2️⃣ Volume Clues
Declining volume during the squeeze
Sudden volume spike as breakout begins
3️⃣ Volatility Clues
ATR (Average True Range) dropping to local lows
Bollinger Bands narrowing (optional)
🔵 TRADING THE COMPRESSION BREAK
Step 1: Define the Box
Mark the high and low of the compression range. This will be your breakout reference.
Step 2: Wait for Volume Confirmation
Avoid jumping in on the first tick outside the box. Wait for a volume surge or strong close beyond the boundary.
Step 3: Trade in the Breakout Direction
Entry: After confirmed breakout close
Stop Loss: Inside the compression range
Target: Equal to the height of the compression box or previous swing high/low
🔵 EXAMPLE SCENARIO
Price compresses for more then 10 bars into a tight range
Volume steadily declines → ATR hits a local low
A big body bullish candle breaks above range high with 2× average volume
Entry at breakout close, stop inside range, target = box height projected upward or 1:2 RR
🔵 ADVANCED TIPS
Align with higher timeframe trend for higher probability
Watch for false breakouts (liquidity sweeps) before real move
Combine with order blocks or VWAP to refine entries
Use session timing — many compression breaks happen at market opens
🔵 CONCLUSION
Compression is the market’s way of loading a trade with potential energy. When you spot it, you’re seeing the buildup before the burst. Trade it with patience, volume confirmation, and proper structure, and it can become one of your highest-probability setups.
Have you traded compression breaks before? Share your best example in the comments!
#BTC #BTCUSD #BTCUSDT #BITCOIN #Analysis #Eddy#BTC #BTCUSD #BTCUSDT #BITCOIN #Analysis #Eddy
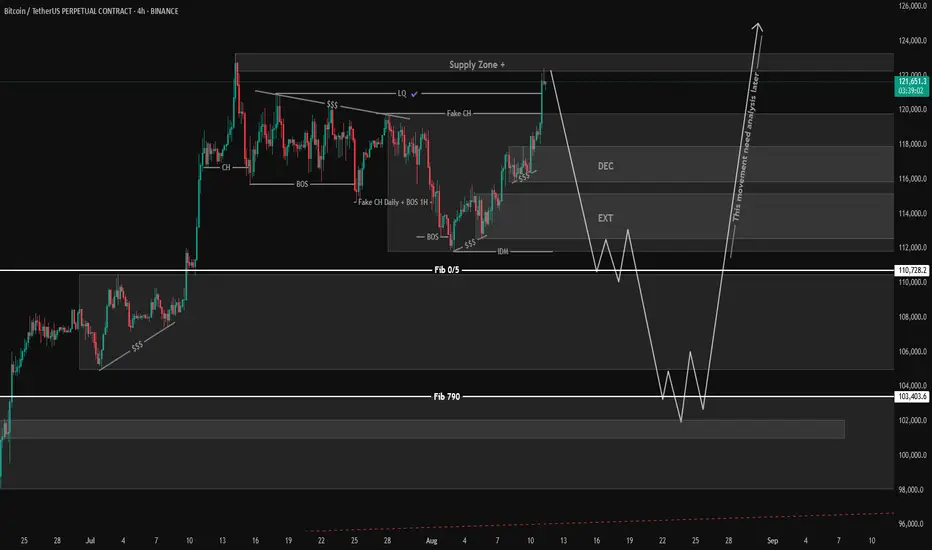
I have identified the important supply and demand zones of the higher timeframe for you.
This analysis is based on a combination of different styles, including the volume style with the ict style.
Based on your strategy and style, get the necessary confirmations for this analysis to enter the trade.
Don't forget about risk and capital management.
The responsibility for the transaction is yours and I have no responsibility for your failure to comply with your risk and capital management.
💬 Note: This is just a possibility And this analysis, like many other analyses, may be violated. Given the specific circumstances of Bitcoin, it is not possible to say with certainty that this will happen, and this is just a view based on the ICT style and strategy with other analytical styles, including the liquidity style. (( The fall of Bitcoin may not change the trend of altcoins and money will move out of Bitcoin and into altcoins, and we will see altcoins grow. ))
Be successful and profitable.
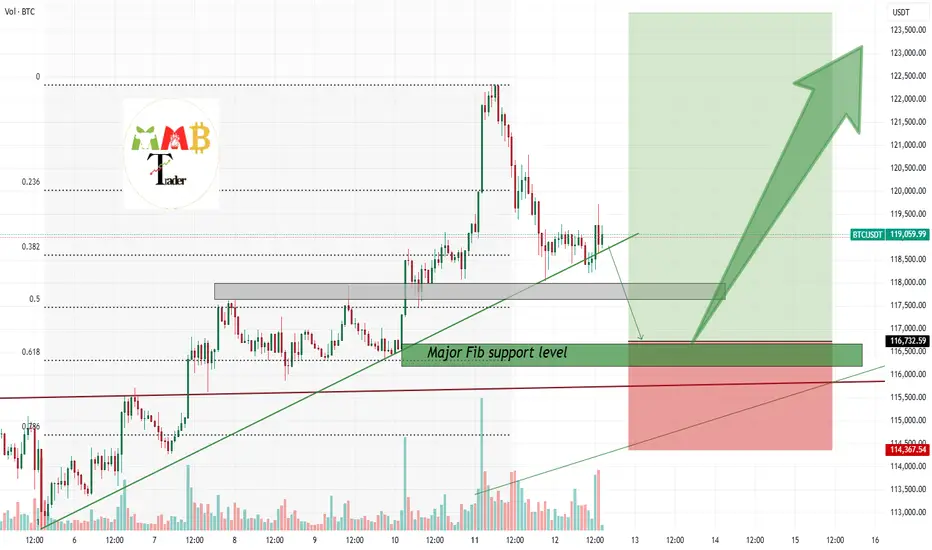
BTC/USD.chart pattern.( BTCUSDT).
The highlighted “TARGET POINT” zones in green show areas where price could gravitate toward based on high-volume and low-volume nodes.
From the chart:
First green target zone is around 112,300 – 113,000 USDT
Second green target zone is around 118,000 – 119,000 USDT
The arrows and low-volume area between these suggest that price might move quickly through the gap (low liquidity zone) toward the nearest high-volume support/resistance area.

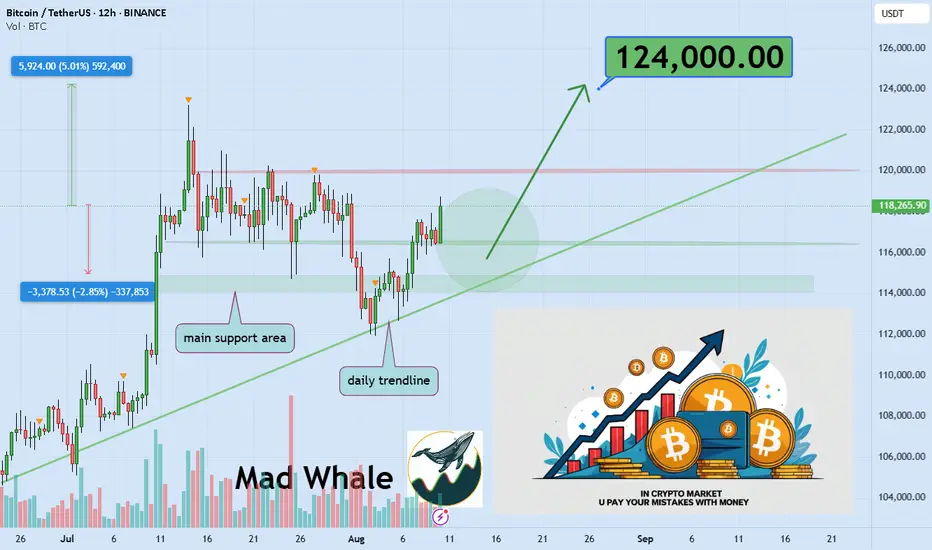
Mistakes Cost Real Money, In trading world In the crypto market, a mistake is not just a note on paper, it’s money leaving your pocket.
Sometimes you need to lose money to feel the real lesson.
If you learn from it, that loss can make you a better trader.
Hello✌️
Spend 2 minutes ⏰ reading this educational material.
🎯 Analytical Insight on Bitcoin:
BINANCE:BTCUSDT is showing strong volume near solid daily support and a key trendline. A 5% rally toward $124k is anticipated 🚀📈
Now , let's dive into the educational section,
💸 Mistakes You Must Make
Some mistakes are part of the process.
When you hit a stop loss or see a big loss, you understand risk much better.
These mistakes show you why you must always have a plan.
Lessons from losing real money stay in your mind much longer than lessons from books or videos.
🔍 Risk Management and Fundamental Researc h
Spot trading gives you more time to fix mistakes than futures, but losing money here can still teach you a lot.
When you lose some of your capital, you see why stop loss and take profit are important.
Researching the team, roadmap, and trading volume can save you from bad projects.
Managing your capital makes sure one bad trade doesn’t destroy your account.
🪞 How Market Emotions Affect You
Your emotions often reflect the overall mood of the market.
When everyone is greedy, you may feel unjustifiably excited.
When everyone is fearful, you might miss great opportunities.
Learning to separate your mind from crowd emotions is one of the hardest yet most crucial skills.
🧠 Demo Account vs Real Account
In a demo account, you are only playing with numbers.
In a real account, you are dealing with your own emotions, fear, and greed.
When real money is involved, even a small price move can make your heart race.
This is why, after learning and practicing for months, you should start real trading with very small money.
Only then will you know what risk feels like in real life.
🕰 Why Patience Matters
Many losses happen because of rushing, not because of a bad strategy.
Sometimes waiting a few more minutes can give you a clear view of the market.
The market always gives another chance, but lost money is hard to get back.
🎯 Why You Need a Trading Journal
Writing down your entry, exit, and feelings for every trade helps you see your mistakes and strengths.
A trading journal is like a second memory that stops you from making the same mistake again.
📊 Useful Tools in TradingView
One of TradingView’s biggest advantages for traders is its set of tools that can save you from costly mistakes.
For example, with the Price Alert tool, you can get notified before the price reaches critical levels, helping you avoid emotional decisions.
Indicators like the Relative Strength Index (RSI) or Moving Average Convergence Divergence (MACD) help you detect weaknesses in your strategy before execution.
Drawing support and resistance lines repeatedly trains you to know where price might reverse in a crisis.
Fibonacci Retracement is an excellent way to spot potential reversal levels, especially during unexpected corrections.
Volume Profile shows where the highest buying and selling activity has occurred, helping you avoid weak entry zones.
⚖️ Balance Between Learning and Doing
Reading books or watching videos is not enough.
Trading without knowledge is also dangerous.
You must grow your knowledge and experience at the same time.
Summary
In crypto trading, mistakes are normal, but repeating them is your choice.
If you learn from a loss, it is worth it.
Start small, use your tools, and let experience make you stronger.
✨ Need a little love!
We pour love into every post your support keeps us inspired! 💛 Don’t be shy, we’d love to hear from you on comments. Big thanks , Mad Whale 🐋
📜Please make sure to do your own research before investing, and review the disclaimer provided at the end of each post.
TradeCityPro | Bitcoin Daily Analysis #152👋 Welcome to TradeCity Pro!
Let’s get into the Bitcoin analysis. Unfortunately, I couldn’t post the analysis yesterday, but starting today, it will once again be posted daily as part of our regular routine so you can benefit from it.
⏳ 1-Hour Time Frame
Yesterday, on the 1-Hour chart, Bitcoin made a strong upward move and set a new all-time high at the 124474 zone.
💥 However, today the US Producer Price Index (PPI) was released, showing an unusual figure of 0.9%. This news is very negative for Bitcoin because it means the Federal Reserve may not be able to lower interest rates, which is bearish for Bitcoin.
⭐ This negative news caused Bitcoin, after the fake breakout of the 122733 zone, to drop, and the price has now fallen back to the 117000 zone. The momentum of this drop has been quite strong.
⚡️ If the 117000 zone breaks, the probability of a decline toward the 110000 zone will increase significantly because a very important resistance has been faked out, which has weakened buyer strength considerably.
🔍 In my opinion, the likelihood of this happening is low because this large candle we see was triggered by news, and the effects of news are more important in the long term rather than immediately at the time of release. However, the news that was released is fundamentally negative for Bitcoin in the long run and could even be the starting point of a bearish trend for Bitcoin.
✔️ So, from a fundamental perspective, it’s better to wait for Powell’s September session.
📊 But if the 117000 zone holds as support, we can consider opening long positions when suitable triggers are activated because the trend is still bullish, and the price could retest the previous high again.
❌ Disclaimer ❌
Trading futures is highly risky and dangerous. If you're not an expert, these triggers may not be suitable for you. You should first learn risk and capital management. You can also use the educational content from this channel.
Finally, these triggers reflect my personal opinions on price action, and the market may move completely against this analysis. So, do your own research before opening any position.
Bitcoin soon above 123K again enter long near 0.61% Fib support The price can pump without touching our entry because market is gonna start next phase pump ASAP but we put our short-term signal on one of the major support which is 0.61 Fib retracement level and also trade is 1:3(Risk: Reward).
for long-term view and CRYPTOCAP:BTC target which is 137K$ in my mind take a look at daily chart linked below.
DISCLAIMER: ((trade based on your own decision))
<<press like👍 if you enjoy💚
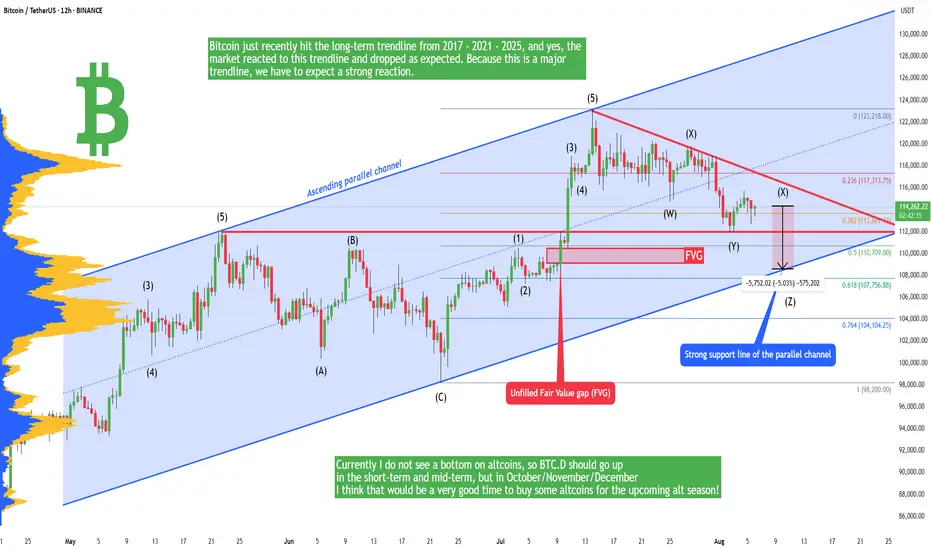
Bitcoin - Downtrend will continue to 109,000! Alt-season OctoberBitcoin and altcoins have been crashing in the past 2 weeks! Is there any hope for a bull market, or has the bullish cycle ended? In this analysis I will tell you my personal opinion, and if you haven't seen my previous very successful analysis on Bitcoin, you can do it right now! Because it's highly informative, and it can open your closed eyes.
In short, Bitcoin just recently hit the long-term trendline from 2017 - 2021 - 2025, and yes, the market reacted to this trendline and dropped as expected. Because this is a major trendline, we have to expect a strong reaction. I still think the market needs to go lower in the short term because there is an unfilled FVG at 109k, so closing this gap would be appreciated. This GAP is also a strong support because it's in a confluence with this blue parallel channel, and the upward-sloping trendline definitely acts as a support. In the short term we should see a bounce from this trendline.
You probably saw that Ethereum massively pumped, and some specific altcoins as well. We saw a short-term alt season, there is no doubt about it, but will this altcoin season continue or not? Currently I do not see a bottom on altcoins, so BTC.D should go up in the short-term and mid-term, but in October/November/December I think that would be a very good time to buy some altcoins for the upcoming alt season!
Write a comment with your altcoin + hit the like button, and I will make an analysis for you in response. Trading is not hard if you have a good coach! This is not a trade setup, as there is no stop-loss or profit target. I share my trades privately. Thank you, and I wish you successful trades!
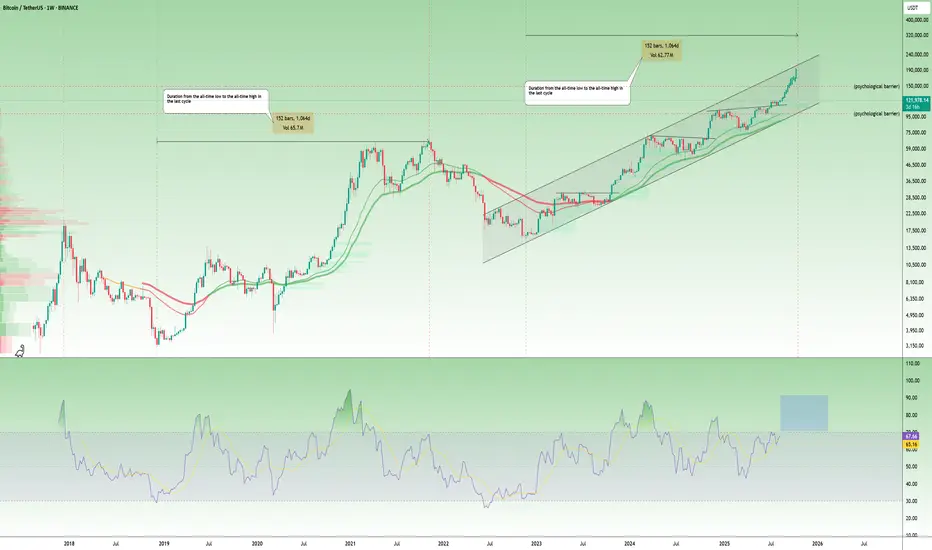
$BTC is repeating history, and it’s doing it with precision.CRYPTOCAP:BTC is repeating history, and it’s doing it with precision. 📈
In the last cycle, it took Bitcoin 1,044 days to move from the bear market bottom to a new all-time high. This cycle is on the same timeline, and we’re now well into that phase.
Price is staying inside the long-term rising channel, and momentum is building. If this continues, a macro top could form between late October and early November, maybe even by the first week of October if the rally speeds up.
The RSI is also climbing toward the same overbought levels seen before past tops. The cycle pattern isn’t random.
It’s the guide.
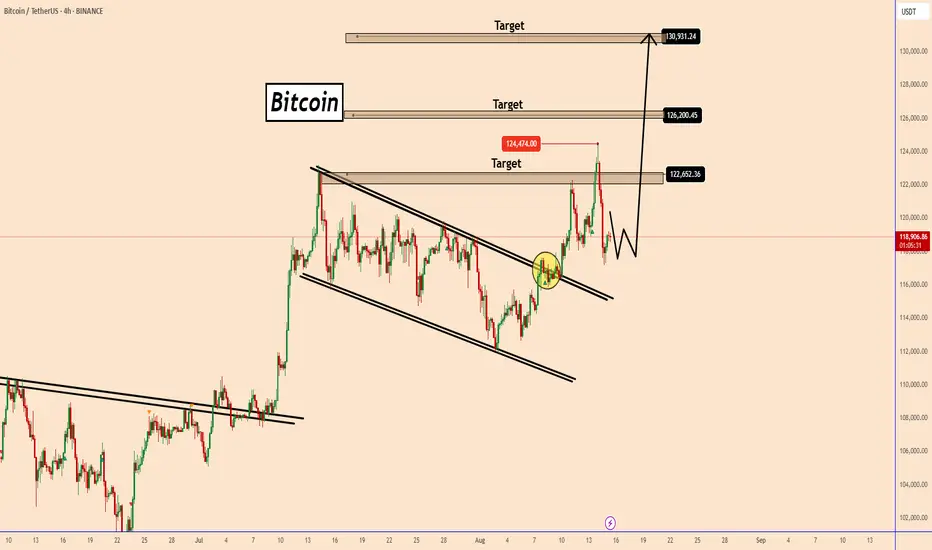
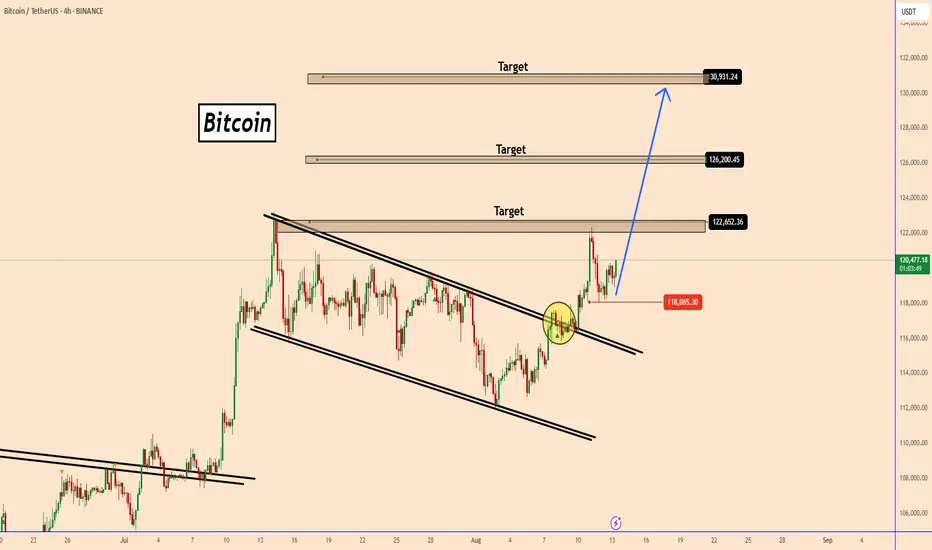
Bitcoin Resumes Bullish Momentum After CorrectionBitcoin Resumes Bullish Momentum After Correction
After reaching our initial target, BTC pulled back for a corrective move down to 118,000.
That bearish phase now appears to be complete near $118,000, with bullish momentum gaining strength once again.
Price action is currently breaking above yesterday’s high, reinforcing the upward move and adding conviction to the bullish outlook.
📍 Key Levels to Watch:
Quick target: 122,600
Extended targets (if a new all-time high is confirmed): → 126,200 → 130,000
If BTC establishes a new historical high, the probability of reaching these extended targets increases significantly.
You may find more details in the chart!
Thank you and Good Luck!
PS: Please support with a like or comment if you find this analysis useful for your trading day
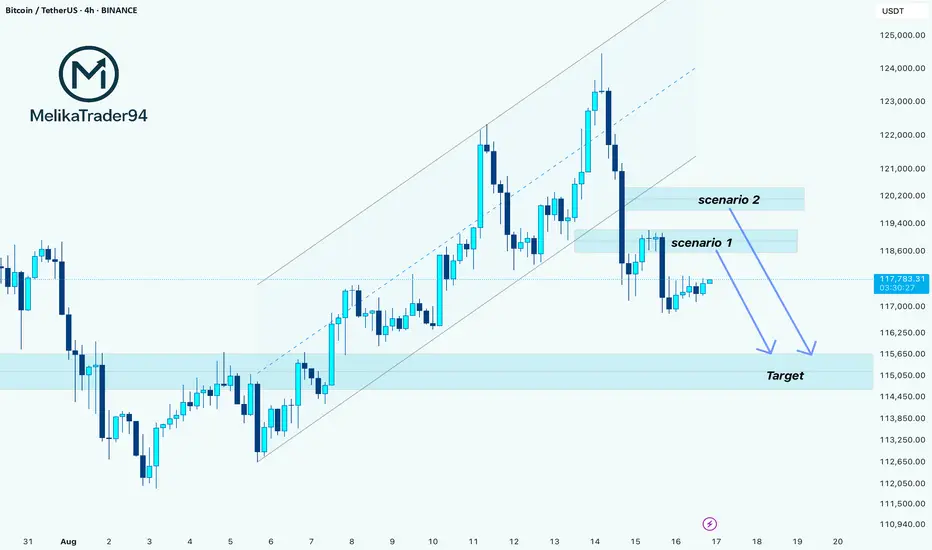
BTCUSDT (bitcoin) towards the $115kHello guys!
1-BTC broke the ascending channel
Bitcoin was moving inside an ascending channel, creating higher highs and higher lows.
Recently, it broke below the lower trendline of this channel, signaling weakness and a potential shift in momentum from bullish to bearish.
2-Engulfed the last low
After breaking the channel, BTC formed a strong bearish candle that engulfed the previous swing low.
This indicates that sellers are now in control, confirming bearish pressure in the market.
3-Current bias: Bearish with possible short entries
Despite the bearish sentiment, BTC may retest previous supply zones before continuing lower.
Two possible short entry scenarios are highlighted:
Scenario 1: Near 118,600 USDT
Scenario 2: Around 119,700 USDT
Both levels align with potential retracement areas where sellers could step back in.
4-Target
The downside target is around 115,800 USDT.
This zone coincides with previous demand/support, making it a logical area where price might find buyers again.
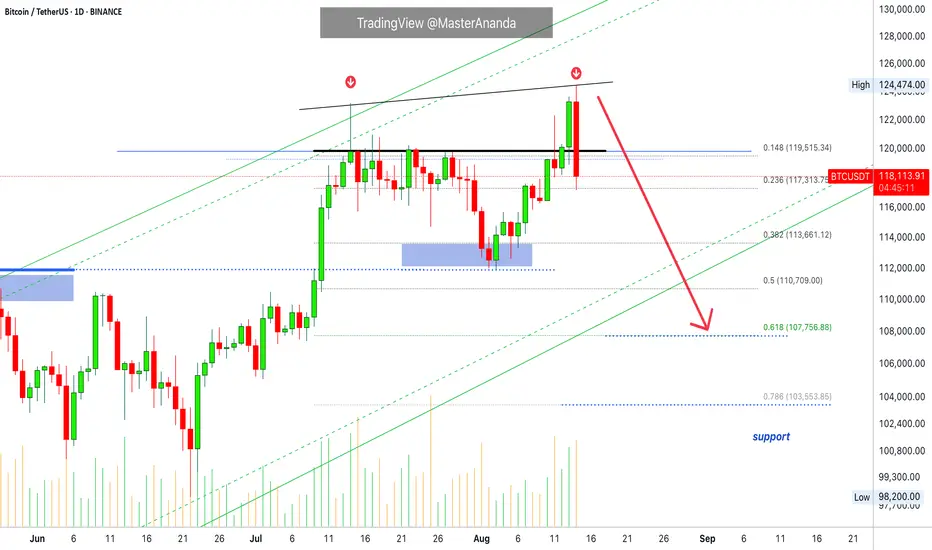
Secure Profits? Bitcoin Crash! $100K or Lower?Bitcoin broke out of a consolidation range with resistance at $112,000 and hit a high of $123,000 14-July. The retrace from this major high on 2-August reached a low of $112,000. From this low, Bitcoin made a new jump and peaked earlier today at $124,500.
This second jump produced a very strong rejection. This rejection produces a double-top pattern and points to lower prices. Bearish volume is really high. Lower is confirmed.
How far down will it go?
The first low was $112,000 and the bounce led to a double-top. The double-top means no new highs, buyers were not strong enough, which means that the next drop will break support. Since resistance holds, support is more likely to break.
Bitcoin is now headed toward $107,750 or lower to test the previous support range. We are talking a range between $100,000 and $110,000. This is the support zone that will be tested again.
Please keep in mind that if Bitcoin were to drop to $100,000, market conditions would remain extremely bullish and at the same time we would have a major 20% big correction. This means that after such correction the market can again turn and resume growing for months. Can be 3-5 months growing straight up or it can be more.
The retrace can also result in the test of previous support and this support holding, this is $112,000. If this happens, the market responds ultra-bullish and we focus on a higher high next.
Regardless of the short-term, we continue bullish long-term. Bitcoin is going down.
The bull market is not over.
Thank you for reading.
Namaste.
Lingrid | BTCUSDT Trendline Breakout - Upside Surge Potential The price perfectly fulfilled my previous idea . BINANCE:BTCUSDT is pushing higher after reclaiming the 120,000 support zone and breaking out of the corrective structure. The trend shows higher lows, maintaining the integrity of the upward channel and pointing toward the 130,000 resistance area. Holding above 120,000 strengthens bullish momentum and keeps the breakout potential alive. The next upside target aligns with the channel’s upper boundary.
📉 Key Levels
Buy trigger: Break and hold above 120,000
Buy zone: 116,000–120,000
Target: 130,000
Invalidation: Drop below 114,850
💡 Risks
Rejection at 122,000 could cause deeper pullback
Macro market weakness may reduce bullish momentum
Failure to hold 120,000 risks retesting lower channel support
If this idea resonates with you or you have your own opinion, traders, hit the comments. I’m excited to read your thoughts!

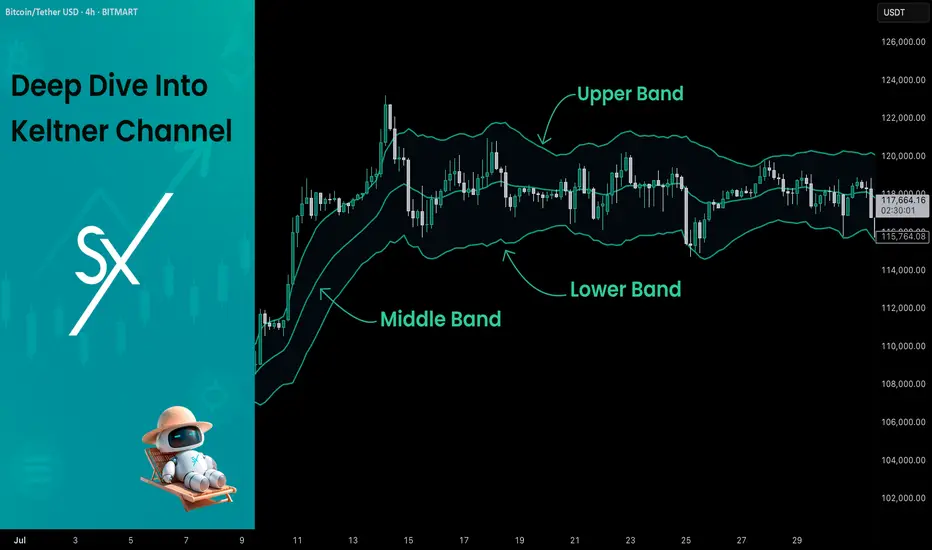
Deep Dive Into Keltner Channel 🗓The Keltner Channel is a volatility-based technical indicator that helps traders identify market trends, breakout opportunities, and potential reversal zones. Built using an Exponential Moving Average (EMA) and the Average True Range (ATR), it adapts dynamically to price movement and provides a smoother alternative to Bollinger Bands.
📚 Introduction
The Keltner Channel is a versatile volatility-based trading indicator that helps traders identify trend direction, spot potential breakout opportunities, and determine overbought or oversold conditions.
Unlike Bollinger Bands, which use standard deviation, the Keltner Channel is built around the Average True Range (ATR), making it less reactive to sudden price spikes and better at adapting to steady market trends.
At its core, the channel consists of three lines:
Middle Line – an Exponential Moving Average (EMA) of the price
Upper Band – EMA plus a multiple of ATR
Lower Band – EMA minus the same multiple of ATR
When price stays close to the upper band, it indicates strong bullish momentum.
When price hugs the lower band, bearish pressure dominates.
Periods of narrow channel width often precede breakouts, while wide channels may signal trend exhaustion.
📚 Calculation
The Keltner Channel is typically calculated as follows:
Middle Line = EMA(n) , where n is the chosen period length (commonly 20)
Upper Band = EMA(n) + ATR(m) * Multiplier , where m is chosen period length for ATR
Lower Band = EMA(n) - ATR(m) * Multiplier , where m is chosen period length for ATR
EMA smooths price data while giving more weight to recent values. ATR measures volatility by accounting for true price ranges, including gaps. Multiplier (often 2) determines how far the bands are from the EMA.
📚 How to Use Keltner Channel in Trading Strategies
⚡️Keltner Channel Breakout Strategy
The Keltner Channel breakout strategy is built on the idea that the channel defines a normal range of price movement. The middle line reflects the average trend, while the upper and lower bands expand with volatility. Most of the time, price stays inside this range, so a close outside the channel signals unusual strength. A breakout above the upper band shows that buyers are strong enough to push price beyond what is typical, while a breakout below the lower band shows the same for sellers. This behavior suggests momentum is likely to continue, making it a potential point to join the trend.
Long Setup:
Price candle shall be closed above 200-period EMA
Candle closes above the Kelner's Upper Band, indicating strong bullish breakout
Put your trailing stop-loss at the Middle Band, close trade only when candle closes below it
Short Setup:
Price candle shall be closed below 200-period EMA
Candle closes below the Kelner's Lower Band, indicating strong bearish breakdown
Put your trailing stop-loss at the Middle Band, close trade only when candle closes above it
📈Long Trading Strategy Example
1. Price candle shall be closed above 200-period EMA. In our example we have BITMART:BTCUSDT.P 4h time frame.
2. Open long trade when price candle closed above the Keltner's Upper Band.
3. Close trade when price candle closes below the Middle Band
In our case we have 2:1 risk to reward trade if we compare initial stop loss and exit price.
📉Short trading strategy example
1. Price candle shall be closed below 200-period EMA. In our example we have BITMART:ETHUSDT.P 4h time frame.
2. Open short trade when price candle closed below the Ketlner's Lower Band.
3. Close trade when price candle closes above the Middle Band
In this case we have not a good trade. After closing short price continues dropping but then suddenly pumped and destroyed all gained profit. We think it's also important to show such trades it will make you more prepared for real market when you start trade using this strategy.
🧪 Important: as you could see stop-loss on the candle close above/below Middle Band can't be the best decision in every case. It will help you to avoid the false trade close, but usually significantly cut your profit. As always we highly recommend to make your out backtest using different trade exit approaches. You can try 3:1 RR or close exactly at the Middle Band and compare the results with provided close only approach.
⚡️Pullback to the Middle Line
The pullback-to-the-middle-line strategy focuses on the EMA at the center of the Keltner Channel, which acts as dynamic support in uptrends and resistance in downtrends. In trending markets, price often retraces to this middle line before continuing in the direction of the prevailing move.
When the EMA is sloping upward, traders look for buying opportunities when price returns to the middle line, expecting the trend to resume. In a downtrend, the EMA slopes downward, and touches of the middle line can be used as selling points.
Exits are usually made at the opposite channel band, since price tends to extend from the EMA toward one of the outer boundaries. This gives the setup a favorable risk-to-reward profile: stops are placed near the middle line or the most recent swing, while profit targets are naturally defined by the channel structure. The key is to apply the strategy only in clear, directional markets, as pullbacks lose reliability in sideways or choppy conditions.
Long Setup:
Middle Band's slope shall be upward indicating the short-term uptrend.
Open long trade when price pulled back to the Middle Band.
Put stop-loss below the Lower Band.
Take profit at the Upper Band.
Short Setup:
Middle Band's slope shall be downward indicating the short-term downtrend.
Open short trade when price pulled back to the Middle Band.
Put stop-loss above the Upper Band.
Take profit at the Lower Band.
📈Long Trading Strategy Example
1. Middle Band's slope shall be positive. We use BITMART:BTCUSDT.P 4h time frame.
2. Open long trade when the price pulled back to Middle Band.
3. Put initial stop loss at the Lower Band.
4. Take profit at the Upper Band.
📉Short trading strategy example
1. Middle Band's slope shall be negative. We use BITMART:BTCUSDT.P 4h time frame.
2. Open short trade when the price pulled back to Middle Band.
3. Put initial stop loss at the Upper Band.
4. Take profit at the Lower Band.
🧪 Important: this strategy provides high frequent fast trades with poor risk to reward. Typically it equals approximately 1:1, but this setup has the high probability to play out well. Moreover, this strategy can be used in conjunction with the strategy from point 1 described above. Conditions don't contradict to each other and can allow you to earn money on two different market conditions.
⚡️Mean Reversion Strategy
The mean reversion strategy with the Keltner Channel is based on the assumption that price tends to return toward its average after moving too far away. The outer bands of the channel serve as dynamic thresholds that help identify when the market is stretched.
When price closes near or beyond the upper band, it suggests temporary overextension to the upside, creating an opportunity to anticipate a move back toward the EMA. Conversely, when price touches or moves below the lower band, traders look for a rebound toward the middle line.
The trade idea is to enter counter to the extreme move, with exits placed around the central EMA. Stop losses are typically set just outside the channel to protect against strong breakouts. This approach works best in sideways or range-bound markets, where prices oscillate around a fair value, but it tends to underperform in strong trends.
Long Setup:
Price candle shall be closed above 200-period EMA.
Open long when price touches the Lower Band.
Put initial stop-loss according to your money management system.
Close trade the Upper Band.
Short Setup:
Price candle shall be closed below 200-period EMA.
Open short when price touches the Upper Band.
Put initial stop-loss according to your money management system.
Close trade the Lower Band.
📈Long Trading Strategy Example
1. Price candle shall be closed above 200-period EMA. In our example we have BITMART:BTCUSDT.P 4h time frame.
2. Open long at the Lower Band
3. Put stop-loss. In our case we use 2%, you can use stop-loss based on your asset/time frame volatility and money-management.
4. Take profit at the Upper Band.
📉Short trading strategy example
1. Price candle shall be closed below 200-period EMA. In our example we have BITMART:ETHUSDT.P 4h time frame.
2. Open short at the Upper Band
3. Put stop-loss. In our case we use 3%, you can use stop-loss based on your asset/time frame volatility and money-management.
4. Take profit at the Lower Band.
📚 Conclusion
The Keltner Channel is a versatile tool that adapts to different market conditions and trading styles. Whether applied as a breakout system to capture momentum, as a pullback framework to ride established trends, or as a mean reversion setup in ranging markets, it provides traders with a structured way to interpret price action. Like any strategy, its effectiveness depends on matching the approach to the prevailing market environment and applying consistent risk management. By understanding the underlying logic of each method and practicing disciplined execution, traders can make the Keltner Channel a valuable part of their technical toolkit.
The Golden Pocket: Fibonacci’s Sweet Spot in TradingHello, traders! 😎
If the crypto market had a VIP lounge, the golden pocket would have a permanent reservation. It’s that elusive, almost mystical zone in the Fibonacci retracement where price often decides its fate. Will it make a heroic comeback… or lose steam entirely? Before we dive in, one thing needs to be crystal clear: the golden pocket in trading is not a magic wand. On its own, it’s just a mathematical range. Used without confirmation from other indicators, volume analysis, or broader market context, it can lead you straight into a trap. Professional traders and algorithms treat it as one tool in a much BIGGER TOOLBOX .
What Is the Golden Pocket in Trading?
In technical terms, the golden pocket refers to a specific slice of the Fibonacci retracement scale, typically between 61.8% and 65%. These numbers aren’t random. The 61.8% figure comes from the Fibonacci sequence, a ratio found in nature’s architecture — spirals of seashells, galaxies, flower petals — and eerily echoed in financial markets. The small range between 61.8% and 65% is what traders call the Fibonacci golden pocket or golden pocket fib levels.
Here’s the logic: when an asset trends up but starts to pull back, it often retraces a portion of that move before continuing. The fib retracement golden pocket tends to be the last meaningful zone where buyers step in before momentum breaks completely. In a downtrend, it works the same way but inverted — the price rallying into the golden pocket often finds sellers ready to push it back down.
Why does it matter? Market behavior is, in part, a reflection of human psychology. Many traders — from retail to institutions — watch these levels, which makes reactions here more probable. Add in algorithms coded to act at certain Fibonacci ratios, and you have a cluster of activity that can turn the golden pocket into a genuine battleground.
But, and here’s that warning again, a retracement into the golden pocket alone doesn’t guarantee a reversal. Without confluence from other tools (trendlines, moving averages, volume spikes, momentum oscillators), it’s simply a potential reaction zone.
Why the Golden Pocket Works (Sometimes)
The golden pocket trading concept thrives on repetition. Over years of chart history across markets — stocks, forex, crypto — this small Fibonacci zone has been tested again and again. It often coincides with areas of previous support/resistance or with liquidity zones where large orders are waiting.
Think of it like this: if price is a runner and the market is a racetrack, the golden pocket is the point where the runner slows down to decide whether to push for another lap or leave the track. Sometimes they sprint ahead, sometimes they collapse, but the decision often happens there.
In crypto, this zone is particularly watched because of the market’s volatility. Bitcoin, Ethereum, and other majors have shown countless reactions here, which keeps the cycle going. Traders believe in it because it’s worked before, and because traders believe in it, it works again… until it doesn’t. That’s the critical point. IT DOESN’T ALWAYS WORK . Treating it as gospel is one of the fastest ways to get stopped out. Smart traders always ask: What else confirms this zone?
A Real Bitcoin Example
Let’s jump back to September 2021. Bitcoin had rallied from its July swing low around $29,000 to the early September high near $52,900. Then, a correction began.
If you plotted a Fibonacci retracement from that July low to the September high, the pullback landed almost perfectly in the golden pocket range between $42,800 and $41,900. On the chart, this wasn’t just a random number zone — it aligned with a previous area of consolidation and a visible liquidity shelf.
The market reaction? Price respected the zone, paused for a few sessions, then bounced to retest the $52K area. However, here’s the twist — it didn’t break new highs. By November, the rally failed, and BTC entered a deeper correction.
That single example tells you everything you need to know: the golden pocket can be a reaction point, but not a guaranteed trend reversal. Those who combined it with volume divergence, macro sentiment, and moving averages saw the warning signs early. Those who didn’t… learned a painful lesson.
The Takeaway
The golden pocket fibonacci is one of those charting concepts that sticks in traders’ minds because it’s both elegant and, at times, eerily accurate. It’s a reflection of how price action can mirror natural ratios found in the world around us.
But markets are not bound by mathematics alone — they’re driven by liquidity, sentiment, and macroeconomic forces. The golden pocket in trading works best when it’s part of a confluence: combine it with other technical indicators, volume profile analysis, or key horizontal levels.
On its own? It’s just a pretty number. In the right hands, with the right supporting evidence, it’s a zone where history has shown the market likes to make decisions.

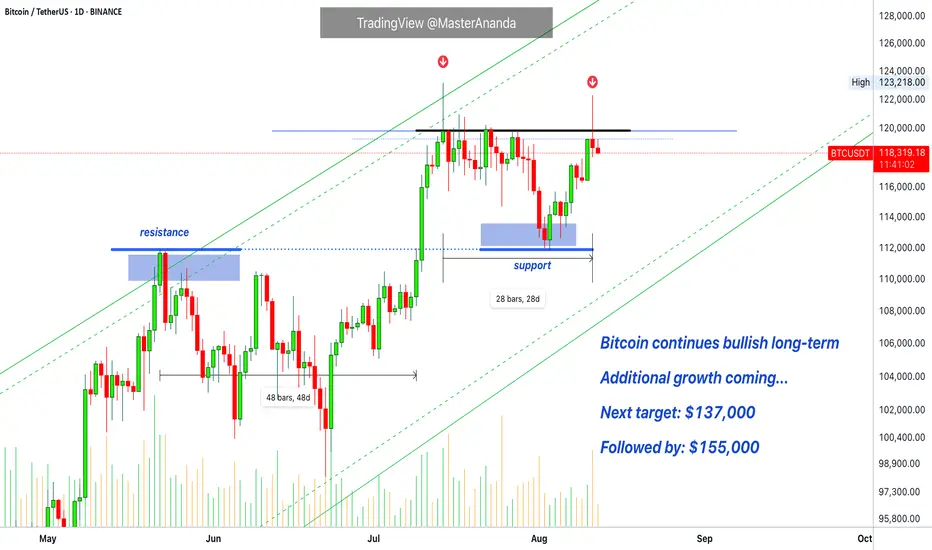
Bitcoin Update Short-Term · Ignore Rejection At ResistanceQuick update and important. This will not change the broader market picture and our view. The market will continue growing long-term.
Here Bitcoin is showing a strong rejection on the daily timeframe coupled with a lower high and rising bearish volume. This can lead to some bearish action. This bearish action can be considered part of the consolidation period below resistance. As Bitcoin moves sideways, fluctuates, the altcoins market should continue to grow.
The bullish bias will be revealed based on the fact that day after day, many new altcoins will continue to break up.
The consolidation period for Bitcoin to break above $112,000 was 48 days. It's been 28 days since Bitcoin challenged $123,000. Do not be distracted, Bitcoin will continue to grow.
If you have any questions, feel free to leave a comment.
» If there is any altcoin you would like me to look at, just leave a comment with the trading pair ticker and I will do a full analysis for you.
Thanks a lot for your continued support.
Namaste.
BITCOIN DAILY/4HR THE daily trendline and 4hr trendline break out will be watched for forward guidance.
if we break the top layer resistance we buy and target 123k current all time and high and factor the possibility of 135-130k-128k zone for next sell.
And our sell will be on break of steep ascending trendline acting as dynamic support and we will watch 114k and 111.78k zone and further downslide wiill be 90k-100k zone.
zone by zone layer by layer.
the structure of the market is clear ,it will never lie.
trading is 100% probability and you need the mindset of a hunter, dont buy because others are buying.
your risk to reward ratio should be your trade reason.
GOODLUCK
