Bitcoin is on fire!Bitcoin is on fire!
🔥 Heading for an all-time high - will it break the record this time?
I THINK YES!!!
Write your opinion
USDTBTC trade ideas
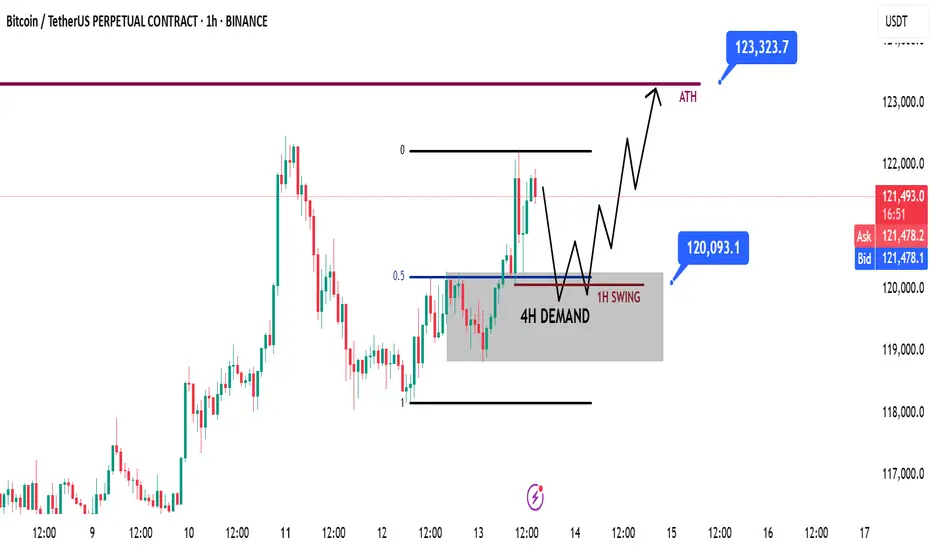
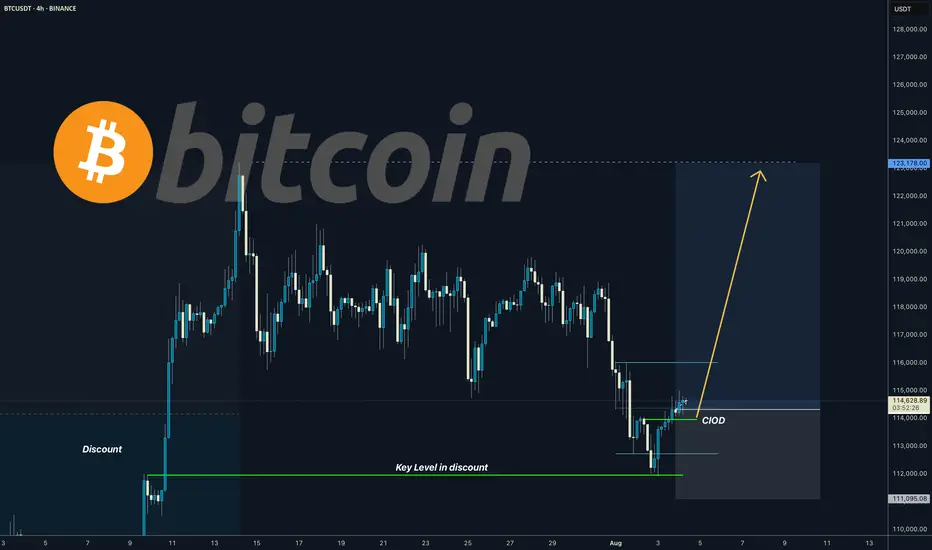
BTC | Long Idea – All-Time Highs LoadingBTC | Long Idea
📊 Market Sentiment
Overall sentiment remains bullish, supported by expectations of a 0.25% rate cut in the upcoming FOMC meeting. A weakening USD and increasing global risk appetite are providing favorable conditions for further upside in crypto assets.
📈 Technical Analysis
Price formed a 4H demand zone and immediately retested it, showing a strong bullish reaction.
That retest offered a perfect entry, but there’s still potential for another move back to the demand zone before pushing higher.
The 1H swing low liquidity sits in confluence with both the 4H demand zone and the 0.5 Fibonacci retracement level — a strong triple confluence.
This alignment occurs around the $120,000 level, making it a key watchpoint.
📌 Game Plan
Wait for price to revisit the 4H demand zone.
Look for a sweep of the 1H swing low liquidity.
See the 0.5 Fibonacci level tapped for maximum discount before continuation.
🎯 Setup Trigger
Look for a 1H market structure break after price taps the $120,000 confluence zone.
📋 Trade Management
Stoploss: Below the 1H swing low that confirms the break of structure.
Target: Direct push towards all-time highs at $123,300.
💬 Like, follow, and comment if you find this setup valuable!
Disclaimer: This is not financial advice. The content is for informational and educational purposes only and reflects personal opinions.
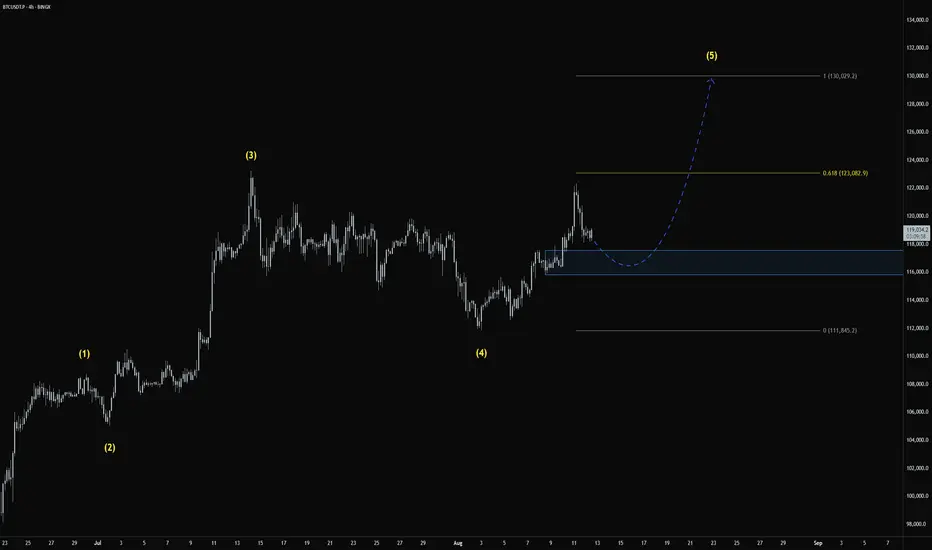
BTC is in the 4th wave zone.BTC is in the 4th wave zone. Key support at 108.8K — as long as price holds above, targets at 123K and 130K remain in play. A break below cancels the scenario.
#BTCUSD #Bitcoin #ElliottWave
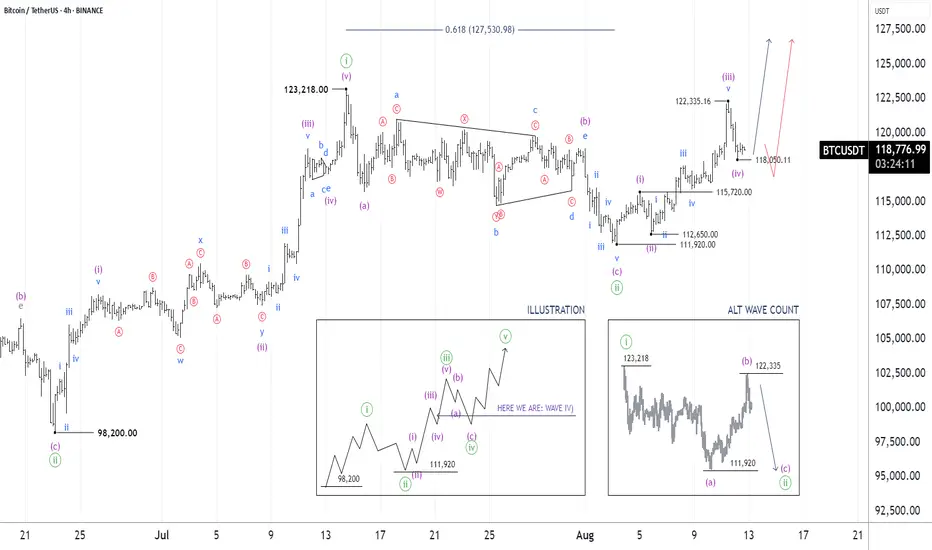
BITCOIN (BTCUSDT): 12 AUG, 2025 || ELLIOTT WAVE ANALYSISConclusion: Wave iii))-green is continuing to move higher.
Key Points: Wave iii))-green is extending, and subdividing into wave i)-purple to wave iv)-purple. I am not sure if wave iv)-purple is finished, but it should not move lower than 115,720 (Invalidation Point: Wave 4 should not overlap wave 1).
On the other hand, 118,050.11 acts as a key level that price needs to hold higher, to gain confidence, weight for this view.
©By Hua Chi Cuong (Shane), CEWA-M | Certified Elliott Wave Analyst - Master Level
BTCUSD 09.08.2025+ Positive crypto news: President Trump wants more cryptocurrency in 401(k) retirement savings plans.
*Usually, I'm not sure about taking trades on weekends due to lower volume, but looking at how ETH was reacting, I thought, "Then, why not BTC as well?".
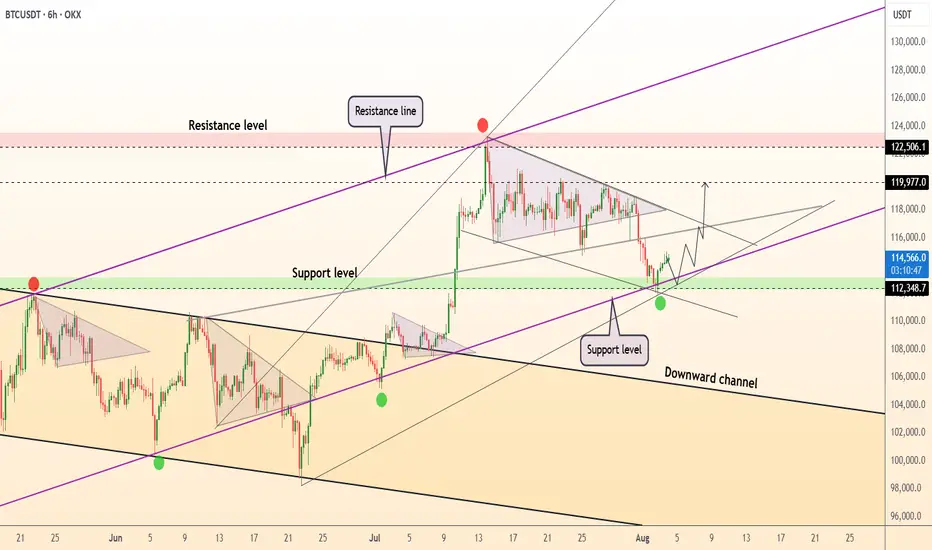
DeGRAM | BTCUSD reached the support level📊 Technical Analysis
● BTCUSD has bounced from confluence support at 112.3k–114.8k, reclaiming the ascending support line and validating the lower boundary of the rising triangle.
● Price action suggests a bullish continuation setup with targets at 119.9k and extension to the upper resistance near 122.5k–125k.
💡 Fundamental Analysis
● US labor data slowdown and dovish Fed commentary have pulled real yields lower, boosting crypto demand.
● Glassnode reports ongoing whale accumulation and rising stablecoin inflows, signaling positive capital rotation into BTC.
✨ Summary
Long above 114.8k. Targets 119.9k → 122.5k+. Setup invalidated on a break below 112.3k support.
-------------------
Share your opinion in the comments and support the idea with a like. Thanks for your support!
Bitcoin testing 116k zoneIf we are successful in breaking above the 116k zone resistance. Bitcoin will pump hard to 120k and 123k next. As the high time frame trend continues to stay uptrend. Let's see if bitcoin breaks it now or has some other plans.
Stay tuned!

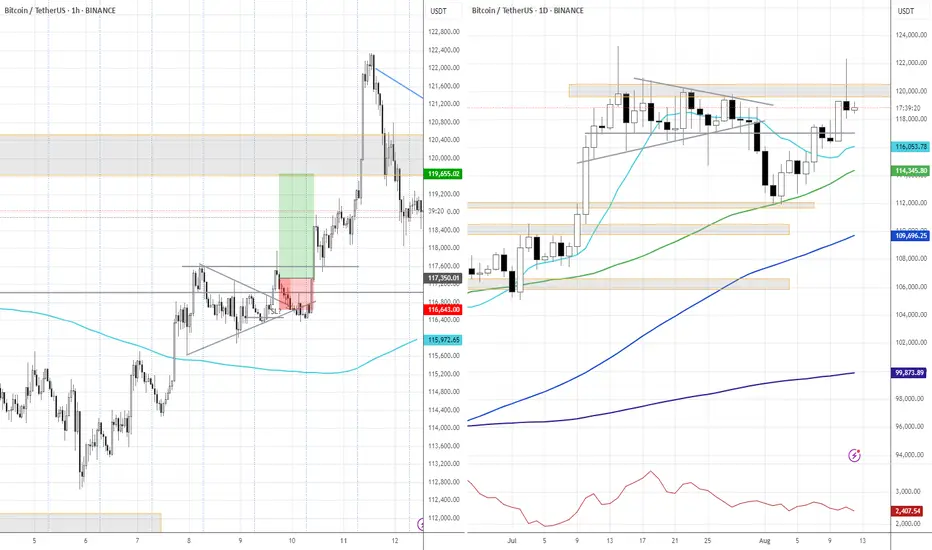
BITCOIN I Daily CLS I KL OB in the discount - ATH comingYo Market Warriors ⚔️
Fresh outlook drop — if you’ve been riding with me, you already know:
🎯My system is 100% mechanical. No emotions. No trend lines. No subjective guessing. Just precision, structure, and sniper entries.
🧠 What’s CLS?
It’s the real smart money. The invisible hand behind $7T/day — banks, algos, central players.
📍Model 1:
HTF bias based on the daily and weekly candles closes,
Wait for CLS candle to be created and manipulated. Switch to correct LTF and spot CIOD. Enter and target 50% of the CLS candle.
For high probability include Dealing Ranges, Weekly Profiles and CLS Timing.
“Adapt what is useful. Reject whats useless and add whats is specifically yours.”
David Perk aka Dave FX Hunter
💬 Don't hesitate to ask any questions or share your opinions
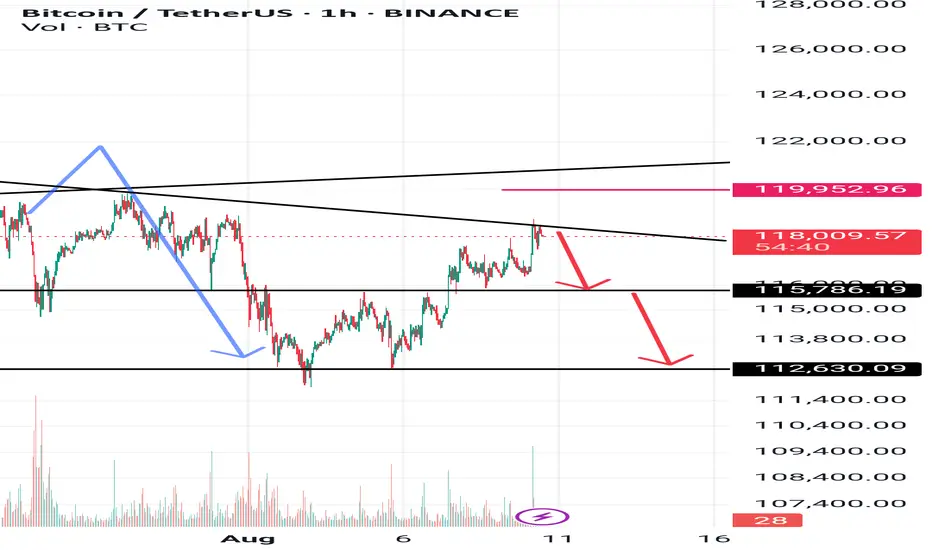
Analysis no 75 btc 1hWelcome to King BTC. The price of Bitcoin is expected to move towards 115,700 with a stop of 119,950 and a second target of 112,700. This is just a possibility.
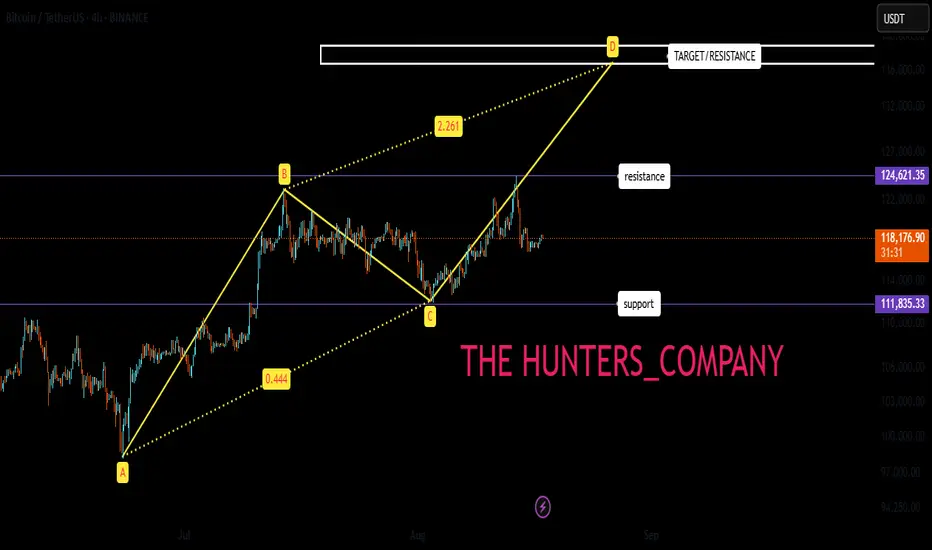
What will happen to Bitcoin in the end?Hello friends
Bitcoin has made a correction in this 4-hour timeframe after its rise and is now in a range. Considering the waves formed, it is expected to move upwards and form wave D if the important resistance is broken by the buyers.
The price may remain in this range for a while, so be patient.
Now, for a safe entry, we can let the resistance or support be broken validly and then enter.
The specified price range can be our target and it makes sense to take profit in that area.
BITCOIN THE price action is not looking good for buyers ,after the early rejection from the supply roof. ,but at the moment the demand floor on 4hr is broken and we will watch for the ascending trendline connecting from may 2025.
stay cautious of the current position ,until we have a clear breakout for forward guidance ,we can go up or down .
wait for clarity
manage your risk and capital
#bitcoin

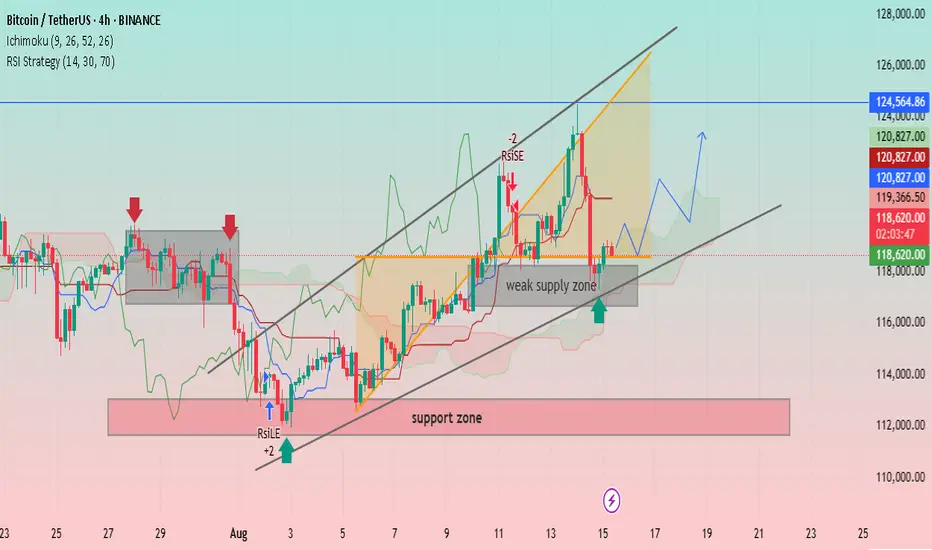
BTC/USDT: Bullish Momentum and Key Support LevelsUptrend Channel: The price is trading within an ascending channel, denoted by two parallel black trendlines. This suggests a bullish trend is in play.
Support and Resistance:
A significant support zone is identified between approximately 112,000 and 114,000 USDT.
A weak supply zone is marked around 118,000 USDT. The price has recently tested this area and found some support.
A strong resistance level is visible at approximately 124,564.86 USDT.
Indicators:
Ichimoku Cloud (9, 26, 52, 26): The price is currently trading above the cloud, indicating a bullish sentiment. The cloud itself appears to be thin and slightly bullish, suggesting potential for continued upward movement.
RSI Strategy (14, 30, 70): The Relative Strength Index (RSI) is used as a strategy, with a "RSILE" signal (likely "RSI Low Entry") marked with a "+2" and a red arrow, suggesting a potential buy signal near the support zone in early August. A "-2" signal is marked near the top of the channel, indicating a potential overbought condition or reversal signal.
Price Action and Projections:
The price recently experienced a sharp decline from the upper trendline, indicating profit-taking or resistance at that level.
The price is currently near the lower trendline and the "weak supply zone," which appears to be acting as support.
A potential future price path is drawn with a blue arrow, suggesting that the price may consolidate or bounce off the current support area and move higher towards the upper boundary of the channel.
Another potential path is drawn with a red arrow, showing a possible further drop towards the lower trendline before a bounce.
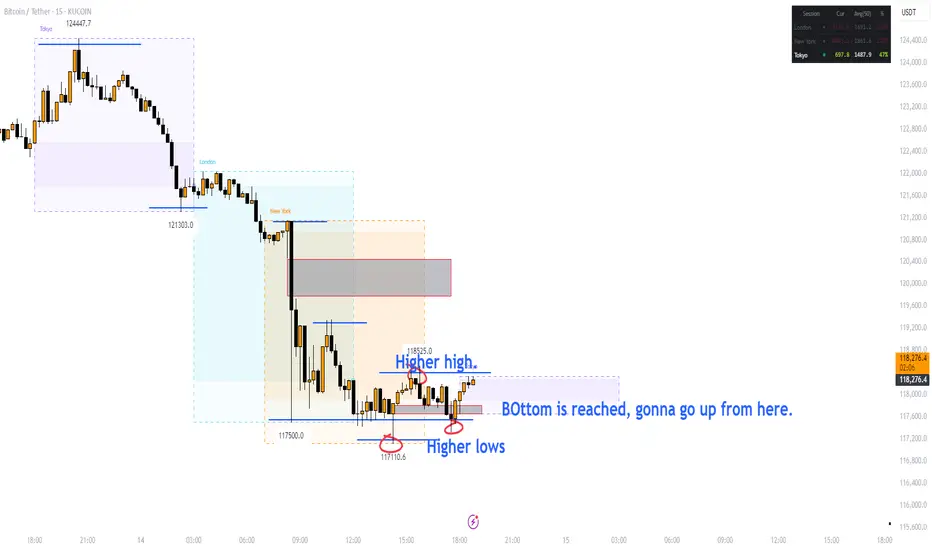
BOttom reached up from here BTCYes, I believe BTC has reached the local bottom, now we go back up, 121, 124, it's a wrestling match between buy and sell, but we gotta take our chances and not be afraid, and be flexible to switch between bearish and bullish when the charts show you the way forward. Get it? Peace out.
TCK.
BTC | Swing Plan UpdatePrice failed to break out above 1D supply and sharply rejected, losing key 4H demand at $117,300.
HTF demand at $109,000 (1D FVG + BOS + S/R) is the next major area of interest—this is where I’ll look for fresh swing setups if the market flushes further.
No need to rush new positions until a clean setup prints or levels are reclaimed.
Plan:
Wait for price to test $109,000 zone before considering a swing long.
Only consider LTF scalp longs if we reclaim the 4H BOS at $118,300.
Stay flat until high-probability entry, let the market show its hand.

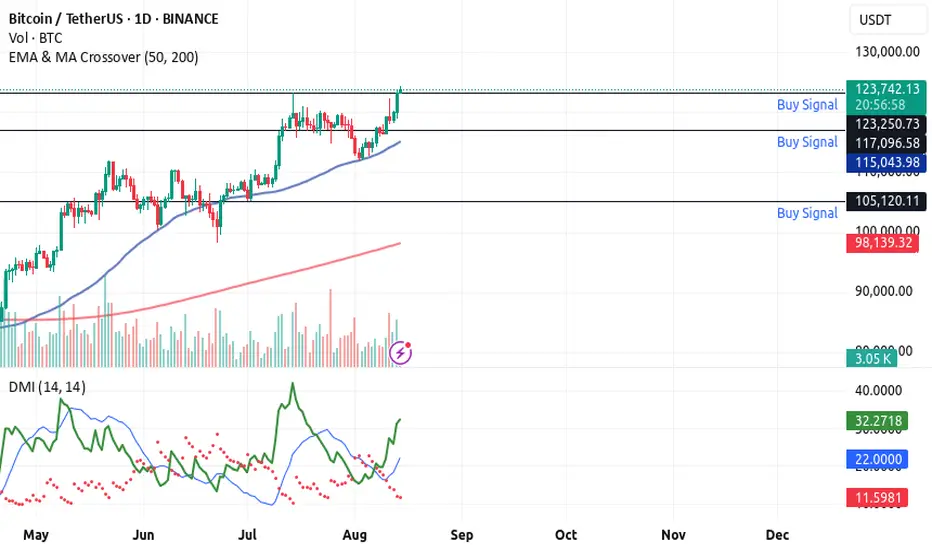
Bitcoin And The 3 Step Rocket Booster StrategyIf you think Bitcoin is going to a new High and i wont comment on it, you have another thing coming.
There's is no way am going to watch bitcoin go up and not comment.This is the right time for you to see the light
of capitalism.
And of course this is the right to introduce to you
the rocket booster strategy.
This strategy has 3 steps as follows:
1-The price has to be above the 50 ema
2-The price has to be above the 200 ema
3-The price should gap up
You can see the gap up from the new high.
This point you will experience the fear of not taking action
But this is the time to take action do it now.
Rocket boost this content to learn more.
Disclaimer:Trading is risky please learn risk management
and profit taking
strategies
also feel free to use a simulation
trading account before you
trade with real money
BTC Buy / Long SetupWait for the entry till London Session, and Hold the trade, Must use SL with proper risk management.
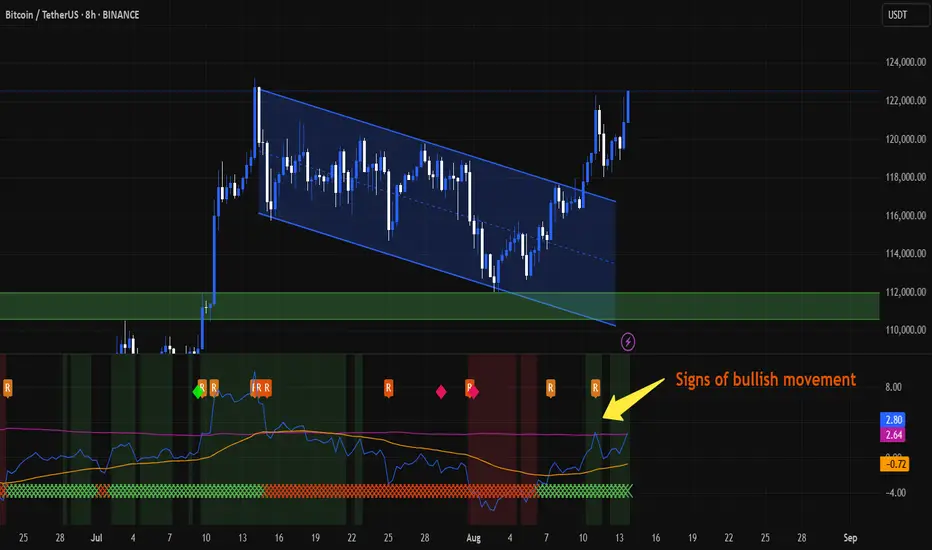
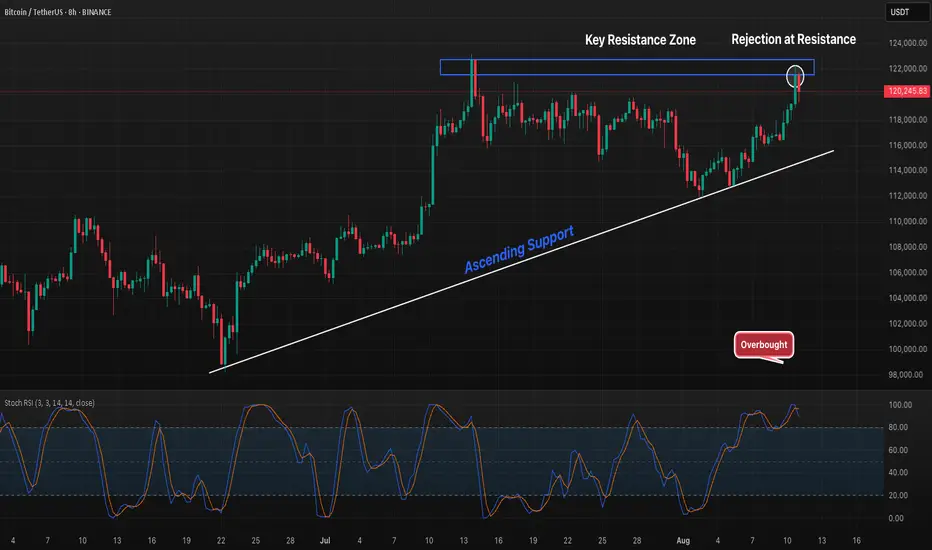
BTC 8H Ascending Support Test, But Will Resistance Reject Again?Bitcoin has been climbing along a steady ascending support line, now testing a key resistance zone around $122K that has previously acted as a strong rejection point. The Stoch RSI is deep in overbought territory, suggesting potential short-term selling pressure. A breakout above this resistance with strong volume could open the door to further upside, while another rejection may send price back toward the trendline for a retest.
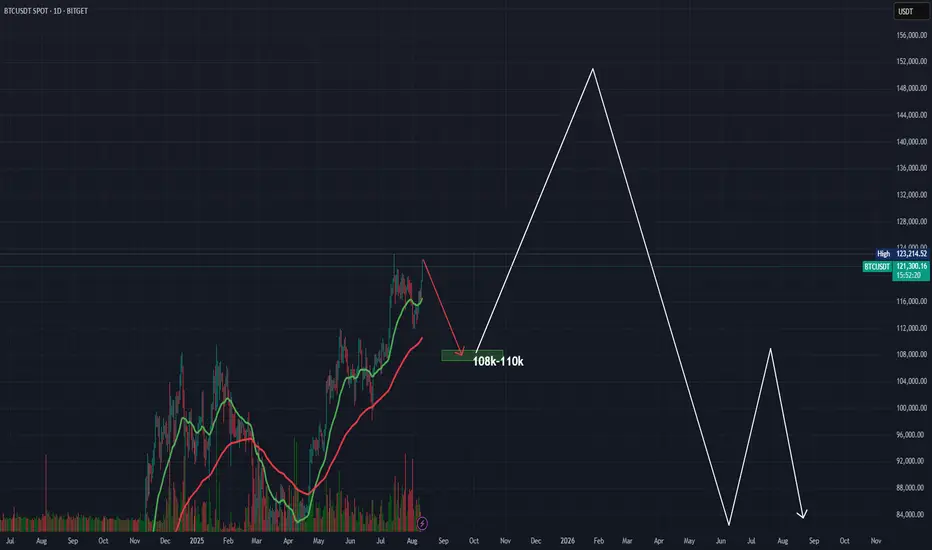
BTC Plan 2025 - 2026BTC is making the double top pattern and GANN pattern. I am expecting it down to 108k-110k target in play. After hitting this target, it will bounce back to 135k-155k target for wave 5 to complete this bull market cycle.
lets wait and play.
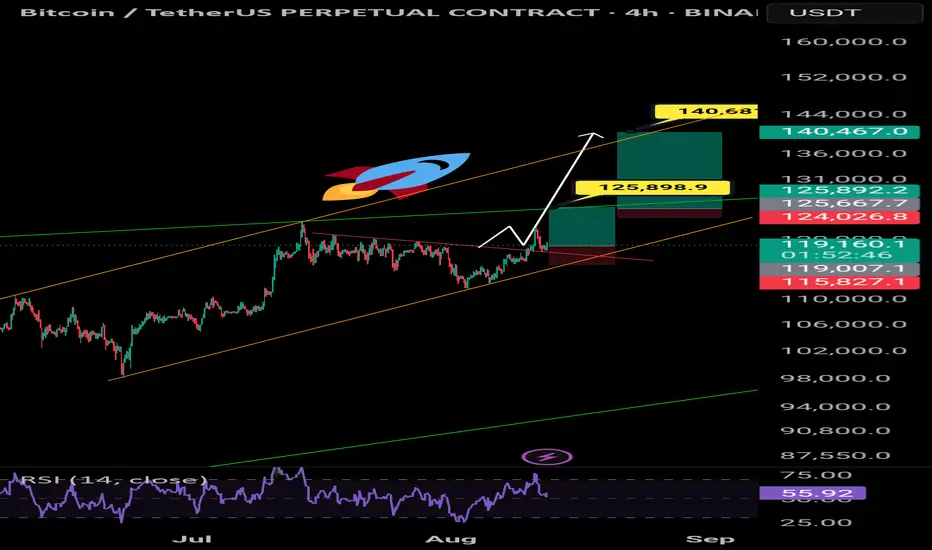
BTCUSDT 111k first then UPHi fellow traders,
Here’s my current BTCUSDT view on the 4H chart, based on Elliott Wave principles.
After a corrective structure, we’ve seen a strong bounce, and price is now approaching a key area of interest. I’ve marked the zones I’m watching for potential buys and sells:
🟨 Lower box: Potential buy zone if price pulls back with a corrective structure.
🟨 Upper box: Area of interest for taking partials or looking for potential short setups, depending on how price reacts.
If momentum continues, we could see BTC pushing into the 125K region, which aligns with fib extensions from previous swings.
As always, I’m waiting for confirmation before making any entries.
Let me know what you see on your end!

Bitcoin Overall: look for 9 wave impulseThere has been no retracement within the current price range. As a result, this is looking very much like a classical Elliot wave impulse. This one should have nine waves before another corrective phase.
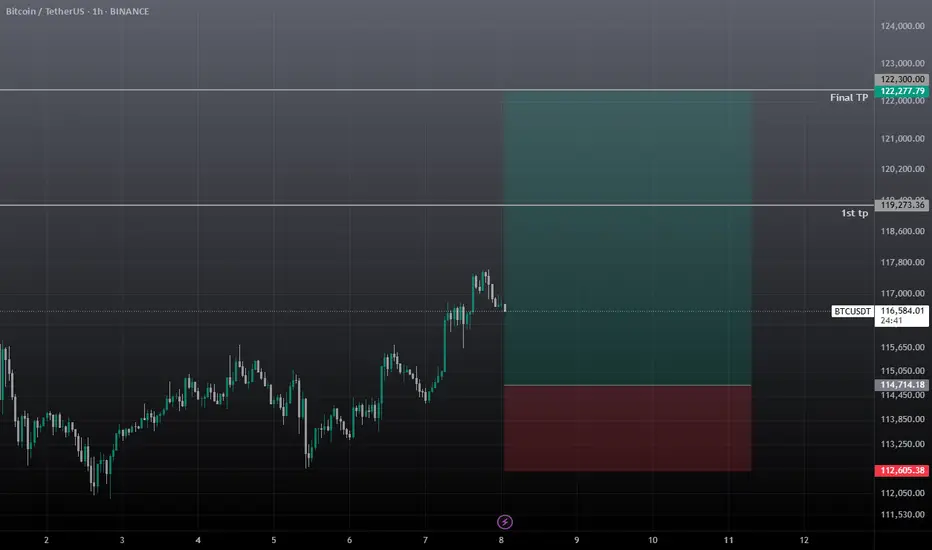
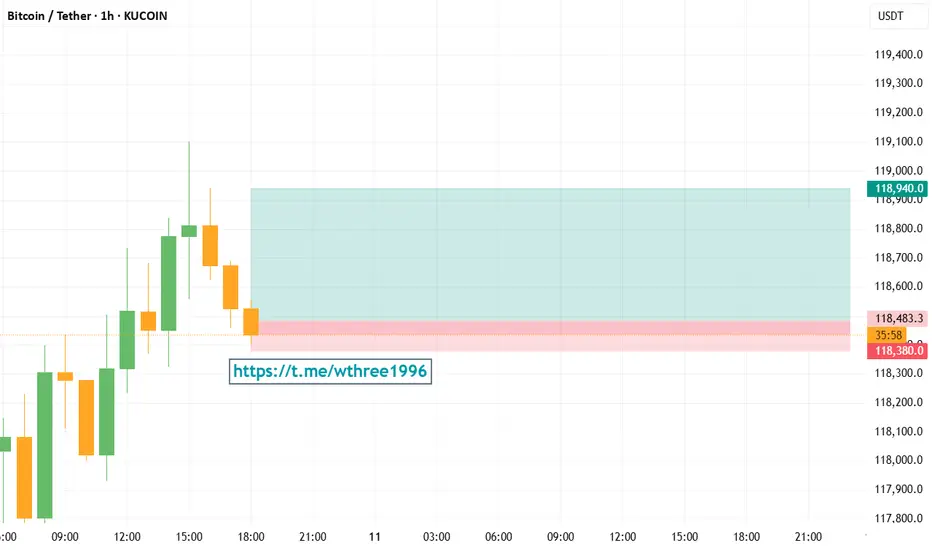
BTCUSDT LONG- Signal: LONG
- Entry: BTCUSDT 118,460 ~ 118,500
- Take Profit: 118,940 / Stop Loss: 118,380
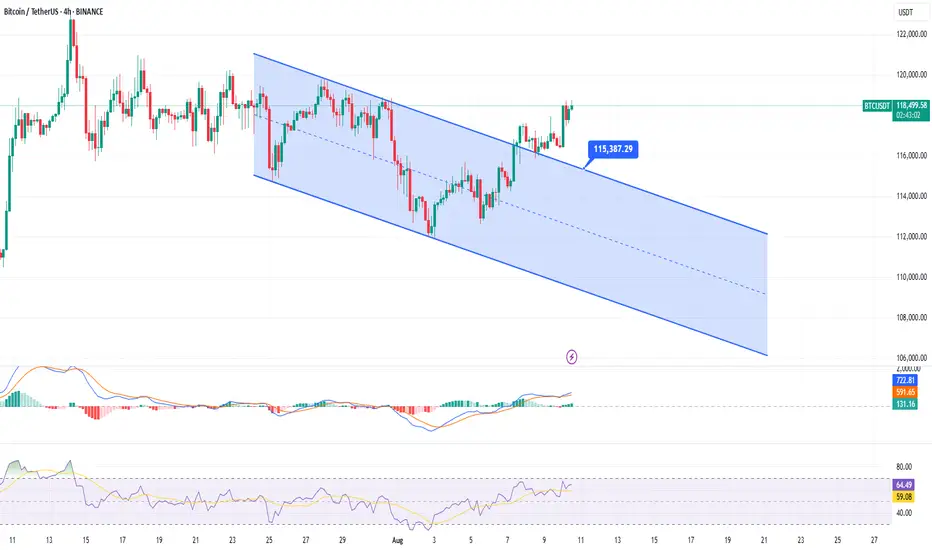
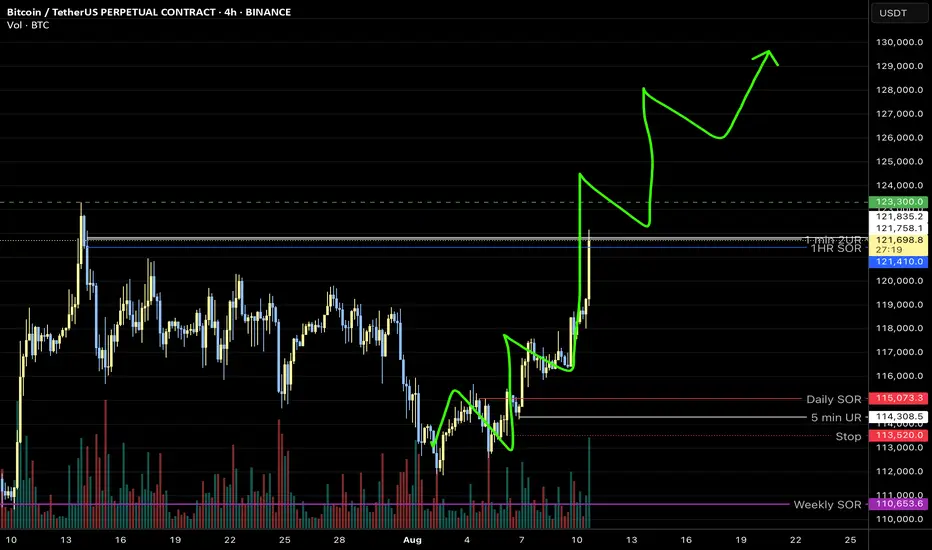
BTCUSDT 4H: Descending Channel Break—115.4k Retest or 120k Run?BTCUSDT (BINANCE) – 4H
Thesis : Price has broken out of the descending channel (7/25–8/10). Holding above the upper boundary ~115,400 suggests a shift from corrective structure to potential trend continuation higher. A clean retest may offer the better R:R.
Key Levels
• Resistance : 119,200–120,000; 121,500–122,000; 123,800–124,500
• Support : 117,200–116,500; 115,400 (channel top / breakout line); 113,000; 111,000
Momentum/Signals
• MACD is above zero with expanding lines; histogram positive (could cool near resistance).
• RSI ~65 on 4H, rising yet not overbought—room higher, but prone to pullback if 70+.
Trade Ideas
• Long on retest : Look for acceptance above 115,400–116,000 after a pullback (wick + strong 4H close).
– Invalidation : 4H close back inside channel <115,400.
– Targets : 119,500–120,000 (T1), 121,500–122,000 (T2), 124,000 (T3).
• Breakout continuation : If price closes >119,200 with rising volume, consider momentum long.
– Invalidation : 4H close <118,200.
– Targets : 120,000 (T1), 121,500–122,000 (T2).
• Contrarian short (only if failed breakout) : 4H close back below 115,400 and midline rejection.
– Targets : 113,000 (T1), 111,000 (T2).
– Invalidation : back above 116,300.
Risk Management
• Size for 1–2% account risk. Wait for 4H candle confirmation; avoid chasing into 120k supply.
• Weekend liquidity often creates wicks—plan entries around closes, not intrabar noise.
Context : A channel break often precedes a change of character; maintaining higher lows above 115.4k keeps the bullish case intact. Re-entry into the channel would negate.
Disclaimer : This is an analysis, not financial advice. Manage your own risk.