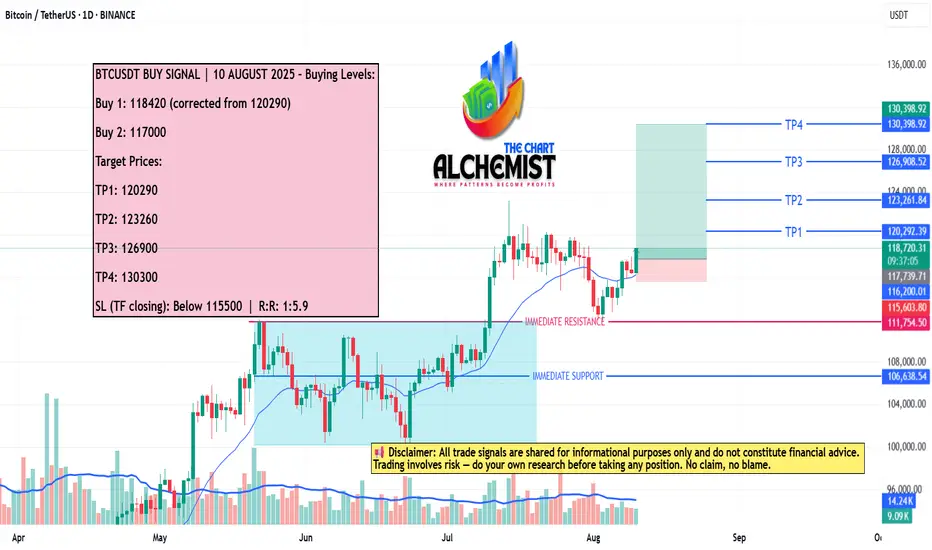
BTCUSDT BUY SIGNAL | 10 AUGUST 2025 BTCUSDT BUY SIGNAL | 10 AUGUST 2025
We previously gave a buy call for BTCUSDT, which achieved all its targets. The coin had consolidated in a bull flag pattern, retested the breakout level at 111880, and then moved upward. We now expect continued bullish momentum towards multiple quantified displacement targets.
USDTBTC trade ideas
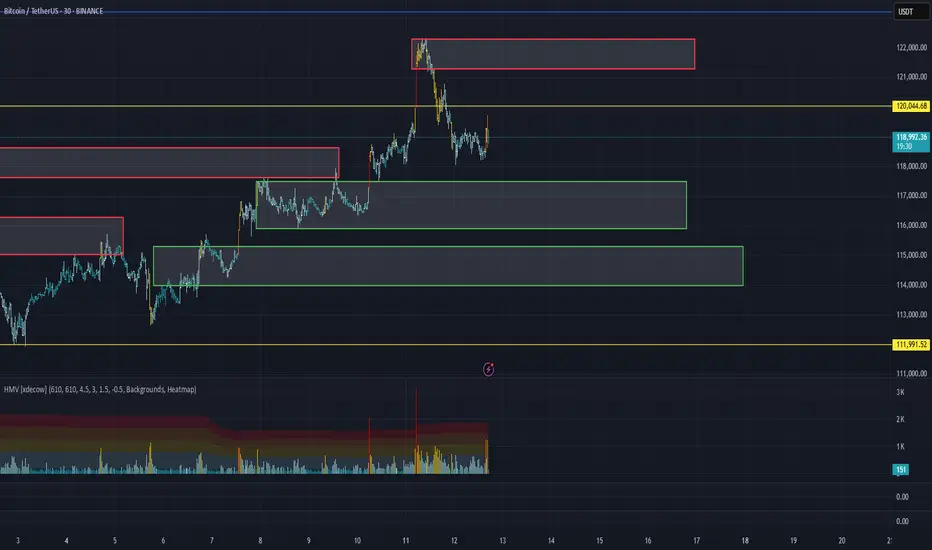
BITCOIN INTRADAY PERSPECTIVE BITCOIN IS on hold awaiting a breakout for forward guidance ,we cant force the market, let it react and as hunter i look for risk to reward .if its small, i ignore the trade. For now wait .
if we get a buy confirmation the reward is high and if we get a sell confirmation the reward is higher. due to heavy bearish order from the supply roof on the candle close line chart.
think like a hunter ,a hunter save bullet for a big animal
liquidity is everything, protect it and wait on timing and strike
GOODLUCK
BYE

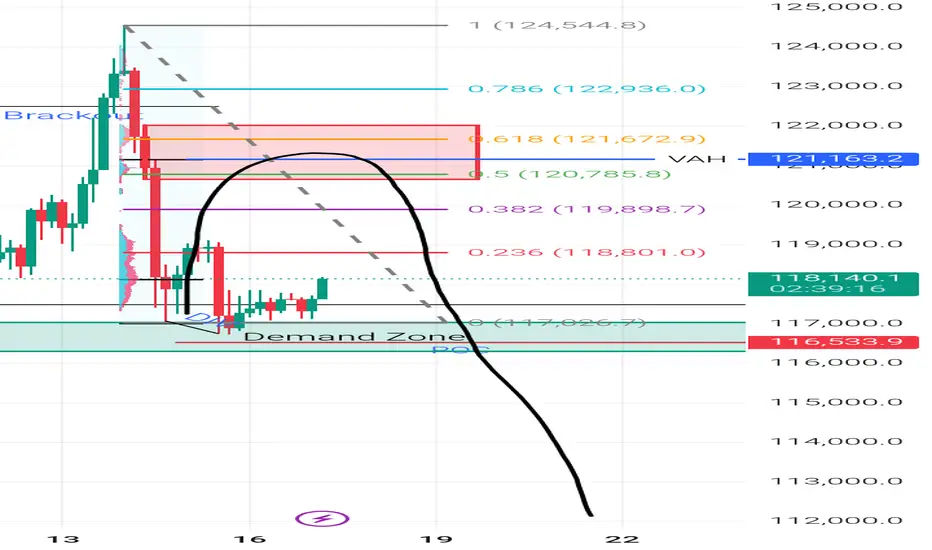
BTC_USDT 4H Possible Scenario Expecting BTC will Rejecte From 120000-121000 Range. Keep Watching market to catch the best trade.
HAPPY TRADING 🥳
BTCUSDTBullish Divergence
Expecting it will break LH and start upTrend.
Taking Entry on break of LH and placing SL below LL
R:R=1:1 can ride the trend too
BTCUSDT Quick Update: Shakeouts at $125k✅After the recent retest of $122-125k, BTC has fail to get a decisively move above $125k.
The 2D macd had temporally flipped positive. However, because of the current shakeouts from $124.5K, the 2DMACD has gone back negative.
This means a strong upside volatility will be needed to force the 2Dmacd to maintain it bullishness.
As usual, this short term short pullback is not an indicative of a TOP as the Bi-monthly and Q are still suggesting bullish uptrend (Explain in the video).
🟡Therefore, within this trading range of 125-112k zone, the supports are
118-117k & 113-112K.
Will directionally look for ~$130k (1.414extension as explain in recent videos) as the next take profits zone.
🔵Will keep an eye on the D macd as it is still positive. If it flips negative, will reassess.

BTC/USDT Analysis — Buyer Weakness
Hello everyone! This is the trader-analyst from CryptoRobotics with your daily market analysis.
Yesterday, Bitcoin finally moved into a correction after forming resistance at $121,500–$122,300. There was no reaction at the nearest support around $120,000 (push volumes). Only at $119,000 did buyers attempt to step in — the delta suddenly turned positive — but for now, all buying attempts are being absorbed.
The scenario is currently highly mixed: on the one hand, wave analysis shows we are still in a strong bullish trend; on the other, volume spiked sharply at the top and is being positioned for shorts, while there was also no clear defense at support.
At this stage, we expect further correction either from current levels or after a retest of ~$120,000 (mirror zone). After that, we will watch for the buyer’s reaction at the lower support zone. This scenario will be invalidated if $120,000 is broken without any defense from sellers.
Buy Zones:
$117,500–$116,000 (accumulated volumes)
$115,300–$114,000 (accumulated volumes)
Sell Zones:
~$120,000 (mirror zone)
$121,500–$122,300 (volume zone)
This publication is not financial advice.
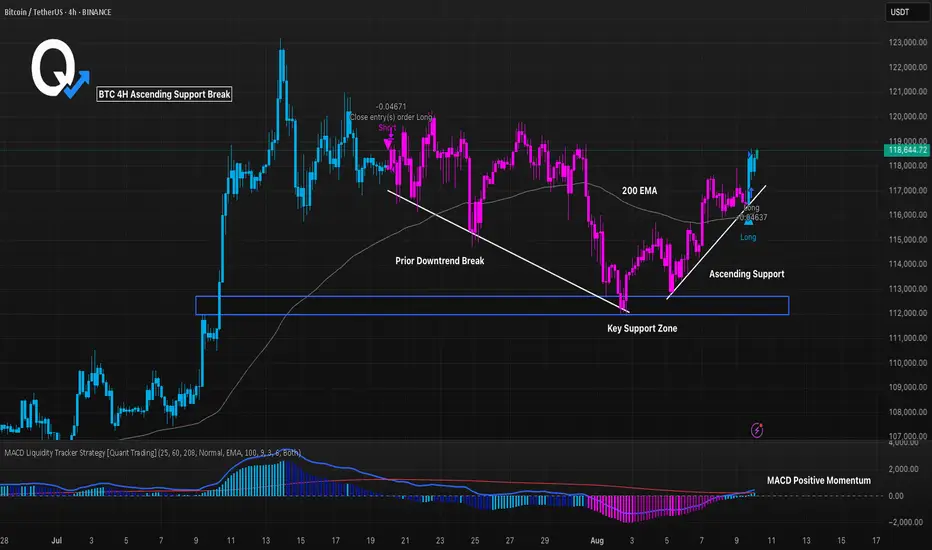
BTC 4H Ascending Support Break, Can Momentum Push Higher?BTC broke its prior downtrend and is now riding an ascending support line. Price remains above the 200 EMA and has reclaimed a key support zone. MACD histogram has flipped positive, showing building bullish momentum. A sustained hold above the trendline could open the path toward higher levels, but a break back below support would weaken the structure. Monitoring reaction near $118.5K for confirmation.
BTC – Bullish Breakout in SightBTC – Bullish Breakout in Sight
Bitcoin recently completed a bullish harmonic pattern near 112K, and the reaction was strong—showing that buyers stepped in around that level.
In just two days, BTC climbed by about 3.5%, reaching 115.7K—and it did so with relatively low trading volume, which highlights quiet but steady buying interest.
Right now, price is pausing between 113.7K and 115.7K, forming a possible accumulation zone.
If momentum picks up again, BTC could launch another bullish move toward:
🔹 116.8K
🔹 119K
You may find more details in the chart!
Thank you and Good Luck!
PS: Please support with a like or comment if you find this analysis useful for your trading day

bitcoin the breakout of the supply roof will be watched .if we have a sustained buy pressure we may hold on the lower level buy zone and target 123k current all time high and print a new all time high.
trading is 100% probabilty.

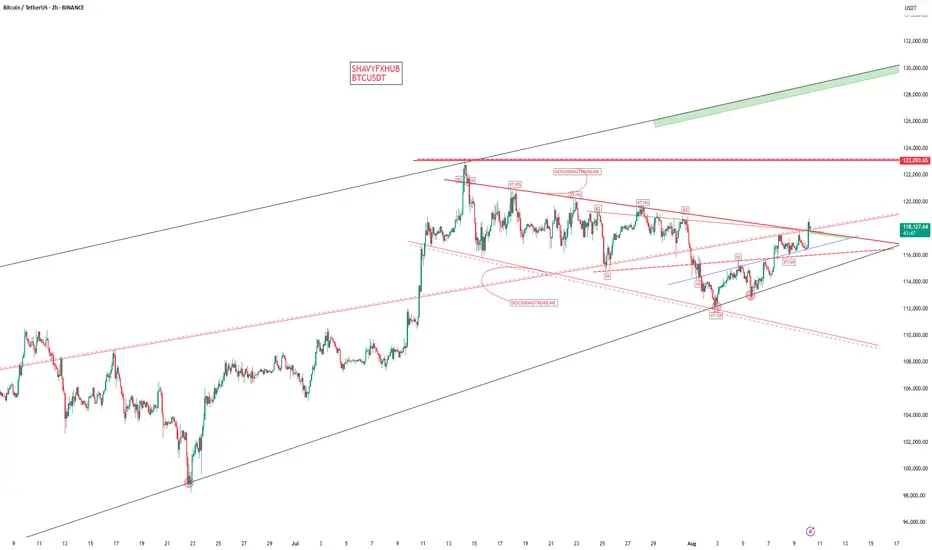
BITCOINBITCOIN ,THE STRUCTURE ON 4HR provided an ascending trendline and we have seen buyers keeping that dynamic support for buy .
we will monitor the current supply roof breakout for better buy confirmation after seeing a 2hr ascending trendline cross providing a support that took us to 118k if correction into 116-117k hold and the broken supply becomes demand than 123k all time high retest is on the desk.
trading is 100% probability.
manage your risk.
#btcusdt #bitcoin #tbc #crypto
BITCOIN WATCH the price action and manage your risk.
the inflow of liquidity is pushing price to retest the current all time high
#btc #bitcoin #crypto

BTC 1H Analysis – Key Triggers Ahead | Day 6💀 Hey , how's it going ? Come over here — Satoshi got something for you !
⏰ We’re analyzing BTC on the 1-hour timeframe .
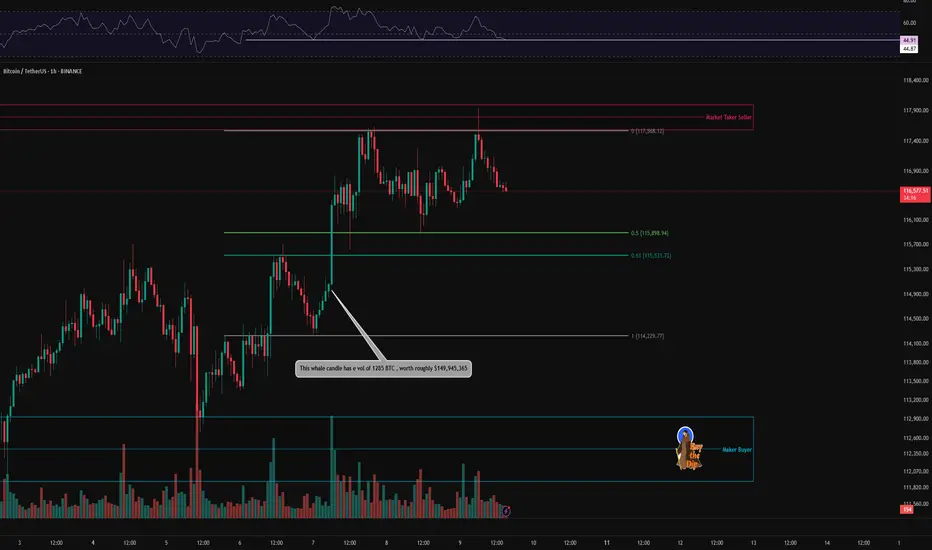
👀 On the 1-hour timeframe, Bitcoin rebounded from $114,200 after heavy whale buying. It broke through the $115,530 zone and moved toward its resistance at $117,600, but was rejected twice by strong seller tickers in that area. It is now moving toward its current support levels .
🎮 Key Fibonacci zones to watch are the 0.5 and 0 levels. A breakout of these areas can trigger potential long or short entries, making them valuable as breakout triggers .
⚙️ The important RSI pivot level is 44.87; losing this level could lead to a further correction .
🕯 Trading volume and transaction count are rising, suggesting the possibility of another “Bitcoin season.” Large institutions have been buying at the lows, increasing their positions each time. ETF data has turned highly positive, indicating strong recovery potential and attracting more risk capital .
🔔 There are two alert zones: one at $117,500 and another at $116,000. Setting alerts here can help you better track price behavior .
📊 USDT.D has broken above its range box , A break of the current zone could allow Bitcoin to push higher .
🖥 Summary : After its recent pump, Bitcoin is facing resistance from seller tickers and is trying to break through this zone. As long as BTC stays above $116,000, there is potential for another attempt to set a new high .
❤️ Disclaimer : This analysis is purely based on my personal opinion and I only trade if the stated triggers are activated .
BITCOIN BTC BITCOIN ,THE STRUCTURE ON 4HR provided an ascending trendline and we have seen buyers keeping that dynamic support for buy .
we will monitor the current supply roof breakout for better buy confirmation after seeing a 2hr ascending trendline cross providing a support that took us to 118k if correction into 116-117k hold and the broken supply becomes demand than 123k all time high retest is on the desk.
trading is 100% probability.
manage your risk.
#btcusdt #bitcoin #tbc #crypto

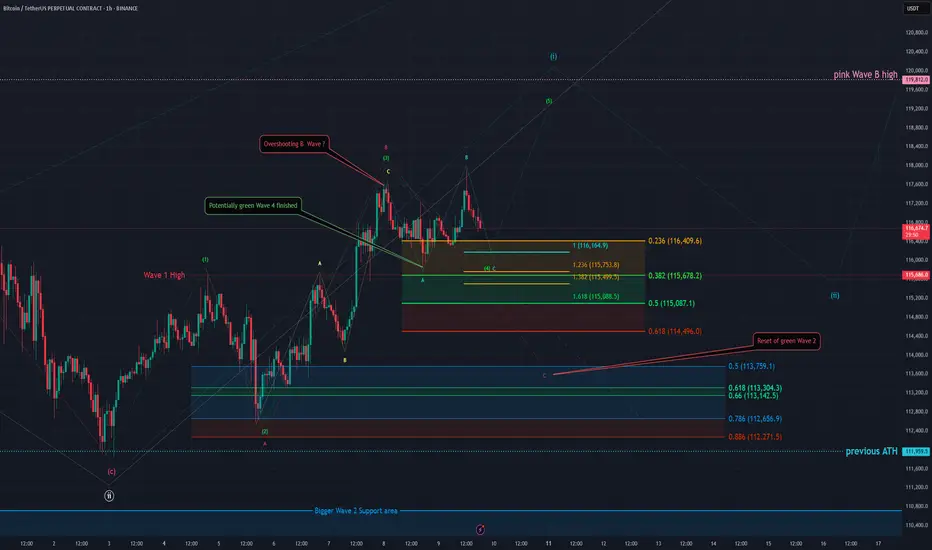
BTC - 1H Elliott Wave Analysis - 09.08.25Greetings and welcome to our next update for our Elliott Wave Count for Bitcoin.
The case is pretty much the same as yesterday in our last update so we'll try to keep it shorter today but feel free to check out our last analysis if you're interested in more details!
It'll be linked below in the notes :)
It is possible that we finished the green Wave 4 already and started moving up in the green Wave 5 but we think it is rather unlikely as the move up looks like a three wave move which indicates that it is corrective. It looks more like the correction extends a bit in the turquoise ABC a possibility we already mentioned yesterday.
We got the turquoise A in and the B was an overshooting Wave B and it seems we started working on the C Wave down. The targets for the turquoise Wave C are the 1 to 1 FIB at 116'164 USD, the 1.236 FIB at 115'753 USD, the 1.382 FIB at 115'499 USD which would also be in confluence with the 0.382 FIB of the Wave 4 support area and finally the 1.618 FIB at 115'088 USD which is right on top of the 0.5 FIB of the Wave 4 support area.
Keep in mind it still could be the bigger ABC displayed in red which would reset the green Wave 4 but we think the green count is more likely for now. First indication would be breaking the green Wave 4 support area.
Thanks for reading.
Would really recommend to check out the last analysis too for a better in depth view of the count and scenarios. :)
NO FINANCIAL ADVICE.
TradeCityPro | Bitcoin Daily Analysis #145👋 Welcome to TradeCity Pro!
Let’s get into Bitcoin analysis. Yesterday, Bitcoin was rejected from the zone I had mentioned, and today it will probably begin its new downward move.
⏳ 4-Hour Timeframe
In yesterday’s analysis, I told you that a pullback to SMA25 and the 0.5 Fibonacci zone was possible. That happened, and now, given the current candle, the probability of a corrective scenario has increased.
✔️ I still won’t open any position on Bitcoin and am waiting for it to exit the box between 110000 and 116000. But if certain conditions occur in the market, I might open a position inside this box as well.
✨ First of all, Bitcoin is still above the 111747 support, which is a very important support zone. As the price reaches it, there’s a chance it gets stuck there again.
📊 On the other hand, seller strength is very high, and as you can see, the RSI has been rejected from the 50 ceiling, and a red engulfing candle with very high volume is forming — all of which indicate the power of sellers.
🔽 I still stand by my opinion that as long as the price is above 110000, I won’t open a short position. But for a long position, we can move to the 1-Hour timeframe to review the trigger that has formed.
⏳ 1-Hour Timeframe
Before reviewing the triggers, there’s a very important point that explains why I currently prefer to remain without a position.
💫 Bitcoin in the HWC and MWC cycles has a very strong upward trend. Right now, in the LWC, it’s moving downward. So this Fibonacci drawn on the bearish leg doesn’t really mean much and won’t give us very strong and accurate resistances.
🔍 On the other hand, the LWC is moving against the higher cycles — meaning the higher cycles are stronger. That’s why shorting doesn’t make sense, since it’s against the main market cycle.
🔑 But also, since LWC has gained downward momentum, long positions — if not set with wide stop-losses — will likely get stopped out, because this momentum may cause small downward legs that hit stop-losses.
👀 So opening a long position is also difficult right now, and that’s why I say it’s better to wait for the price to move out of the 110000 to 116000 range, and then enter a position more comfortably.
🎲 If the price goes below 110000, we’ll receive the first sign of a trend reversal in the MWC, and then we can open short positions. And if it goes above 116000, LWC becomes bullish again and the continuation of the uptrend can begin.
Let’s now go to the triggers:
📈 The trigger we have for a long position is 115327 — an important ceiling that overlaps with the 0.5 Fibonacci level and has been touched several times.
☘️ If we get another touch to this level, I myself will likely try to open a long position, and I think it’s a good entry point that’s worth the risk to anticipate a breakout of 116000.
🔽 For a short position, a break below the 112205 low will start the continuation of the correction. I won’t open this position myself, but if you believe Bitcoin wants to reverse its trend, this is a very good trigger in terms of price level and you can open the position.
❌ Disclaimer ❌
Trading futures is highly risky and dangerous. If you're not an expert, these triggers may not be suitable for you. You should first learn risk and capital management. You can also use the educational content from this channel.
Finally, these triggers reflect my personal opinions on price action, and the market may move completely against this analysis. So, do your own research before opening any position.

BTC crossing key technicals DOWNIt's probably nothing, BTC dropping below 50 and 200SMAs. Again, from a historical perspective, BTC has dropped every time. Don't be left holding the bag! Berkshire is holding record cash and so are many alpha investors.
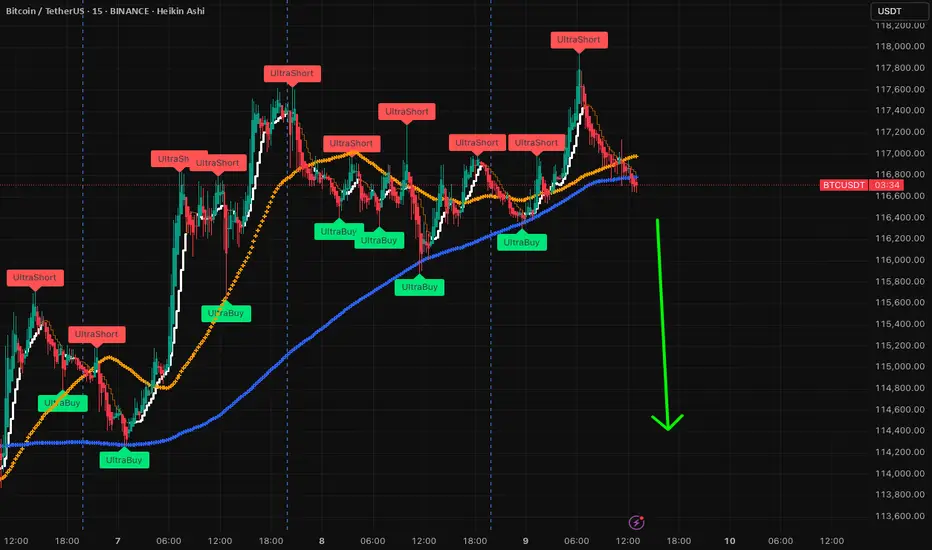
BTC ready to DUMPAre you ready for Bitcoin Dump ?
As you can see, BTC break the lower band of channel and finished it's pullback to it.
Not it's ready to go Down
WE HAVE PREDICTED EVERY MOVE OF BITCOIN - HERE IS WHAT’S NEXT!! Yello Paradisers! we have predicted every single movement on Bitcoin in the past few months, and in this video, I will reveal to you what's going to happen next with the highest probability. Again, on the high time frame chart, we are seeing the ABC zigzag, and right now, we are trading inside of the C wave. Further in the video, we are zooming into the fourth wave.
On the medium time frame, we are seeing bearish divergence that is showcasing an absorption. We are describing Heron-Chorda's target and taking a look at the channel in which the zigzag is being formed. On the low time frame, we are analyzing the Elliott Wave Theory Triple Three pattern, and on the ultra-low time frame, we are analyzing the impulse.
We are describing what kind of conformations we are waiting for. Basically, it's a five ways to the downside. Then, we will be increasing our portfolio exposure on a corrective mode wave to the upside where we will be able to create a tight risk-to-reward ratio position and a high-probability trade setup. Trade smart, trade with a professional trading strategy, be tactical, and enjoy your weekend.
Remember, don’t trade without confirmations. Wait for them before creating a trade. Be disciplined, patient, and emotionally controlled. Only trade the highest probability setups with the greatest risk to reward ratio. This will ensure that you become a long-term profitable professional trader.
Don't be a gambler. Don't try to get rich quick. Make sure that your trading is professionally based on proper strategies and trade tactics.

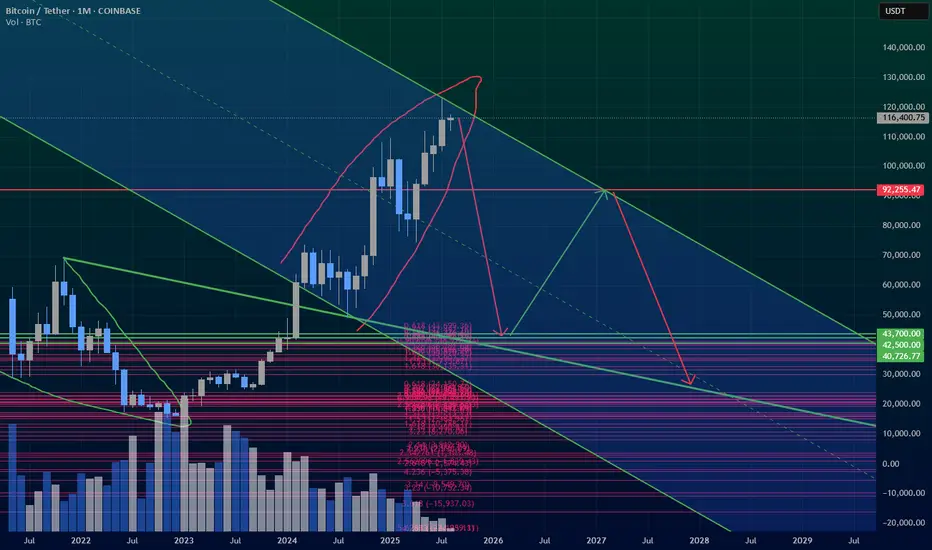
16 Year Cycle looks completeYou can refer to my chart linked below (about the "Summer Rally"), which did indeed happen.
I was skeptical the Summer Rally would actually happen, as it was a bit predictable, but there we go.
Distribution is also being seen on lower time frames.
BTCUSDT targeting 137K$ soonAs we can see market is holding strong here and soon we are looking for more rise and pump here like the green arrows on chart also if BTC now here hold strong and play some range that would be perfect and why is that?
because we should say hi to ALT season then after a years of patience and it would be time to see some of the charts of ALTs flying.
DISCLAIMER: ((trade based on your own decision))
<<press like👍 if you enjoy💚

BTCUSDTHello Traders! 👋
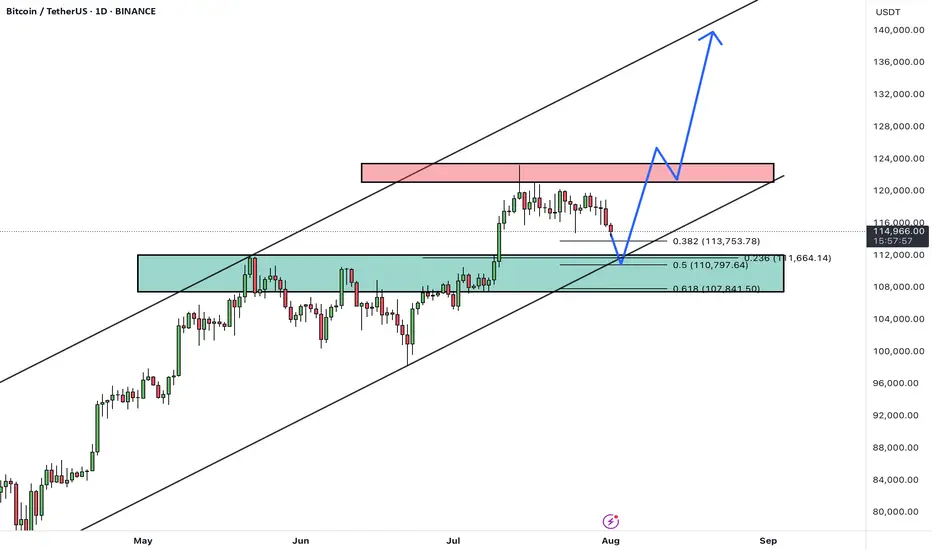
What are your thoughts on BITCOIN?
After a strong rally, BTC is currently pulling back from the 124K resistance area, heading toward a major confluence support zone between 108,000– 110,000, which aligns with:
✅ Previous breakout zone
✅ 0.5–0.618 Fibonacci retracement
✅ Lower bound of the ascending channel
This level is expected to attract buyers and act as a base for a new bullish leg.
Scenario Ahead (Main Bias):
1. Price dips into the 108–110K support
2. Bullish reversal from the zone (watch for strong reaction candles or bullish divergence)
3. Target 1: 124K (retest resistance)
4. Target 2: 135K–140K (upper channel boundary upon breakout)
BTC remains in a healthy bullish structure. Current pullback is considered constructive, and the 107–110K zone offers a high-probability long setup. Watch for bullish signals before entering.
A confirmed daily close below 107K would invalidate this bullish structure and expose BTC to deeper correction levels.
What’s your take on this setup? Do you expect a bounce from support or a deeper correction? Share your thoughts below 👇
Don’t forget to like and share your thoughts in the comments! ❤️
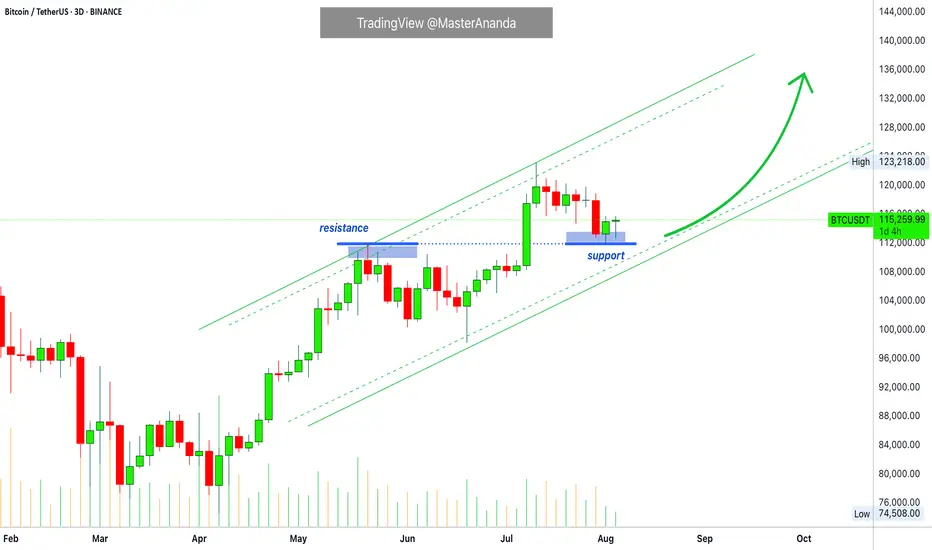
Bitcoin Update • Resistance Turned Support · TOP Altcoins ChoiceTraders hedge for a Bitcoin drop below $100,000?
Meanwhile, Bitcoin is rising trading above 115K. Resistance turned support.
The last all-time high turned out to work as support this time.
The retrace from 123,000 to 115,000 amounts to a 6.5% decline, which simply means that Bitcoin is trading at or near resistance. Staying close to resistance after a new all-time high is major signal of strength. A bearish signal would only become real if a high volume drop develops or Bitcoin closes weekly below 110,000. This isn't happening right now so the bulls win.
Are you a bull? You win.
I am a bull. I win.
👉 As Bitcoin continues bullish the altcoins market will continue to grow. Knowing this, which one is your Top Altcoin Choice ?
👉 Leave a comment with your favorite altcoin.
I will do a full analysis for you and publish in my profile.
If the chart doesn't look great, I might reply right here in the comments section.
Thanks a lot for the continued support. It is appreciated.
Let's play again.
Let's trade again.
Together we can win.
Success, profits and growth long-term.
Namaste.
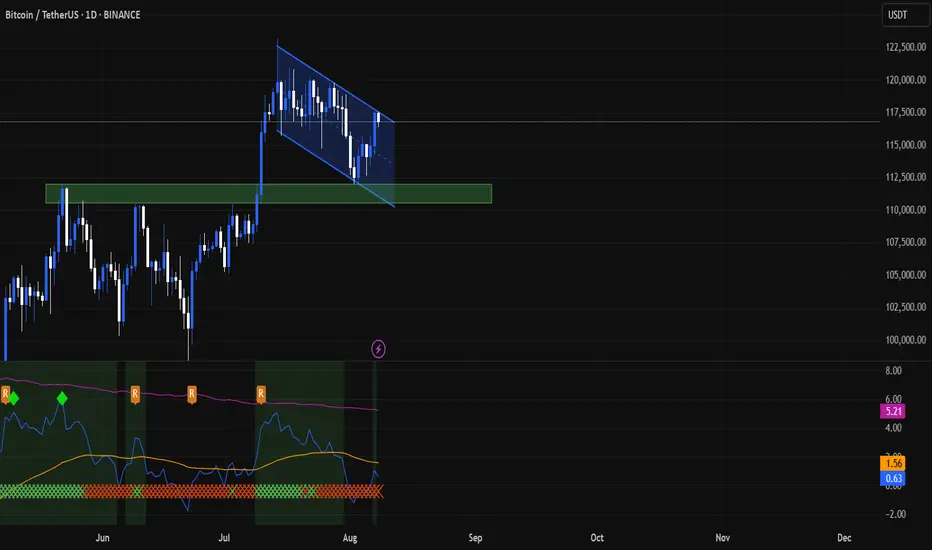
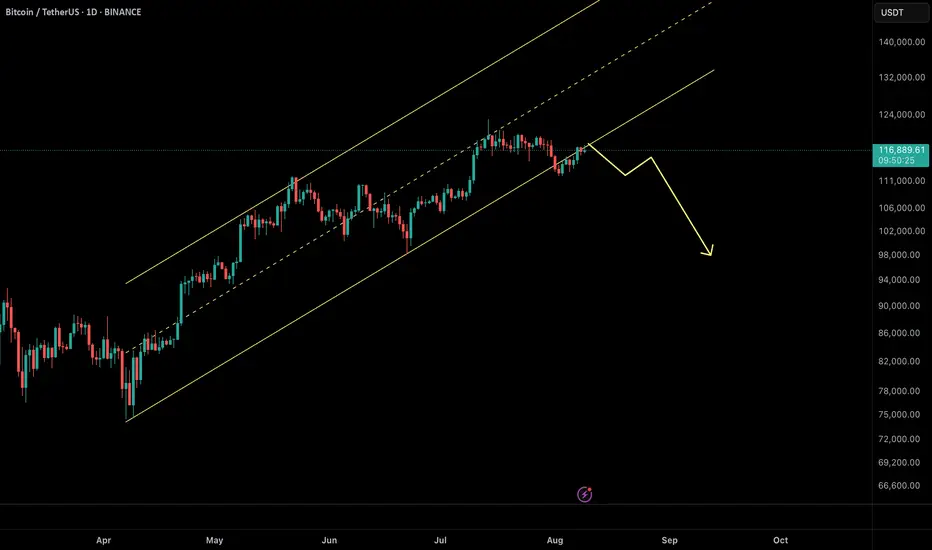
Bitcoin Daily AnalysisIn the last Bitcoin analysis, I announced a price of $113,000 for entry, after which we saw the price grow to $117,000. Now Bitcoin is at the ceiling of a descending channel (of course, money back). If the channel ceiling breaks, it could move back towards the price ceiling of $124,000. Otherwise, it could move back towards $112,000.
This analysis is not a financial recommendation. Crypto is a very risky market and you may lose some or all of your money in it. Especially futures trading.