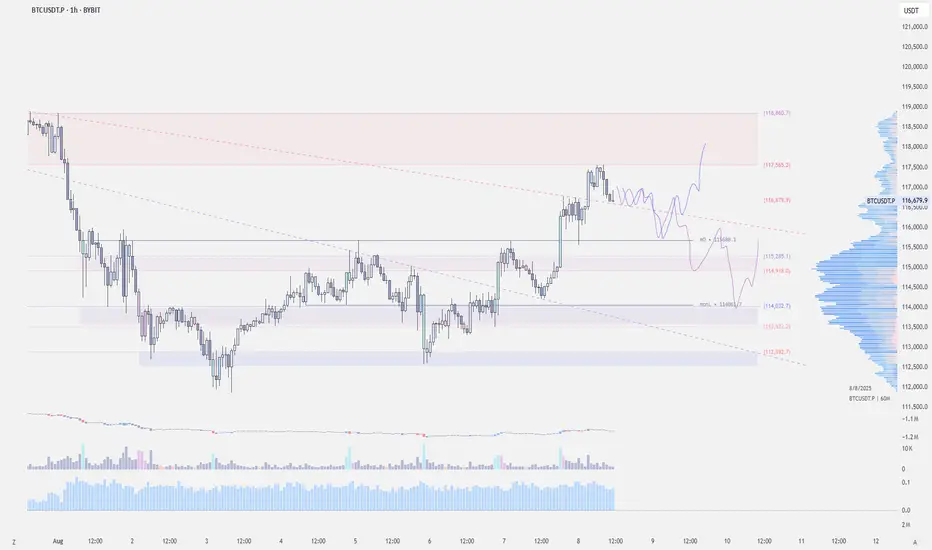
$BTC - LTF OutlookCRYPTOCAP:BTC | 1h
On lower timeframe, we want 115.6k (monthly open) to hold.
If you're currently short, might take partial profit if we bounce and break above 116.8k
Short remains safe below 116.8k. If 115.6k (monthly open) breaks, eyeing for 114.2k-113.3k (mondayLow) for long re-entry.
USDTBTC trade ideas
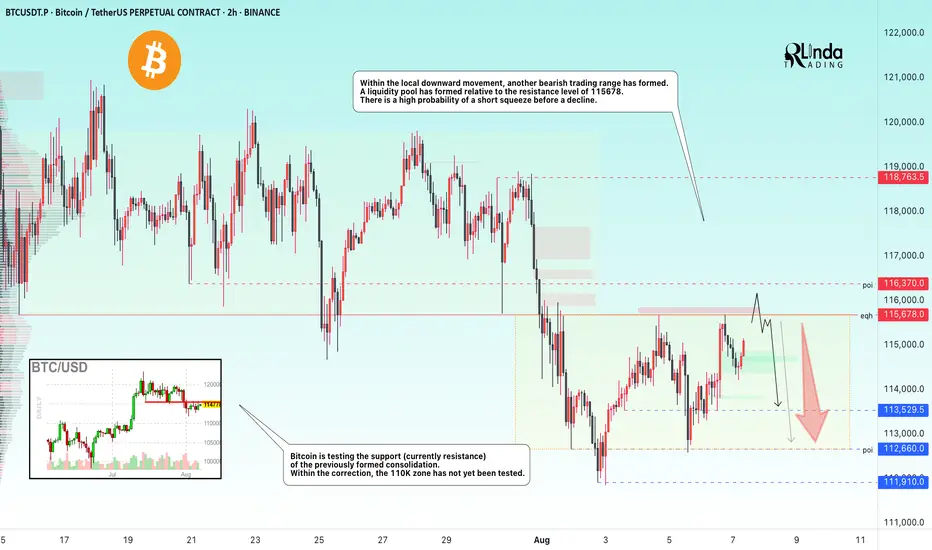
BITCOIN → Retest of resistance in the bearish trading rangeBINANCE:BTCUSDT.P is consolidating in the range of 115,600 - 113,500. The price is testing resistance, relative to which a huge pool of liquidity has formed, which bears are likely to defend quite aggressively...
Idea from July 22: expectation of a decline from 120K to 112K. Target achieved
Bitcoin is correcting on D1, the price previously broke through the support level of 115650 and formed another trading range, with the previously broken lower boundary of the consolidation acting as resistance. The market has not yet tested the zones of interest at 110K and 105K, and therefore the possibility of a further decline remains relevant. A liquidity pool has formed relative to the resistance of the trading range at 115678. There is a high probability of a short squeeze before the decline.
Resistance levels: 115678, 116370
Support levels: 113530, 112660, 110K
In the short term, I expect a retest of resistance and a capture of liquidity. If the market is unable to continue its upward momentum and returns the price below the level, a false breakout will form, which may trigger a decline to the indicated areas of interest.
Best regards, R. Linda!
BTC 1H Analysis – Key Triggers Ahead | Day 4💀 Hey , how's it going ? Come over here — Satoshi got something for you !
⏰ We’re analyzing BTC on the 1-hour timeframe .
👀 After triggering our long entry levels , Bitcoin faced increased buying volume , and the U.S . unemployment claims came in higher than expected, which was interpreted positively for the crypto market .
🔼 With rising buying volume, Bitcoin may continue moving toward higher levels and could even aim for a new local high. Our key support zones are the same trigger levels we've been watching—these are also our ideal long entry points .
⚡️ There is a strong resistance around $117,000, where taker sellers are actively selling their Bitcoin at premium prices. In order to break through this area, we’ll need solid volume inflow from both market makers and retail buyers .
⚙️ There’s no clear RSI support zone at the moment, since on the 1-hour chart RSI is already in the Overbought area and oscillating there .
📈 Long position : Be a bit patient here . Wait for Bitcoin to pull back to key Fibonacci levels , preferably around 0.236 and 0.382, and then bounce back up . Once we break above the pullback, you can consider entering a long trade .
📉 Short position : A short setup could form only if both of our marked trigger levels get stop -hunted, combined with increased selling pressure , support breakouts , and confirmation from bearish candlestick patterns.
That said — we are not looking to short right now, as there are better opportunities to catch strong long entries .
❤️ Disclaimer : This analysis is purely based on my personal opinion and I only trade if the stated triggers are activated .

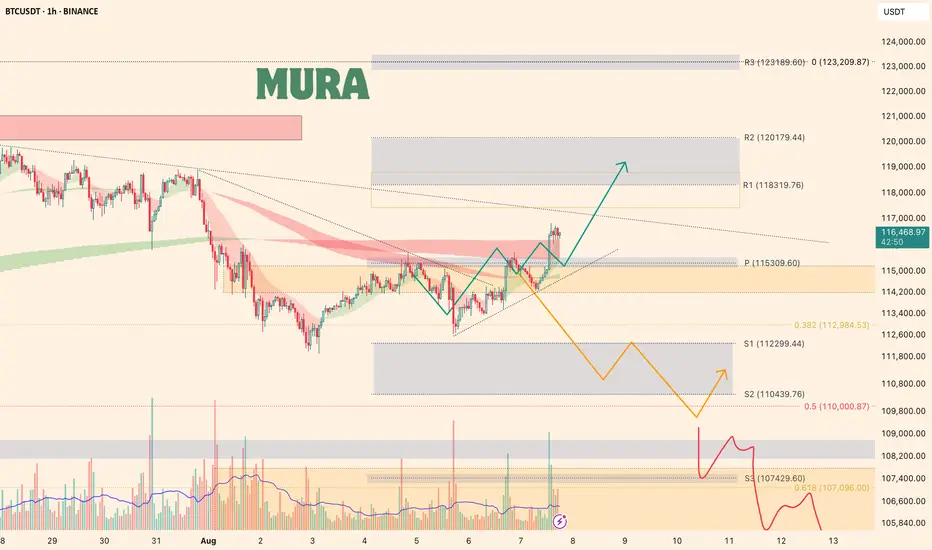
Bitcoin Market OverviewBitcoin is currently following the bullish (green) scenario. The 1H RSI is overbought, and the 4H RSI is already above 70, so I'm closely watching the price action. A local correction would be logical before a potential move up toward the resistance zone at $118,319–$120,179 .
If the price drops back below the $115,000 level, I’ll be looking for a decline toward the support zone at $112,300–$110,400 .
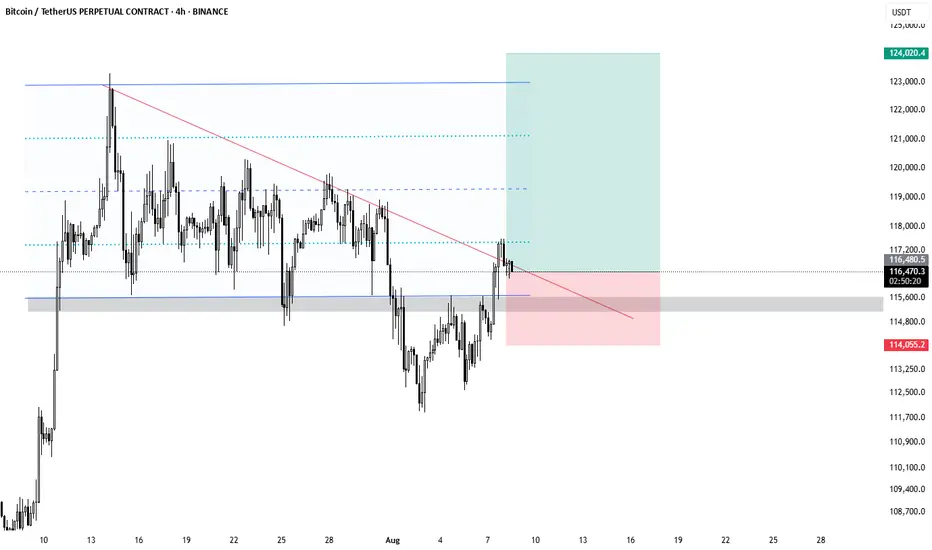
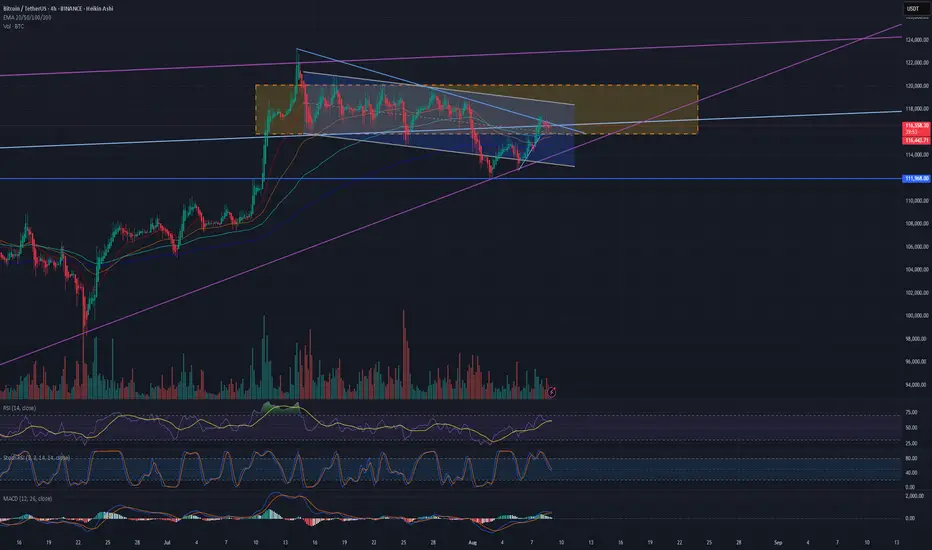
BITCOIN TRADE 07.08.2025After a correction by 10% from ATH, BTC finally closed a huge gap on CME on $114.000 level, we are ready to see another wave of growth. I was waiting for BTC to break out EMA-200 level on 4-hour timeframe, after seeing how the price was consolidating below of EMA-200 and trying to break out a few times in a row, I opened a long position on $115280. So far I'm expecting to see the price to break out the upper channel and then we can expect BTC to try to hit new ATM since there is a lot of liqudity from short traders, but for your calmness, you can completely close your position on $120.000.
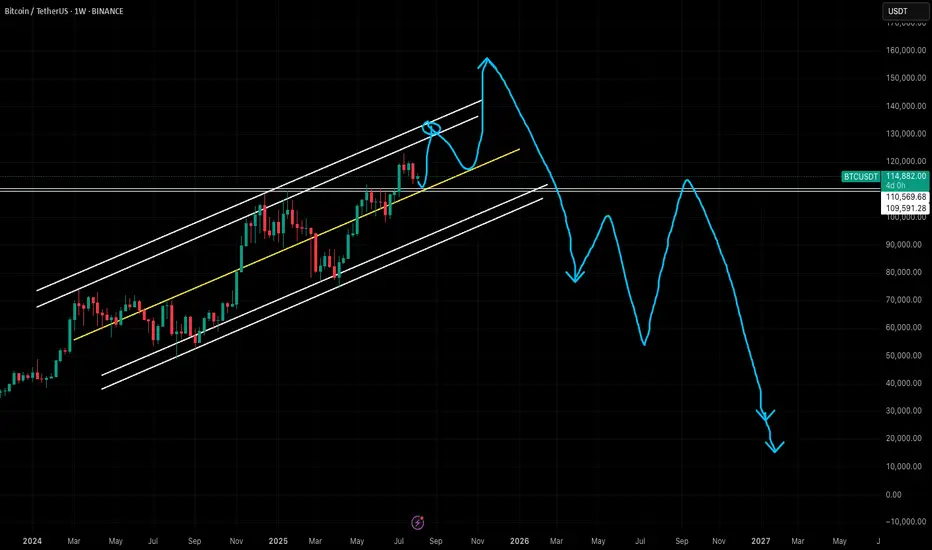
Bitcoin Analysis As Per Seasonality & PatternBitcoin Analysis As Per Seasonality & Pattern - DYOR
Expecting Top Of Bitcoin Around $150k - $160k By The End Of This Year 2025 and Right After That Bitcoin Can Start Falling After Completing Its Bull Cycle
In Next Bear Market Which I Am Expecting In Year 2026 - Potential Bottom Should Be Below $20k - In Next Bear Market Expecting Bitcoin To Take Longest Correction In History Can Around 90% Drop From Its Top
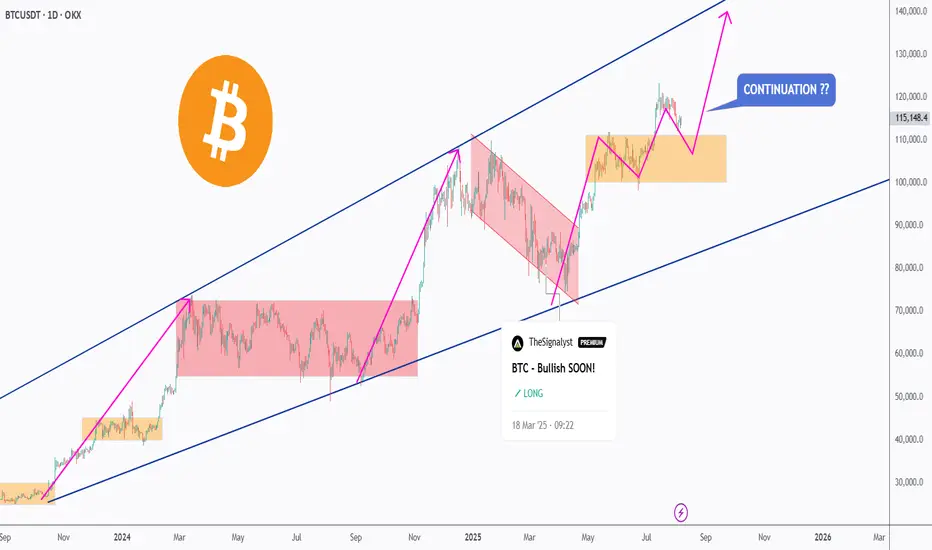
BTC Retest In Progress – Ready for Liftoff?🚀 Bitcoin has been respecting the long-term rising channel (blue) — moving in clear impulsive 📈 and corrective 📉 waves.
After each bullish leg (highlighted in pink), BTC dips into a correction (red), finds support at key demand zones 🟧, and then kicks off a new rally.
🔥 Currently, BTC is hovering near a strong demand zone around the $110,000–$113,000 area, forming a potential higher low within structure.
If this zone holds, the bulls 🐂 could regain control and push price toward the $130,000–$140,000 range — aligning with the upper boundary of the channel 📊.
💡 Continuation soon?
Let the market decide — we’re watching this zone closely for a bullish breakout confirmation ✅
💬 What’s your bias here? Are you bullish or waiting for a deeper pullback?
📚 Always follow your trading plan regarding entry, risk management, and trade management.
Good luck!
All Strategies Are Good; If Managed Properly!
~Richard Nasr
Why I'm bullish on Bitcoin!While everyone starts questioning if its over for Bitcoin, I'm bullish
Inverse head and shoulder going into 2 bull flags so far. Target is 149k'ish.
Unless I see some movements that cancel out these patterns I'm forever bullish.
Support on 112k is important to stay above if we break below and close below forget about this idea.
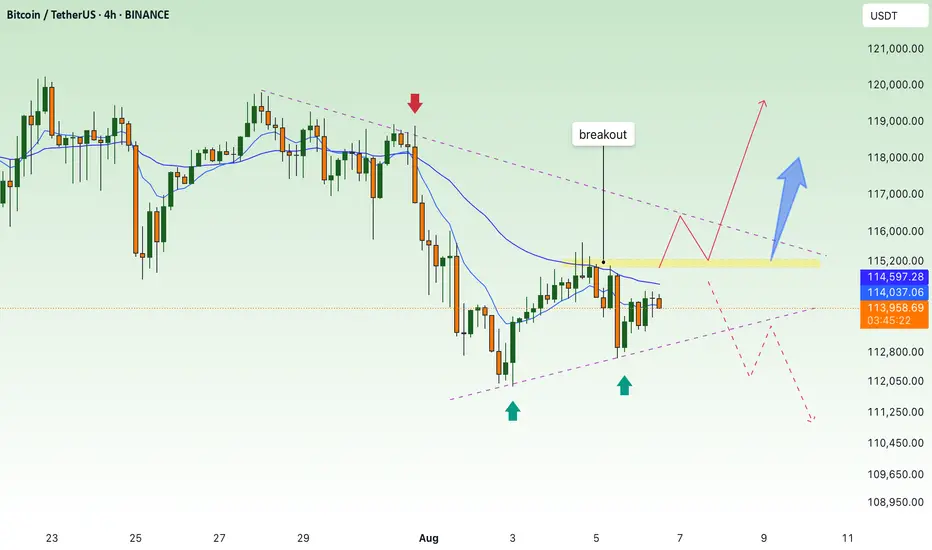
BTC continues to accumulate, waiting for breakout to go up💎 MID-WEEK BTC PLAN UPDATE (06/08)
Brief BTC Analysis – 4H Timeframe:
• Main Trend: Price is consolidating within a descending channel (green diagonal lines).
• Support: The 112,500–113,000 zone has been tested twice and bounced (green arrows).
• Resistance: The 114,800–115,200 zone (purple area) – this is the key level that will determine the next trend.
⸻
Two main scenarios:
🔺 Bullish Scenario (Preferred):
• Price breaks above the 115,200 resistance zone → confirms a breakout from the descending channel.
• Next targets: 116,500 → 119,000.
🔻 Bearish Scenario:
• Price gets rejected at around 115,000 and breaks below the 113,000 support → likely to revisit 110,000.
📌 Key Signals to Watch:
• A clear breakout above 115,200 with volume is a strong buy signal.
• If the price fails to break this zone, consider selling once there is a clear bearish reaction.
BTC – Summer chop arrived?Some rotations I'm looking for BTC.
Volatility is slowly cooling off, also noticeable in options premiums so I'm not expecting any big moves and mostly focussing on intraday moves.
That doesn't mean we can't mark more htf POIs of course.
1. Clean up the bad lows we left yesterday, but protect the low from CME open this week. Gives a really nice setup and RR
2. Take a stab lower into 110-111k. I think the sweep can be frontran here, so it's possible we have to stay alert and enter a bit sooner.

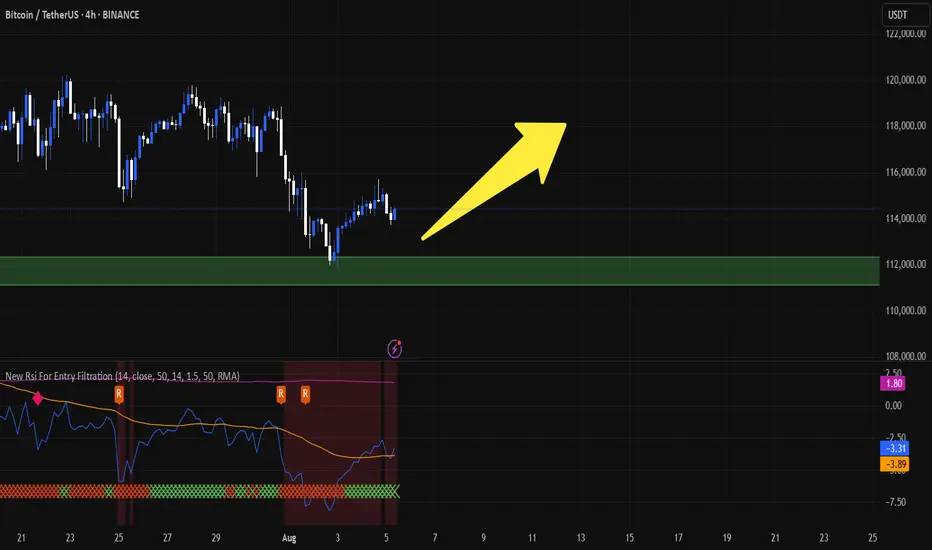
Bitcoin Ready for Takeoff - $150K Target Ahead! MARKETSCOM:BITCOIN is showing impressive strength after successfully retesting its May high and bouncing back with conviction. This level, along with the 50 EMA, is currently acting as a strong support zone. Holding above this area signals that buyers are in control, and this zone now serves as a major support for the ongoing bullish trend.
At the moment, CRYPTOCAP:BTC is facing minor resistance in the $115K–$116K range. A decisive breakout above this level is likely to trigger strong momentum, opening the doors for a new all-time high. Once this resistance is cleared, our previous projection of $150K comes into play as the next major target.
For now, it’s crucial for MARKETSCOM:BITCOIN to hold the current support zone to maintain the bullish structure. As always, traders should manage risk effectively and place stop-losses to protect their capital in case of unexpected volatility.
Follow Our Tradingview Account for More Technical Analysis Updates, | Like, Share and Comment Your thoughts

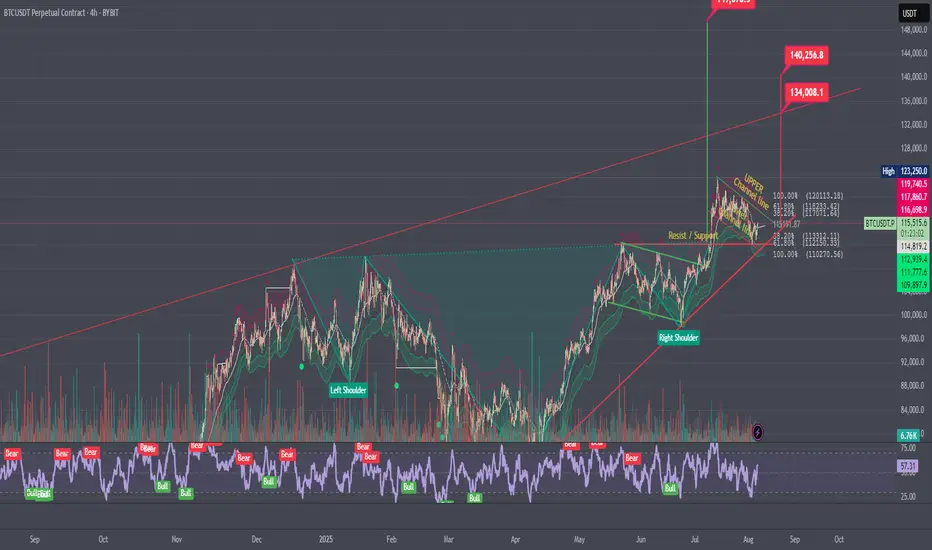
BTCUSDT: Head & Shoulders + QML SetupHello guys!
We have a clean Head & Shoulders pattern forming near a supply zone, with a nice QML (Quasimodo Level) rejection confirming the bearish bias. Price is struggling to break above 115K and has already reacted to the QML zone.
If this structure holds, we could see BTC start a new bearish leg 📉, first targeting 114K, and eventually reaching the demand zone around 112.8K–113.2K.
Watch for further confirmation with lower highs forming.

TradeCityPro | Bitcoin Daily Analysis #144👋 Welcome to TradeCity Pro!
Let’s dive into Bitcoin analysis. Today is the first day of the week and Bitcoin has made a bullish move.
⏳ 4-Hour Timeframe
After the weekly candle closed, Bitcoin made an upward move and pulled back up to the 0.5 Fibonacci zone.
✔️ The long trigger I provided yesterday in the 1-Hour timeframe has been activated. If you opened a short-term position, it has likely already hit the target. If it was a long-term position with a larger stop, then it should still be open for now.
💫 The current 4-Hour candle has wicked into the 0.5 Fibonacci zone, which indicates a strong rejection from this area. If the candle closes red, the probability of starting the next bearish wave will increase significantly.
📊 Besides the resistance from the Fibonacci level, the SMA25 is also overlapping with this zone, so this upward move could also be seen as a pullback to the SMA25 before another drop begins.
✨ However, the candle hasn't closed yet, so it's too early to decide anything. In my opinion, Bitcoin has re-entered a choppy and sideways phase that doesn’t provide good and clean positions — most trades like yesterday’s need to be scalps.
🔍 If a deeper correction happens, our lower support levels are already identified (with the most important one being the 110000 zone). For shorts, I’ll look for entries below 110000. As for longs, I’ll wait for confirmation and stabilization above 116000. For now, I’m only observing this box between 110000 and 116000.
❌ Disclaimer ❌
Trading futures is highly risky and dangerous. If you're not an expert, these triggers may not be suitable for you. You should first learn risk and capital management. You can also use the educational content from this channel.
Finally, these triggers reflect my personal opinions on price action, and the market may move completely against this analysis. So, do your own research before opening any position.

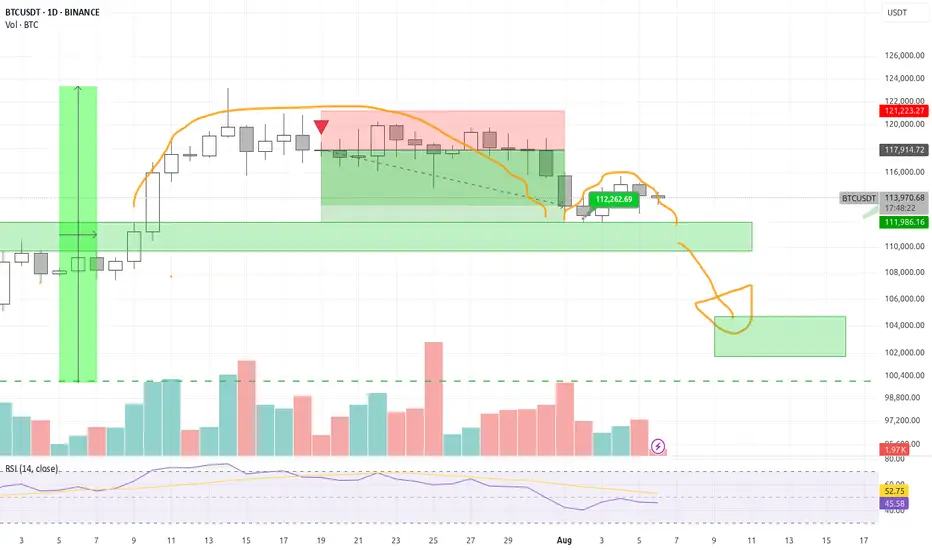
Is the current Bitcoin price a good place to buy?Bitcoin has been falling since last night towards $112,000. I don't think it will go below that. I think $113,000 is a good price to buy. Of course, with a stop loss of 111,500. This is not a financial offer. Don't get into futures trading because you might lose all your money.
Btc wants to 124k!Setup is here. Btc.d will be move the price to 124k usdt.
This is not financial advice, DYOR
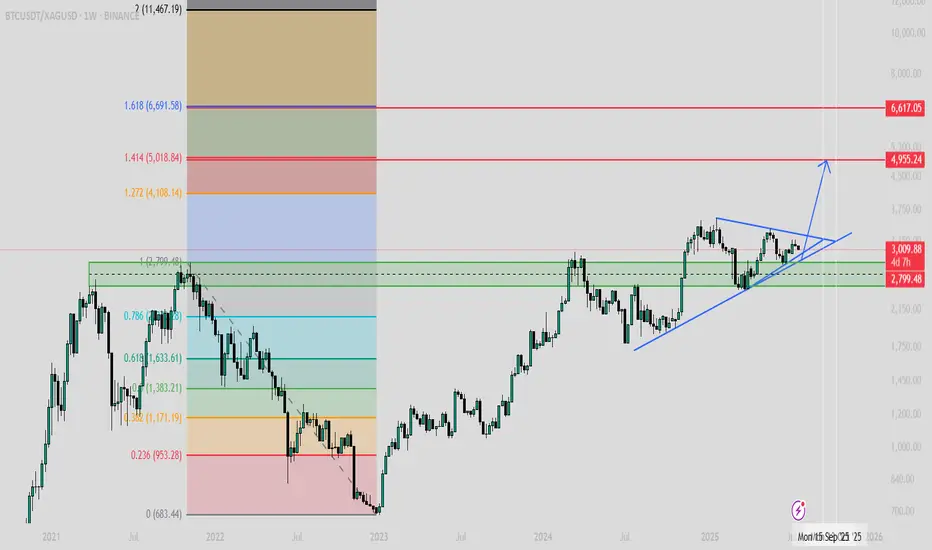
$BTCXAG - BITCOIN TO SILVER - BULLMARKET IS NOT OVER!I bet you haven't seen this chart anywhere! The Bitcoin to Silver chart is preparing for another explosion!
And yes, BULLMARKET IS NOT OVER!
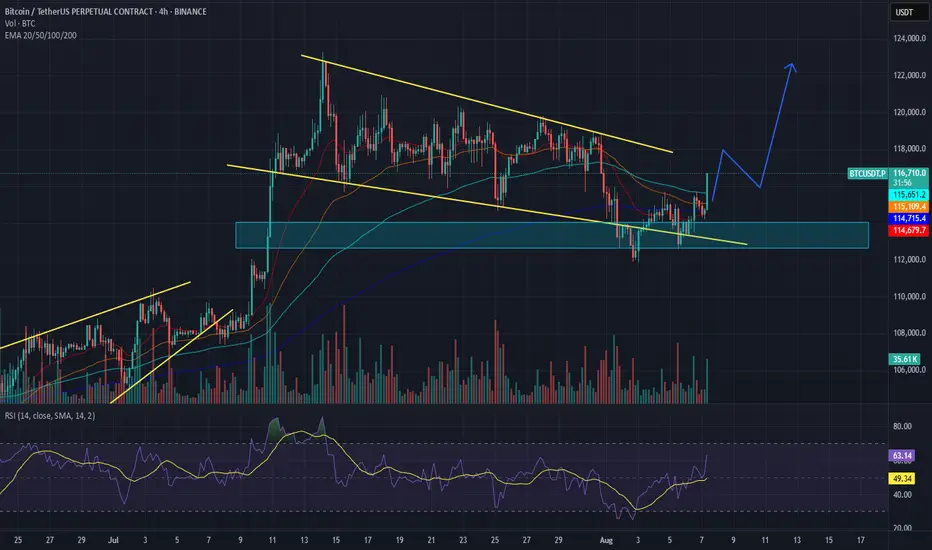
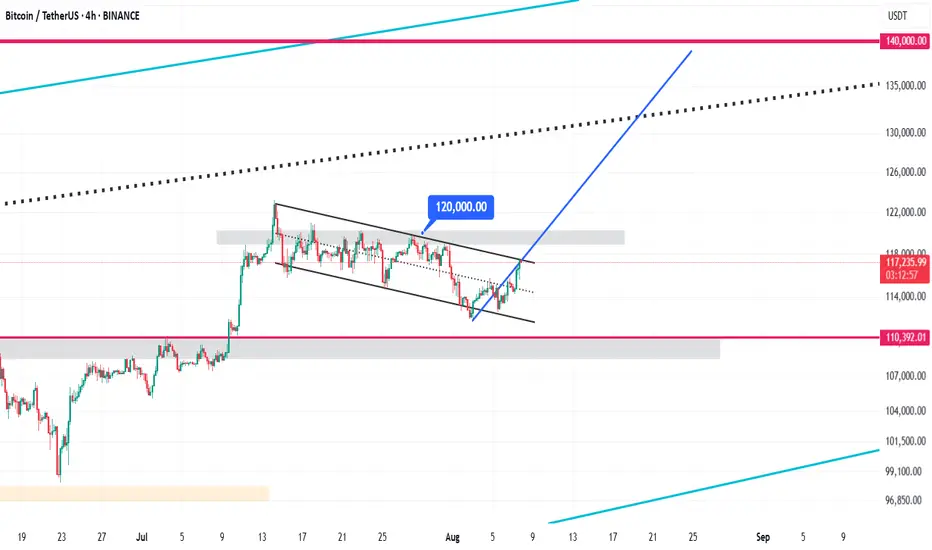
Bitcoin Bullish Flag Pattern Analysis & $140,000 Target🚩 Bullish Flag Pattern Formation
Bitcoin is currently forming a bullish flag pattern on the 4-hour chart. This pattern typically appears after a sharp upward move and represents a short-term consolidation within a descending channel. It usually signals a continuation of the strong bullish trend. Currently, the price is oscillating between the upper and lower boundaries of this channel, poised for a potential breakout.
⏳ Duration of the Correction Phase
The correction inside this channel has lasted from July 14 to August 8, 2025, spanning approximately 25 days. This relatively long consolidation period indicates a deep stabilization phase, allowing the market to gather momentum for the next upward wave. During this time, Bitcoin traded in a tight range between the channel’s support and resistance levels.
⚠️ Critical Resistance at $120,000
The key resistance level to watch is $120,000. If Bitcoin can break this level decisively with strong volume and confirming candles, the bullish flag pattern will be validated, signaling a continuation of the upward trend. This breakout point is considered an optimal entry for new long positions.
🎯 Price Target at $140,000
The target price derived from the bullish flag pattern, calculated by measuring the flagpole and projecting it from the breakout point, is around $140,000. This represents approximately a 20% gain from the breakout and may serve as a significant psychological resistance level.
BTCUSD : Short levelHere is a great entry point for those who scalp this instrument or pips. The level is marked with a red arrow. It will be active until I report. It may become inactive over time.
Watch out for trading on the news.

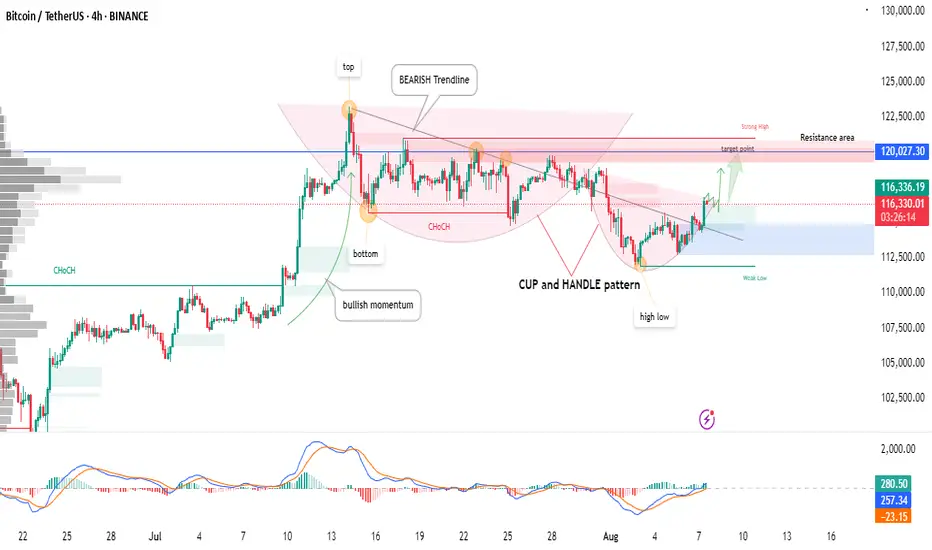
BTCUSDT | Cup & Handle Breakout Forming – Key Resistance Ahead!Bitcoin is forming a classic Cup and Handle pattern on the 4H chart, indicating potential for a bullish breakout.
🔹 Key Highlights:
Clear bullish momentum after a confirmed ChoCH (Change of Character)
Bearish trendline has been broken, shifting market structure
Price approaching the resistance area near $120,000, which aligns with a strong high
Watch for breakout above the target zone for potential continuation
MACD shows bullish divergence supporting momentum
📌 A clean break and close above the resistance zone could trigger the next leg up. However, a rejection here may retest the $112,000–$114,000 demand zone (handle support).
🧠 Not financial advice. Always do your own research before trading.
Bitcoin Price Action: Key Support & Resistance Levels to WatchKey levels are marked on the chart. These are all validated by at least three touches.
The pale blue line, that seemingly comes from out of nowhere, is the most significant one because it is the longest running. The ATH trendline for Bitcoin. The choppiness around this level is to be expected. If Bitcoin can gain the fuel to power above here, it'll almost certainly go parabolic.
Bulls need the bottom of the orange box at $116k to hold to maintain control.
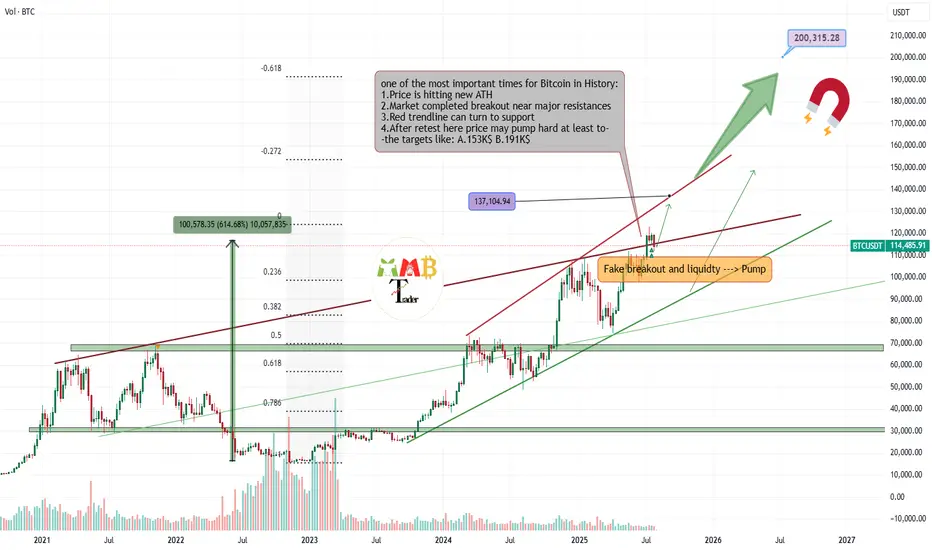
The next bull week gonna start soonWe had new ATH around 123K$ and market is now facing some correction and fall and i think soon we can expect end of this correction and also more gain this time will lead price to new ATH at least around 137K$.
it seems that red trendline is not broken yet and for confirmation of breakout we need price at least stay above 116K$ and close daily candle above there.
DISCLAIMER: ((trade based on your own decision))
<<press like👍 if you enjoy💚
How to Use AI for Crypto Trading (The Right Way)lemme answer real quick: YOU DON’T.
Most traders using AI in crypto are straight up doing it wrong.
Here’s the usual story:
They open ChatGPT and ask,
“Hey… uhm… tell me which altcoin will 100x… Bruh, I heard you know everything, bet you know the next 10x coin!”
ChatGPT confidently replies,
“Sure, buy this coin right now…”
And the trader’s like,
“Ok, thanks.”
Then they jump on Binance, smash that buy button, and lose money faster than you can say ‘left trading’.
Don’t be that guy. Tools like ChatGPT weren’t made for this wild crypto jungle. Crypto’s a messy, super risky market, and ChatGPT’s language models mostly have old info anyway. They can’t give you solid, grounded analysis of what’s really going on — on-chain or across exchanges.
BUT, if you wanna cut through the hype and dodge the FOMO, this quick guide is for you. I’ll show you how to use AI the right way — with real on-chain and off-chain data, and special AI agents built specifically for crypto research.
Wanna keep going? Cool, let’s dive in. If not, peace out and don’t waste your time.
1. Use AI That Actually Processes On-Chain and Off-Chain Data
Real AI power kicks in when you talk about scale — thousands of tokens, millions of wallet moves, shifting stories everywhere. Humans can’t keep up, but AI can process it all instantly, in real time.
Look for AI tools that analyze stuff like:
Wallet behavior and how smart money moves.
Token velocity and decentralized exchange volumes.
Social sentiment from Twitter, Reddit, Discord, Telegram.
Developer activity, governance updates, protocol changes.
How market narratives pop up and spread.
2. Use AI Agents Made Just for Crypto Research
Crypto’s not like stocks or forex. It’s faster, fragmented, and shaped by both on-chain wallet moves and off-chain communities.
That’s where specialized AI agents shine. They understand stuff like:
How wallets behave during airdrops.
How Telegram groups hype early projects.
How dev activity correlates with price moves.
Instead of raw data dumps, these crypto-native AI agents spot patterns that’d take humans days to find. Like spotting when big wallet clusters start accumulating in a new ecosystem, or when a protocol suddenly blows up on social media.
3. Combine Research & Automation for Full-Spectrum Edge
I’m personally pumped about this part. Imagine an AI agent tracking low-cap funds moving into Telegram channels, running sentiment analysis, then tracking smart wallets accumulating tokens (even mixing in technical analysis).
Finally, it finds your risk management , sets triggers, and helps you enter trades with clear stop-loss and target levels.
Quick heads-up: Because of TradingView’s house rules, I can’t drop any links here — you gotta search and find your best AI tools on your own.
Remember : The only way to survive this market is to stay skeptical , watch risk management like a hawk, and keep your head cool. So if you feel FOMO creeping in or money management slipping — close your laptop, hit a coffee shop, and order a espresso. Trust me, it’s worth it.
Thanks for sticking with me till the end of this lesson. Im Skeptic from Skeptic Lab & If this helped, smash that boost button and I’ll catch you in the next one! :)