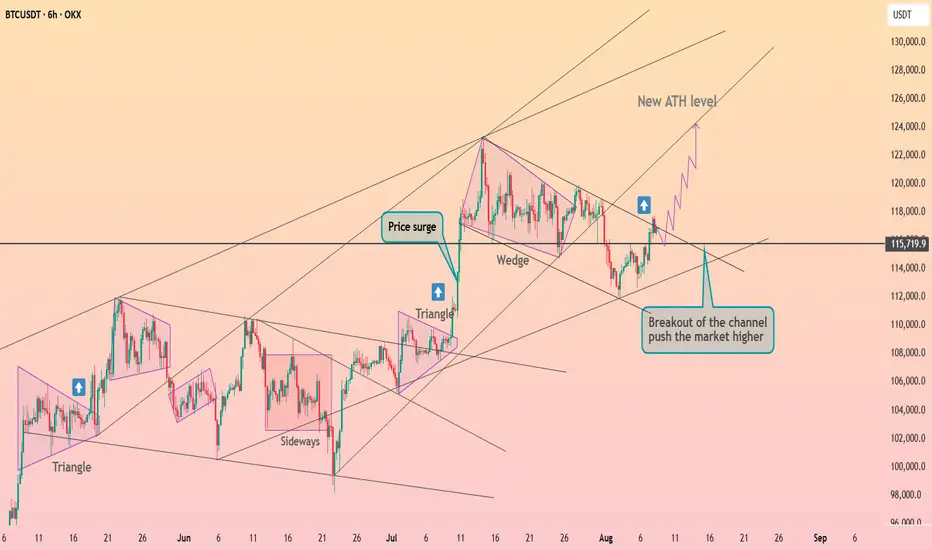
Bitcoin above $116k ┆ HolderStatOKX:BTCUSDT reclaimed the 115k pivot after breaking a local channel that formed within a larger wedge. The surge from triangle consolidation, followed by a controlled pullback and higher‑low, suggests accumulation rather than distribution. As long as 113–115k holds, targets line up at 118.5k, 121k and the extension toward 124–126k along the rising trend fan. Only a decisive close below 112k would invalidate the immediate bullish bias and reopen 109–110k. For now, constructive momentum and structure favor continuation.
USDTBTC trade ideas
Buying Idea For BITCOIN
dont be aggresive dont be greedy
Trading is 80% of waiting 20% (open position, money management, etc)
Lets wait and see BINANCE:BTCUSDT

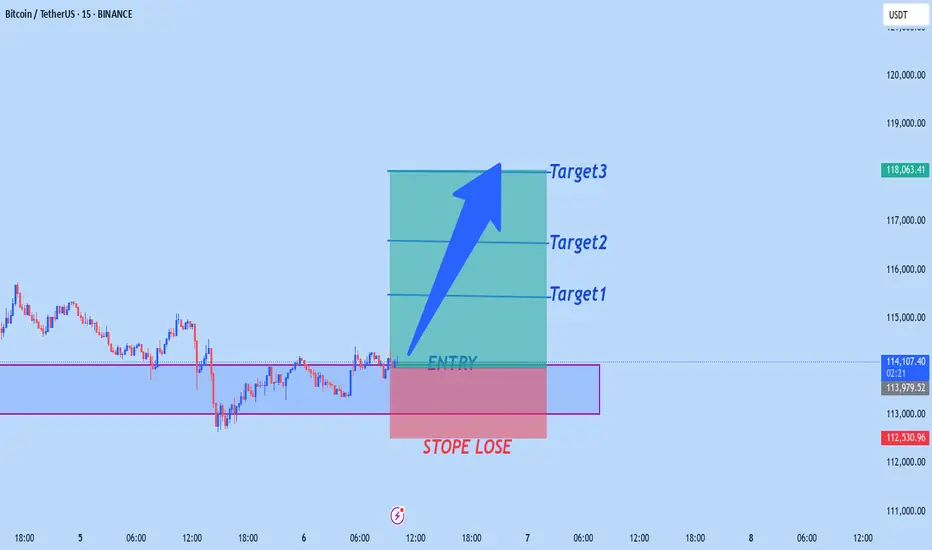
BTCUSD CAN FLY HIGHbtcusd buy from 114,000
target1 115,500
target2 116,500
target3 118,000
Stope lose 112,500
TRADE AT YOUR OWN RISK
BTC key zones for continueBTC needs to hold this zones for continue and there is some liquidity. Because dominance get breakout we want to see much higher prices for altcoin but maybe we will see sharp correction and continue up.
Feel free to ask for some altcoin analysis.

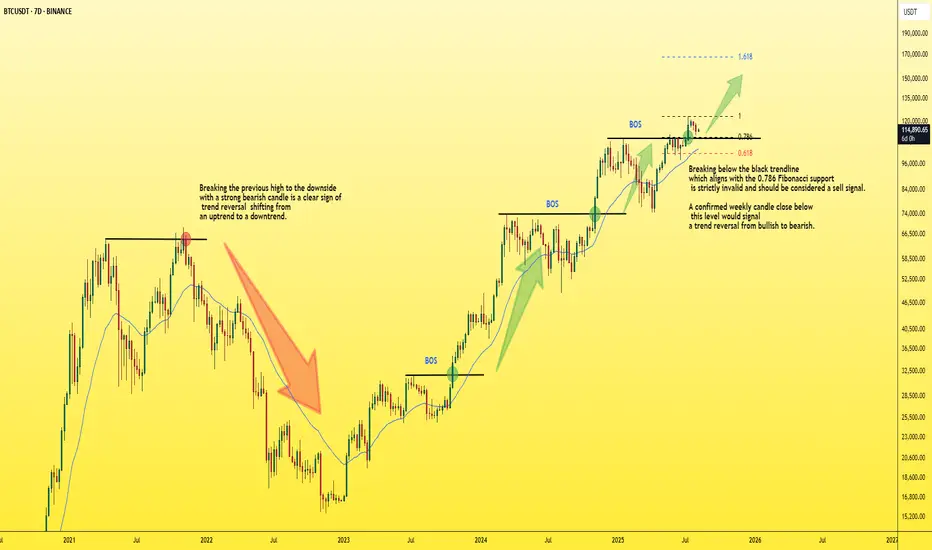
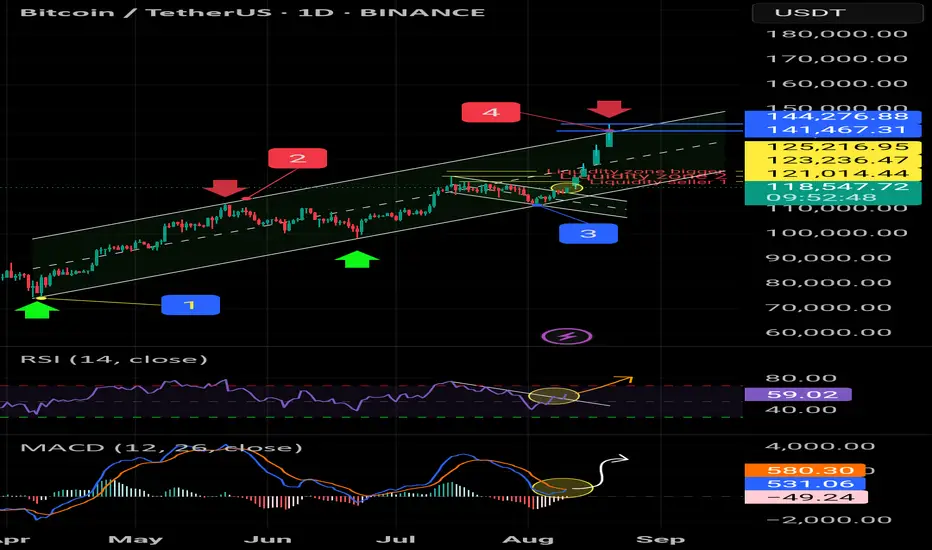
BTC - Key insight you must pay Attention to!📊 This is a weekly Bitcoin chart with a key insight you should pay close attention to:
In a bullish trend, you’ll always notice higher highs being formed. Once price breaks the previous high, it's typically a strong confirmation of bullish continuation, as shown by the BOS (Break of Structure) levels marked in blue on the chart.
🔻 The BOS level must not be broken to the downside — if that happens, it signals a trend reversal from bullish to bearish, just like what occurred at the red zone I highlighted.
✅ Currently, Bitcoin has broken its previous high to the upside, which indicates the bullish trend is continuing.
🎯 Next target: $150K.
⚠️ However, if BTC pulls back for a retest and fails to bounce quickly, it will be considered a strong sell signal. That would likely lead to a correction back down toward the $80K zone.
Best regards:
Ceciliones🎯
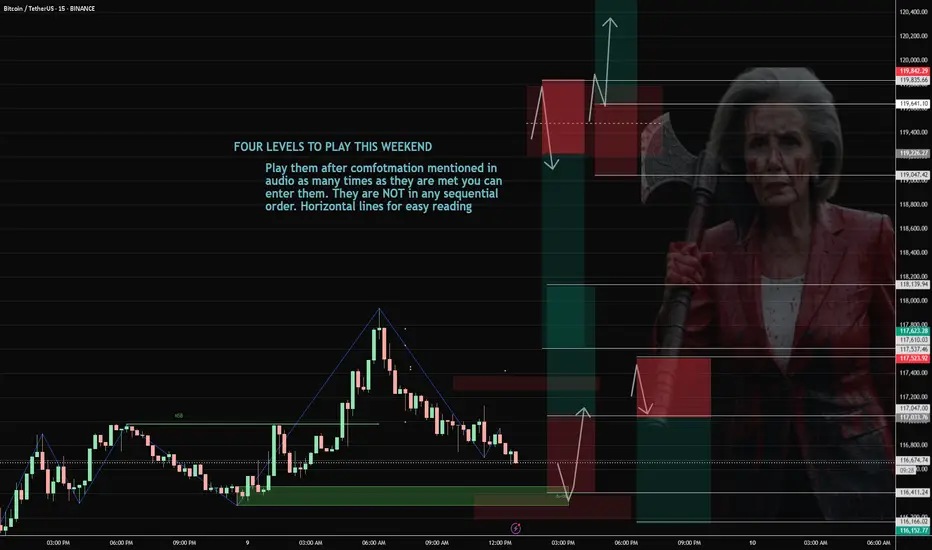
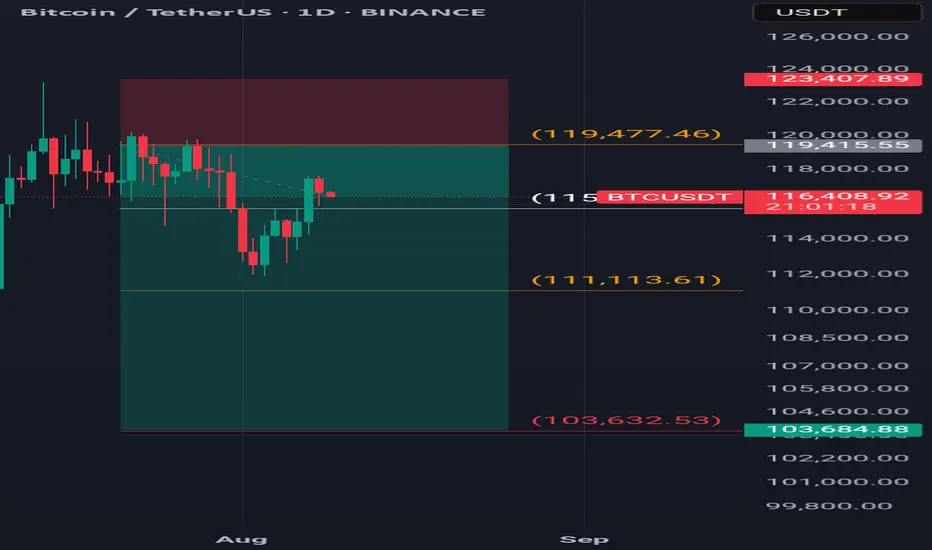
BTC 08/09-08/11 Levels To PlayPlay them after confirmation as many times as they are met you can enter them. They are NOT in any sequential order. Horizontal lines for easy reading. This is valid until BTC breaks below or above and those breakout levels are listed too.
LONG #1 (breakout): Break and hold above 119,500, buy the pullback 119,400–119,600 → targets 121,900 → 122–123k. Invalidate on loss of 119,000.
LONG #2 (sweep-reclaim scalp): Sweep 116,200–116,400, reclaim and hold above ~117,000 → 117,900–118,100. Invalidate on loss of the reclaim (~116,800).
SHORT #1 (rejection): Fail/sweep at 119,300–119,800 and close back inside → 118,900 → 118,000 → 117,500. Invalidate on H1 close > 119,800.
SHORT #2 (intraday fade): Reject 117,200–117,400 → 116,600 → 116,200. Invalidate on push/hold > 117,500.
BTC 4hHello to all traders. 😎😎
I hope all your deals will hit their targets. 🎉🎉
I think Bitcoin can grow to the $117,000 range and then even to $119,000. Even if it wants to do it in a downtrend, it must first grow to collect the short positions from above and then fall.
⚠️⚠️⚠️⚠️Don’t forget to apply proper risk management!
What Do You Think?
Which scenario do you think is happen? **Share your thoughts!** ⬇️
Don't forget that this is just an analysis to give you an idea and trade with your own strategy. And don't forget the stop loss🛑🛑🛑
❤️❤️❤️The only friend you have in financial markets is your stop loss❤️❤️❤️
Please support me with your ✅' like'✅ and comments to motivate me to share more analysis with you and share your opinion about the possible trend of this chart with me 🙏😊
Be Happy , Ali Jamali
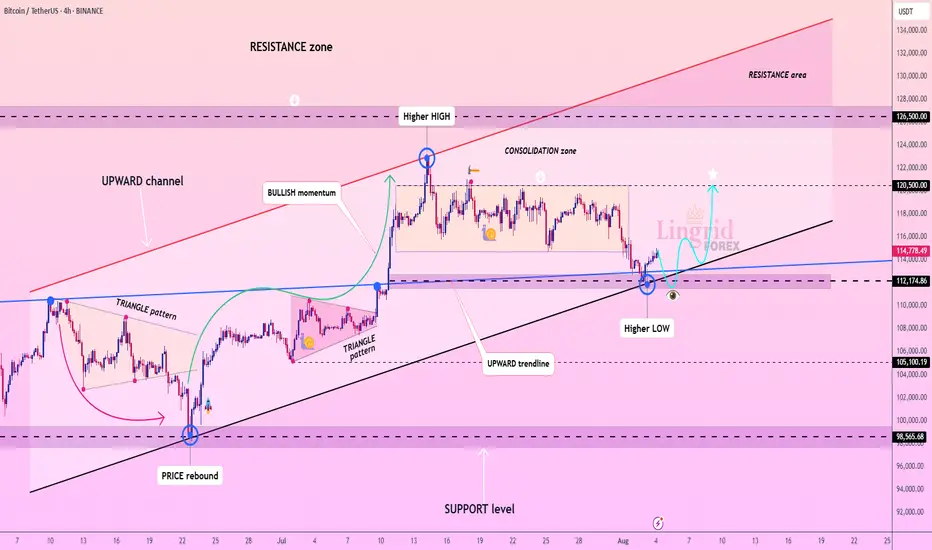
Lingrid | BTCUSD Consolidation PHASE ContinuesBINANCE:BTCUSDT is bouncing from the confluence of an upward trendline and the $112,175 support level, forming a higher low structure. Price remains within an upward channel, with the current pullback holding above key structural support. As long as the higher low remains intact and price stays above $112,175, a continuation toward $120,500 is likely. Momentum appears to be rebuilding within the bullish framework after a period of consolidation.
📉 Key Levels
Buy trigger: Break and hold above $114,680
Buy zone: $111,500 – $112,500
Target: $120,500
Invalidation: Break below $111,000
💡 Risks
Failure to hold the trendline could trigger deeper downside
Resistance at $114,680 may reject early attempts to move higher
Market may stay range-bound if volume remains low
If this idea resonates with you or you have your own opinion, traders, hit the comments. I’m excited to read your thoughts!
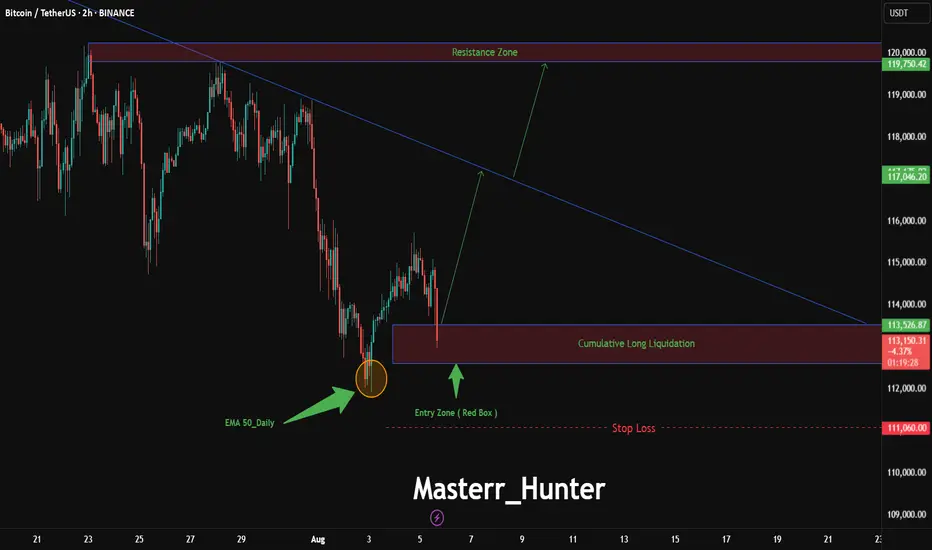
BTC/USDT: Bitcoin Blast to New Heights?BINANCE:BTCUSDT is gearing up for a breakout on the 2-hour chart, with an entry zone between 113,520-112,590 near the 50-day EMA support. First target at 117,190 , with a second target at 119,750 aligning with key resistance. Set a stop loss at 111,060 below the recent low to manage risk. A break above 114,000 with volume could ignite this rally. Watch BTC sentiment and market liquidity shifts. Ride the wave!
Do you see this BTC breakout coming? Drop your thoughts!
#BTCUSDT #BitcoinTrading #CryptoSignals #TechnicalAnalysis #TradingView #DayTrading #MarketAnalysis

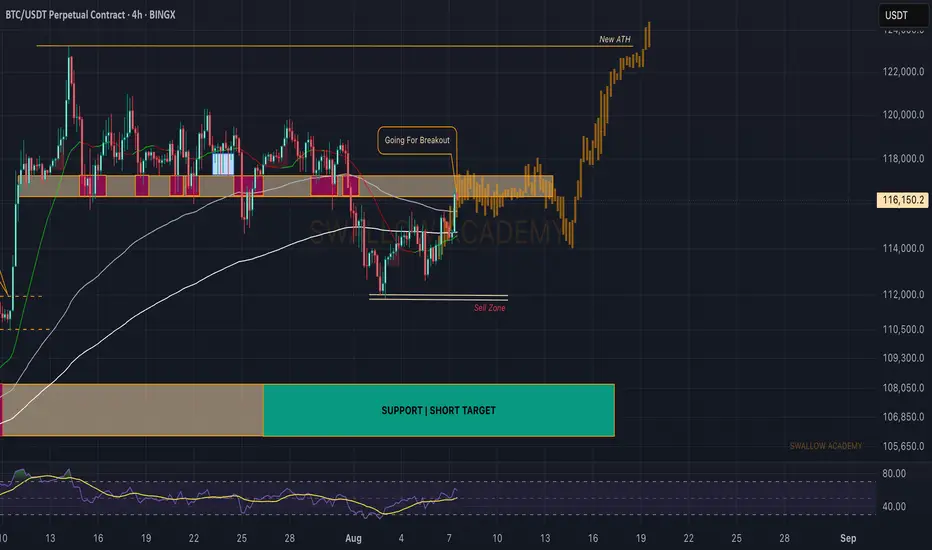
Bitcoin (BTC): Buyers Are Accumulating | Going For Breakout Bitcoin looks good; after some struggle, the price is now pressuring the local resistance area. What we are looking for here is the breakout from the $116K zone, which then would open for us an opportunity to long the coin until the ATH zone of $123K.
Swallow Academy
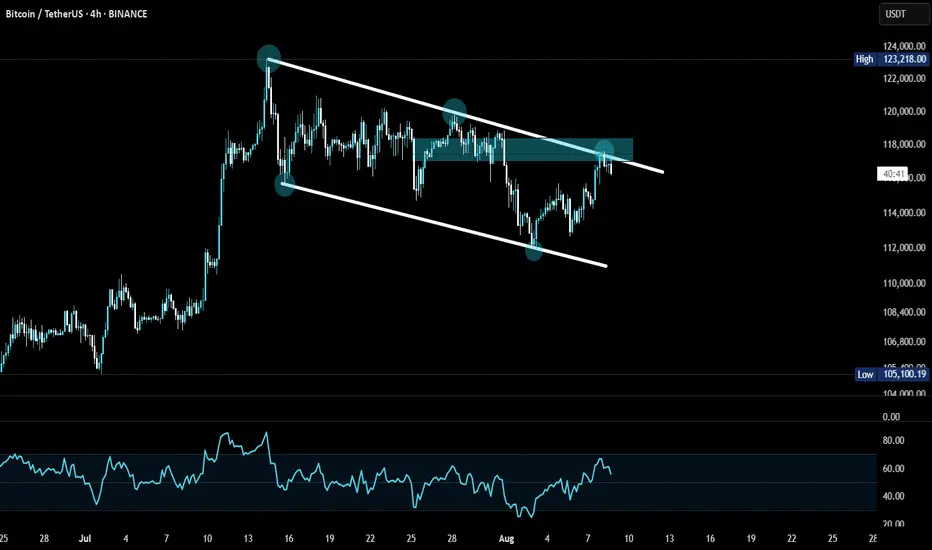
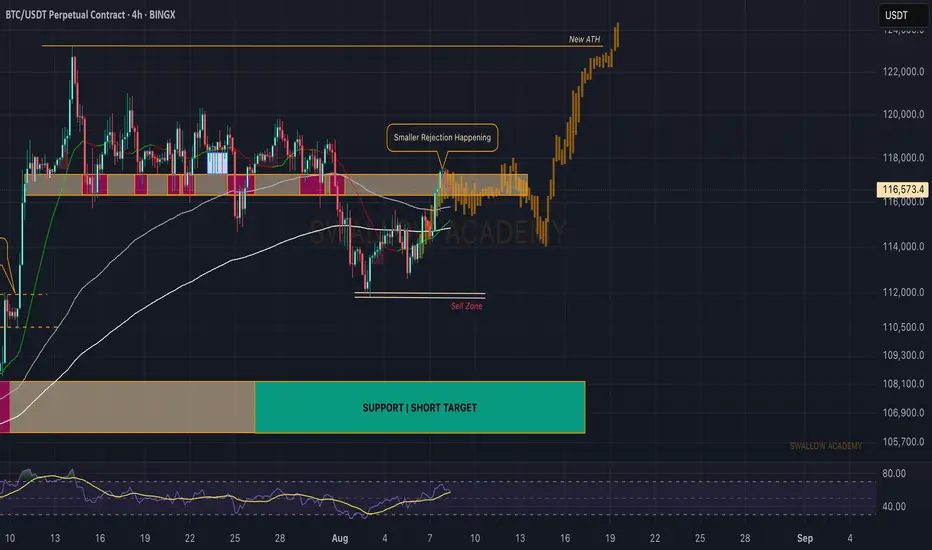
Bitcoin (BTC): Seeing Resistance At $116K, Waiting For BreakoutBitcoin had a good rally, where after reaching the local resistance zone, we had the rejection, a smaller pullback.
The plan has not changed; we are looking for that breakout, which would lead us back into the sideways channel and potentially give us the retest of ATH!
Swallow Academy
BITCOIN the rejection around $117,576 fits into the current volatile but evolving Bitcoin market, where prices near these peaks face resistance amid institutional inflows, ETF impacts, and changing cycle patterns. Ongoing market sentiment, regulatory developments, and macroeconomic factors will continue to influence whether these resistance levels are eventually broken or retested further.
its critical to know that further capital inflow could see 130K-135K and we will see massive correction.
and on a flip side a break out of the 4hr ascending trendline will be looking at 99k-100k zone .
#btc #bitcoin

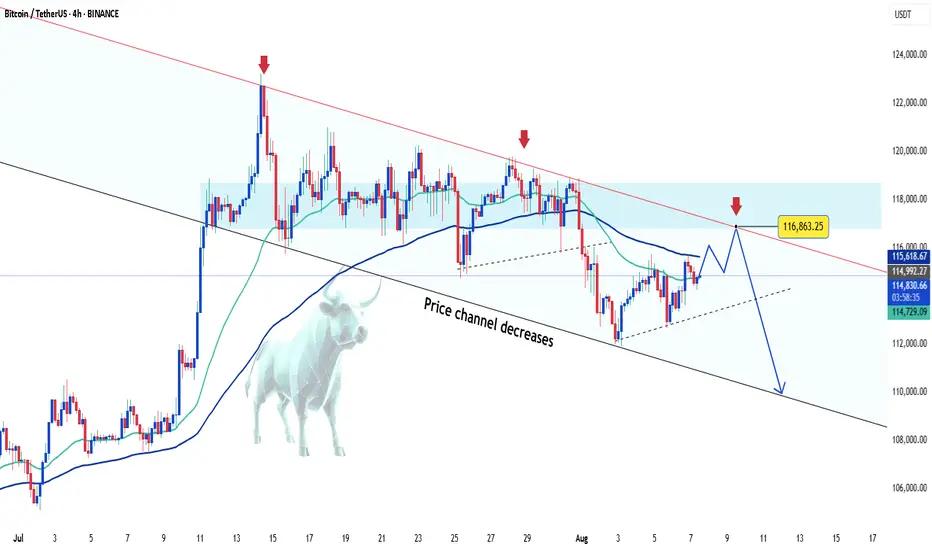
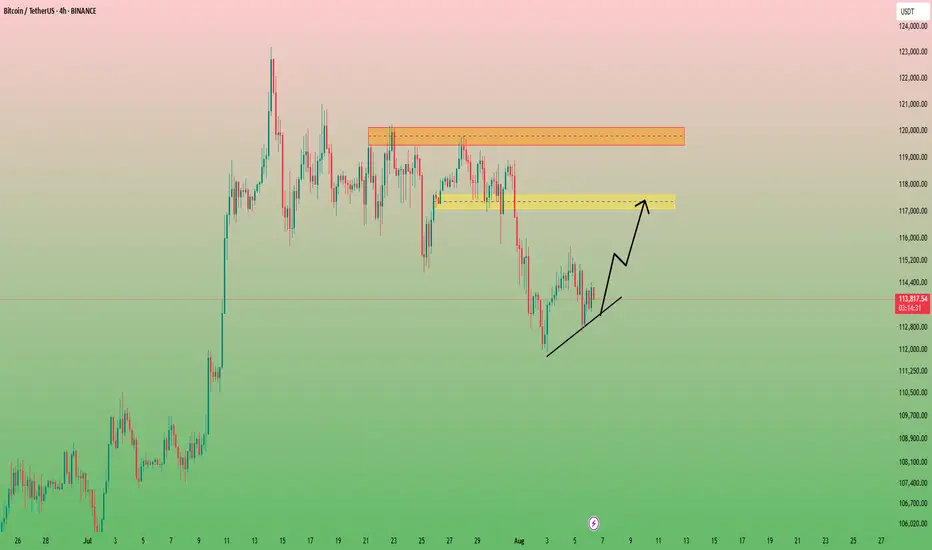
Bitcoin Analysis – August 8, 2025After consolidating between $120K and $116K for two weeks,
last week Bitcoin broke below this range with a strong bearish candle. 📉
Part of the leftover liquidity has been swept, but the candle formations at the top indicate profit-taking by buyers and increasing selling pressure at higher levels.
On the retracement toward the $118K zone, sellers still showed dominance.
As we mentioned in previous analyses, Bitcoin wouldn’t truly enter a corrective phase unless it reached the $108K–$104K zone.
However, with the current market structure, a new wave of sellers is joining in, and we’re already seeing its impact on altcoins.
While we may not have full confirmation yet for a sustained downtrend,
the market signals suggest Bitcoin has entered a corrective phase.
BITCOIN BITCOIN is cooling off from last attempted all time high at 123k 122k zone .the daily ascending trend and 4hr is giving a demand floor which will be watched on possible breakout from the structure ON 4HRS
On 4hrs we have a break out of a descending trendline and followed by two successful sell off connecting us from our current all time high. if we dont reclaim that supply roof by returning to buying floor ,then sellers will push to break the daily ascending trendline acting as dynamic support and our target from our EMA+SMA STRATEGUY IS 99-100 ZONE and on a flip side if we see buying liquidity from cooperate buying ,then we will hope for retest if 123k and extend the greed buying 128k-130k-135k will be targeted.
trading is 100% probability and any key level can fail, pls manage your risk
A trader without capital is a demo trader.
As a trader, your biggest weapon in the financial market is your capital,dont play or gamble with it.
GOODLUCK,PLS LIKE AND SHARE IF YOU LIKE THE IDEA AND INSIGHT.

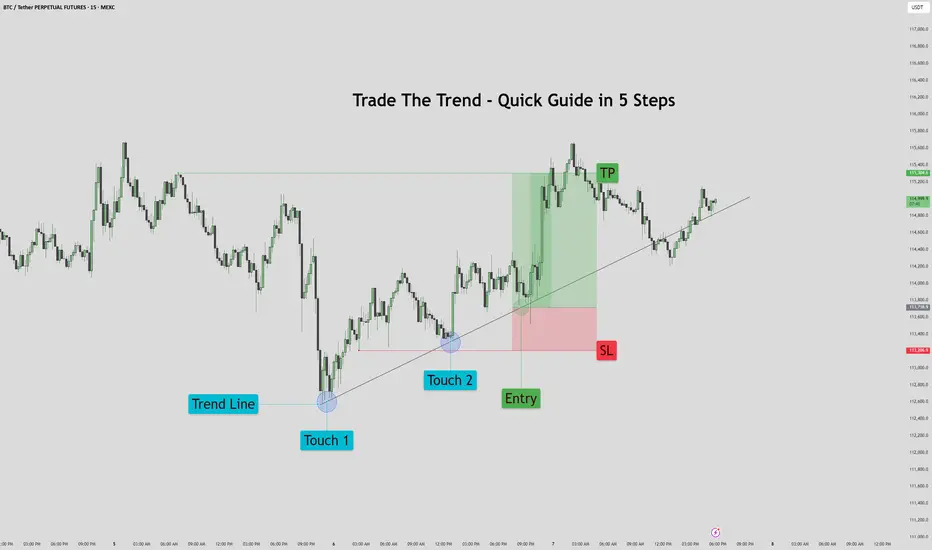
Trade The Trend – Quick Guide In 5 StepsWhat is Trading the Trend?
Trading the trend means buying when the market is going up, and selling when it’s going down.
You're following the direction of the market, not fighting it.
If the trend is up:
Price makes higher highs and higher lows
You look for chances to buy (go long)
If the trend is down:
Price makes lower highs and lower lows
You look for chances to sell (go short)
Why it works:
You’re going with momentum
Simple rule:
Buy in an uptrend, sell in a downtrend — never trade against the flow
1. Assess the chart. Where is it headed? It's headed up.
2. Place your trend line by connecting the first two points.
3. Let the chart play out for a bit. Afterwards prepare your entry on previous failed trend line retest. Set your stop loss below the previous trend line retest, and your TP just before the previous sweep above.
4. Proceed to let the chart play out, then set your pending order.
5. Watch the Trade enter and play out with patience.
This method works for bearish trends as well, just reversed.
If you would like to see more 5 step guides, comment down below.
Thank you!
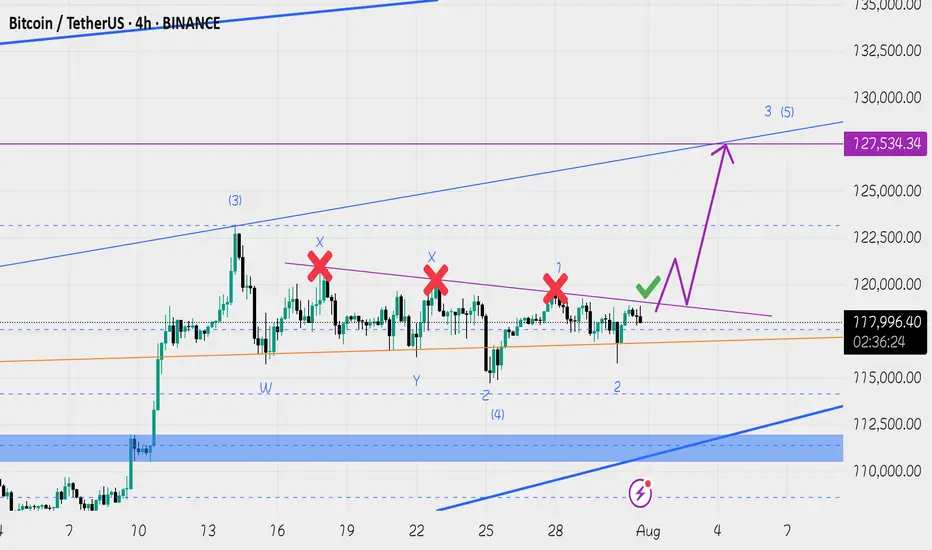
127-128k incoming ( altcoins round ? )Hi, Bitcoin seems to have completed its short term Elliott wave 4 correction and the price action analysis also confirms that this time Bitcoin will be able to break the 120-119 resistance, I predict Bitcoin to make a new high around 127-128. Altcoins have not grown that much yet and if the price can make a reliable consolidation above 120k, altcoins will start to rise.
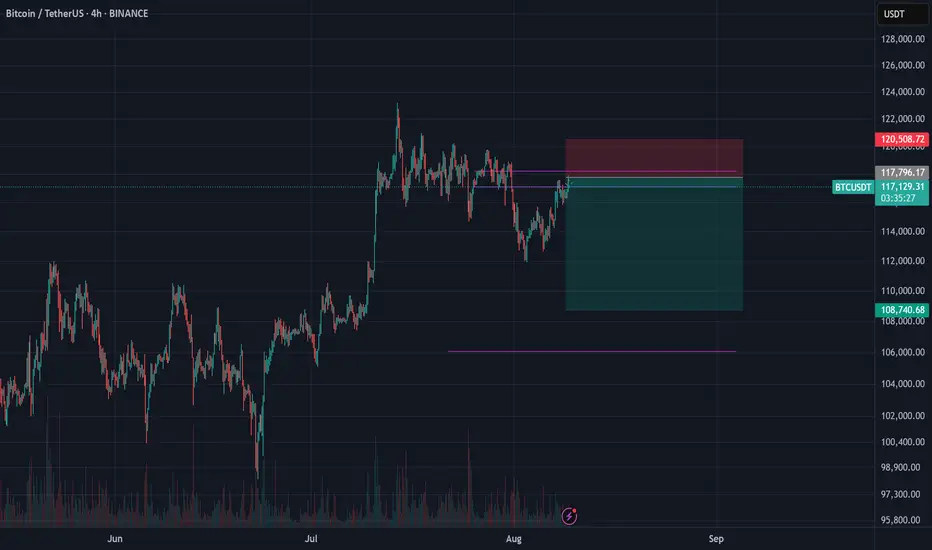
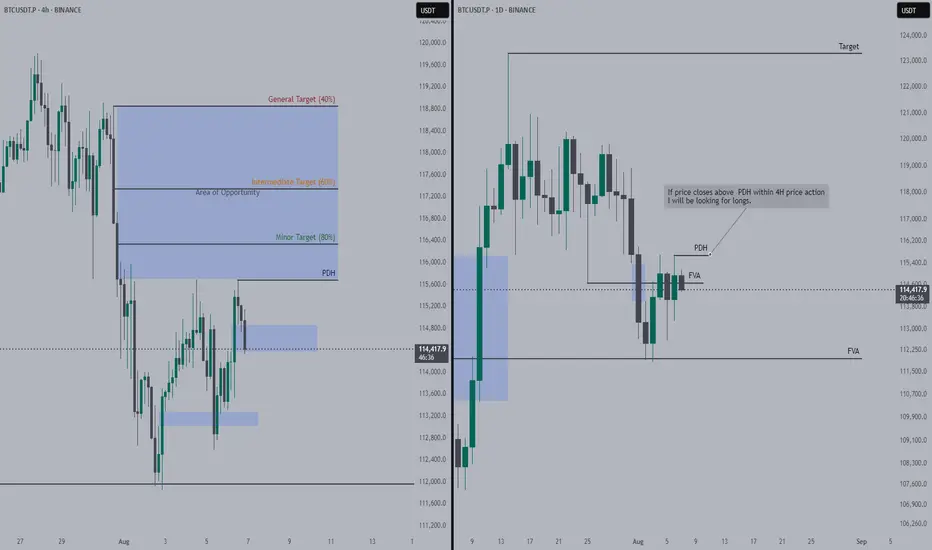
If Bitcoin holds up the pullback, longs incomingBullish imbalance on 4H holds price to not submit to the lows.
I will engage once the PDH gets run through and 4H candles closes above. Only engage within the Area of opportunity.
Targets have been outlined with their success rates.
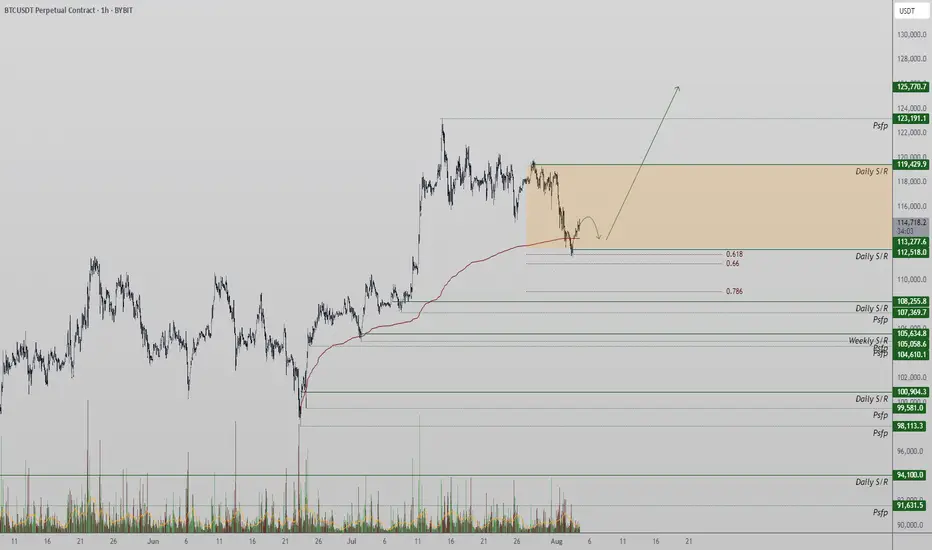
Bitcoin Tests Major Support at $112,500Bitcoin is currently in a local downtrend, with price now testing a major support zone around $112,500. This level, backed by multiple technical confluences, may serve as the base for a potential reversal if defended on lower timeframes.
Price action has been drifting lower over the past sessions, finding its way into a key support zone defined by the 0.618 Fibonacci retracement, the blue upward trendline, and prior structure. The $112,500 region now acts as the immediate level to hold from an intraday perspective. If bulls are able to defend this zone and volume confirms participation, the probability of a rotation higher toward $123,000 increases significantly.
Key Technical Points:
- Support at $112,500: Aligned with 0.618 Fibonacci, trendline support, and structural pivot
- Intraday Confirmation Required: Holding this level on lower timeframes improves the
probability of reversal
= $123,000 Target in Sight: Technical target for rotation if a bottoming structure forms and holds
From a short-term perspective, Bitcoin has clearly shifted into a local downtrend, creating a sequence of lower highs and lower lows. However, the current area around $112,500 presents a strong confluence of support that could interrupt this trend. This zone includes the 0.618 Fibonacci retracement from the most recent swing move, a respected upward trendline (blue), and a previous structural pivot. Together, these elements increase the probability of a bounce—provided price can stabilize.
At this stage, price may still trade sideways and consolidate within this region to form a bottoming structure before any meaningful move higher. For traders, this means confirmation is key. Watching for multiple intraday candle closes above the support zone, paired with an increase in bullish volume, would suggest that demand is building. Only then would the setup favor an entry targeting the local highs.
The upside technical target from this area remains at $123,000, representing the recent swing high and a clear resistance level. A reclaim and rotation to this level would validate the support zone and reintroduce the bullish bias in the short term. Until that occurs, however, price could continue to consolidate, especially if volume remains low or indecisive.
The overall structure still leans constructive, as long as $112,500 holds. A breakdown below this level would weaken the short-term setup and potentially open the door to deeper downside probing. But for now, the region remains a high-probability bounce zone on lower timeframes.
What to Expect in the Coming Price Action
Bitcoin is testing critical intraday support at $112,500. If this level holds with volume confirmation and intraday structure aligns, a rotation toward $123,000 is likely. However, price may continue consolidating at this level before a clear direction forms.
Bitcoin Go 140kBit is moving towards liquidating sellers and there is generally high liquidity.
Pls careful
Liquidity zone 130,000 __144000
⚠️⚠️⚠️⚠️⚠️⚠️☠️☠️☠️
Bitcoin Faces Pressure Below $114,000 – What’s Next?Hey crypto community, BINANCE:BTCUSDT continues to face pressure as the price slips below $114,000 during Thursday’s trading session. Although there was an attempt to break through the $116,000 resistance, buying power remains weak, mainly due to diminishing demand from institutional players.
A clear indication of this trend is seen in the ongoing outflows from US-listed Bitcoin ETFs – on Tuesday alone, $196 million was withdrawn, extending the losing streak to four consecutive days.
However, there’s a glimmer of hope from Asia: SBI Holdings in Japan has recently filed for approval of a dual-asset ETF that includes both BTC and XRP. This could be a sign of a fresh wave coming from the East.
On the chart, if BTC fails to reclaim the $114k – $116k range soon, further downside potential remains. But keep in mind, deep corrections often provide an opportunity for large players to accumulate.
👉 What do you think about this correction? Will BTC hold its ground against selling pressure? Let me know your thoughts!