BTC Riding the Trend — $120K Target on RadarBitcoin is riding a rising support zone, showing steady bullish momentum despite recent pullbacks.
We’ve seen a key resistance level flip into support, and price is now holding firmly above it. As long as CRYPTOCAP:BTC respects this trendline, bulls have a strong chance to push higher.
The immediate test is the downtrend resistance — a clean breakout here could open the path toward the $120K–$122K zone.
If rejected, price may retest the rising support before making its next move.
DYOR, NFA
Thanks for the reading
USDTBTC trade ideas

Bitcoin Analysis – August 8, 2025After consolidating between $120K and $116K for two weeks,
last week Bitcoin broke below this range with a strong bearish candle. 📉
Part of the leftover liquidity has been swept, but the candle formations at the top indicate profit-taking by buyers and increasing selling pressure at higher levels.
On the retracement toward the $118K zone, sellers still showed dominance.
As we mentioned in previous analyses, Bitcoin wouldn’t truly enter a corrective phase unless it reached the $108K–$104K zone.
However, with the current market structure, a new wave of sellers is joining in, and we’re already seeing its impact on altcoins.
While we may not have full confirmation yet for a sustained downtrend,
the market signals suggest Bitcoin has entered a corrective phase.
BITCOIN LONG Bitcoin is currently trading in a up trend so looking at a continuation trade to the upside. Trendline is strong matched with a strong support level for a good looking entry.

weekend buy zone for bitcoinAs volume trails off due to markets being closed leaves room for manipulation. Which is why we tend to stay away from weekend trading unless we have a set in stone game plan as we do now. We take the variables of longs vs shorts, days of the week, and market maker manipulation to strengthen our pvsra volume threshold trading strategy. See where we got this liquidity below, on the 5m timeframe.
LETS FRKN GO!!!!2 days ago I released a 'Make or Break' video
It is with GREAT joy that I say I'm made!
My high ideals of revolutionizing the trading game is materializing...there's no counter argument
THANK YOU for all of the amazing humans who have been apart of my journey.
LETS FRKN GO!!!!

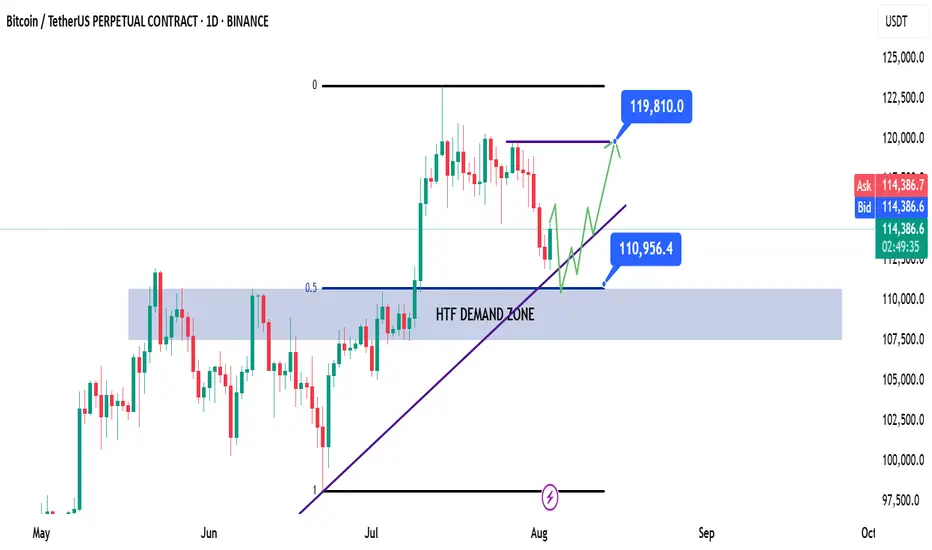
BTC | Bitcoin - Weekly Recap & Gameplan - 03/08/25📈 Market Context:
Traders are currently anticipating a potential 0.25% rate cut at the September FOMC meeting, which continues to support the broader bullish outlook.
While the market pulled back following weaker-than-expected Non-Farm Payroll data, overall sentiment remains optimistic.
Greed has cooled off into a more neutral stance. Historically, August often brings some consolidation or pullbacks — but the structural bias for Bitcoin remains bullish.
🧾 Weekly Recap:
• After printing new all-time highs, BTC began a healthy retracement.
• Price action closely mirrored the Nasdaq's (NQ) pullback during the week.
• We saw a small bounce mid-week, but no strong reversal confirmation yet.
📌 Technical Outlook & Game Plan:
→ I’m watching for price to revisit the long-term bullish trendline.
→ A slight deviation into the HTF demand zone would be ideal for long entries.
→ Bonus confluence: This area also aligns with the 0.5 Fibonacci retracement (Equilibrium level), providing a key discount zone.
🎯 Setup Trigger:
I’ll be watching for a confirmed bullish break of structure (BOS) on the 1H–4H timeframes to signal a reversal.
On confirmation, I’ll look to enter a swing long position.
📋 Trade Management:
• Stoploss: Below the 1H–4H demand swing low
• Take Profit:
→ I’ll trail stops and lock in profits aggressively
→ Main target: $119,820
💬 Like, follow, and comment if this breakdown supports your trading! More setups and market insights coming soon — stay connected!
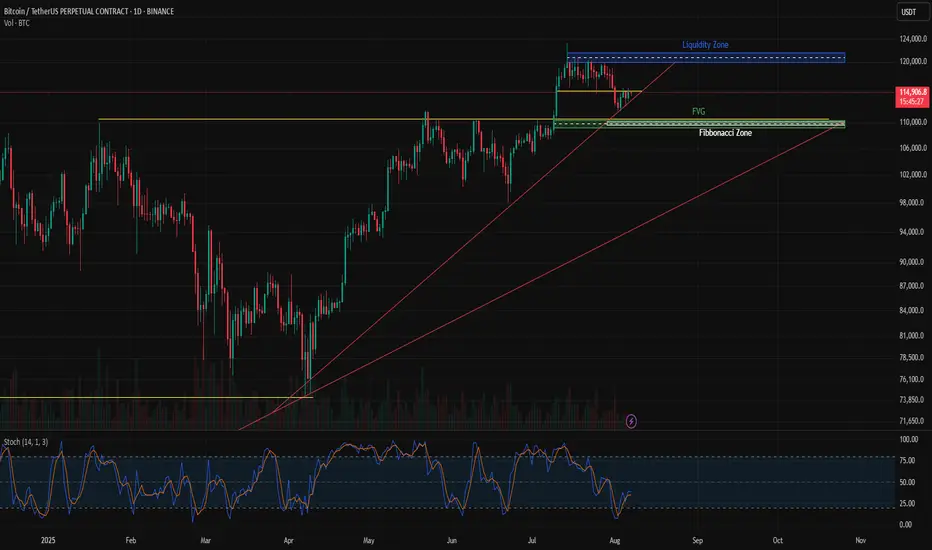
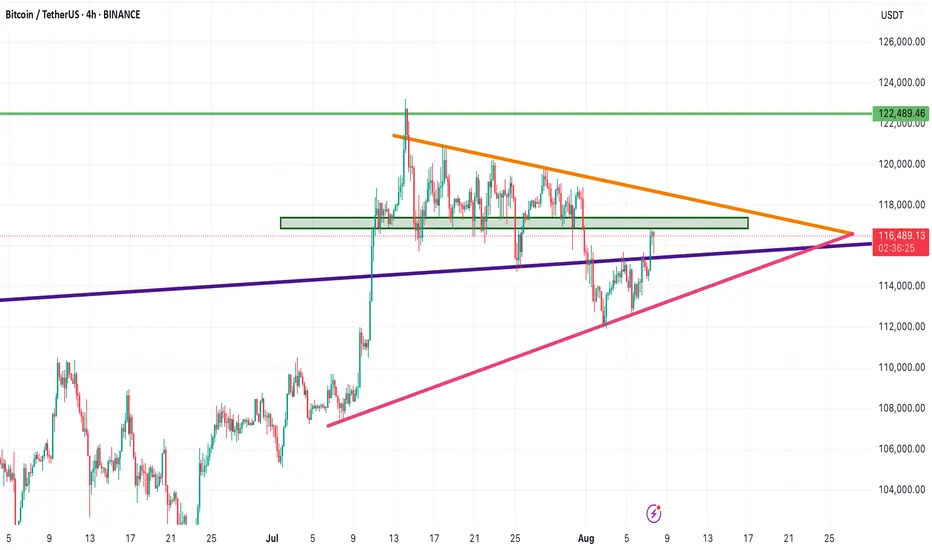
BTC/USDT – Key Zones to Watch: Liquidity Grab or FVG Reclaim?Bitcoin is approaching a critical decision point after consolidating near recent highs. Price has formed a tight range just below a major Liquidity Zone (marked in blue), while sitting on a strong ascending trendline.
🔹 Liquidity Zone (~$121K): This is a key area where stop hunts and fakeouts often occur. If price pushes into this zone without follow-through, expect a possible reversal.
🔹 FVG + Fibonacci Confluence (~$109K–$110K): This green zone is a key demand area. If price retraces, this could act as a magnet for buyers and potentially offer a high R/R long opportunity.
🔹 Ascending Trendline: So far respected well. A break below it could signal weakness and increase the probability of a revisit to the FVG zone.
Scenarios to Watch:
✅ Breakout above Liquidity Zone → Could trigger continuation toward new highs.
🔁 Rejection from Liquidity Zone + break of trendline → Watch for retrace into FVG zone.
📊 Bias: Neutral short term – waiting for breakout or FVG test.
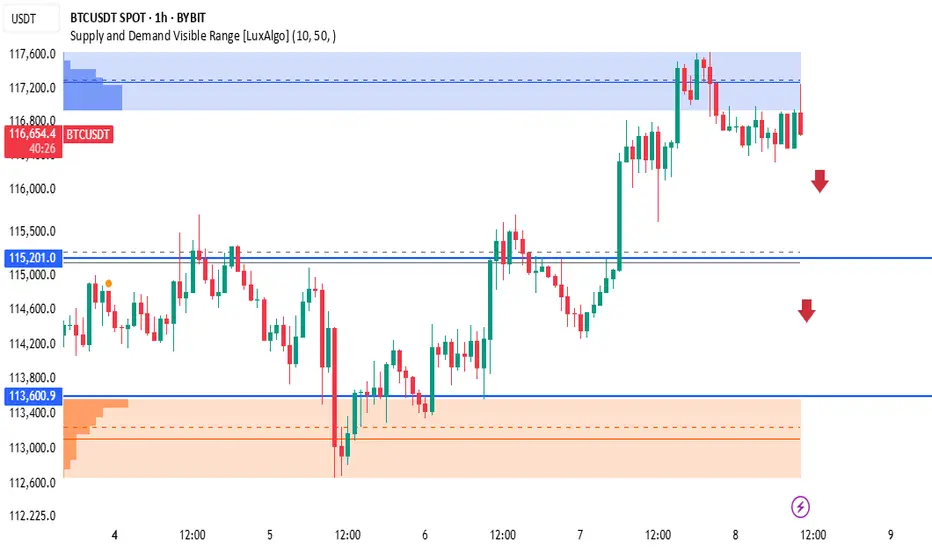
BTCUSDT 1H Supply Zone Rejection – Bearish Setup in PlayIf price fails to reclaim the supply zone, we expect a rejection and drop toward lower demand areas
Price broke market structure previously at 115,201, which now acts as the first major support
🎯 Trade Plan (Sell Idea):
text
Copy
Edit
Entry: Near 116,800–117,000 (within supply zone)
SL: Above 117,300
TP1: 115,201 (support zone)
TP2: 113,600 (high-probability demand zone)
TP3: 113,000 (orange demand base)
Risk:Reward ~ 2:1 to 3:1
🧠 Key Zones:
🔵 Resistance/Supply Zone: 116,800 – 117,300
🔵 Support Zone 1: 115,201
🟠 Strong Demand: 113,000 – 113,600
📌 Notes:
This is a clean reaction setup from a well-defined supply zone using volume profile and price action. Look for confirmation like bearish engulfing or M-pattern on lower TF before shorting.
⚠️ Disclaimer:
This is not financial advice. For educational purposes only. Always do your own analysis and manage risk.
$BTC Head and shoulders forming....elevator to 110kOver the last few days BTC has been in a downward channel and recently got a boost from the not so "free market" Trump's policies to open up highly volatile crypto to people looking to save and retire. One would expect a much bigger spike, but 117k resistance seems to be holding firm and retailers appear to be the exit liquidity for institutions. No crystal ball on where BTC will be, but there will be massive volatility along the way and in the short term 110k (or below) seems to be very much in the realm of possibilities. We're in a recession and all the lagging indicators are showing red flags. Enter BTC at your OWN RISK! If you're up, take your profit. If you're down, check out other strategies (like VIX strategies for downside protection).

BTCUSD long setup: Targeting the next bull move.Hello IGT FOLLOWERS
Here is my BTCUSD overview, Bitcoin is showing bullish momentum after holding strong support near $112,000. A breakout above the $115000 resistance suggests buyers are regaining control. RSI is turning upward, and volume is increasing on green candles signaling demand. As long as price holds above $113,000, bulls may push toward the $117,500 target.
Key points :
Entry point : 113500
1st Target : 115000
2nd Target : 117500
Follow me for more latest updates and signals

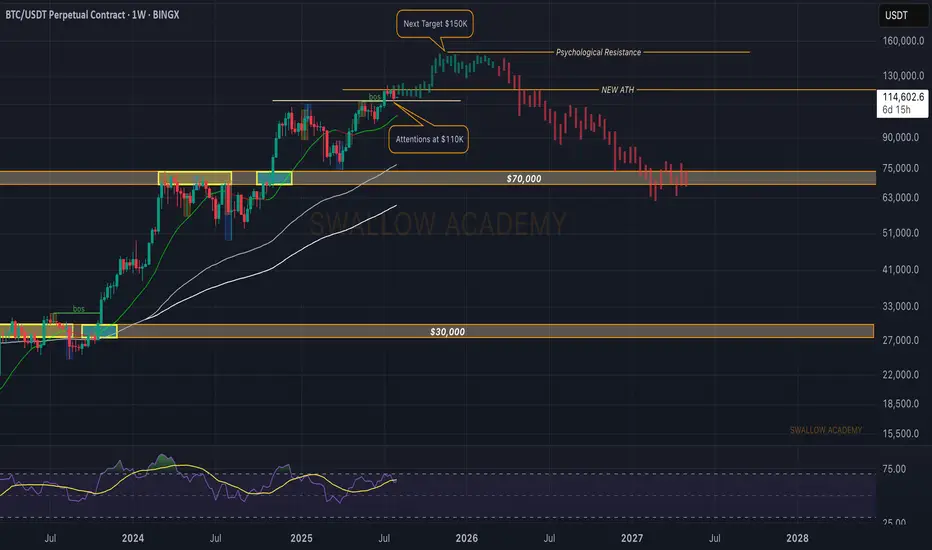
Bitcoin (BTC): Bullish Start of Week | Eyes on $110KOur attentions are currently at $110K on BTC, where we maintain the bullish plan as long as we are above that zone.
This zone is marked as the BOS area for us, where currently we are seeing the price has retested it and bounced right off again, leading the price back to upper zones here.
So once again, as long as we maintain that area, we are bullish; if we break it, we are going to look for that Bollinger Bands middle line!
Swallow Academy
[SeoVereign] BITCOIN BEARISH Outlook – August 10, 2025In the August 10th idea I’m sharing today, I would like to focus on the bearish perspective.
As a swing trader, I am not particularly tied to the major trend, but I believe that this decline is meaningful enough within the short time frame, and I would like to share this perspective with you.
The main bases used in this idea are as follows:
-Harmonic 1.902 Crab Pattern
-Traditional ratio relationships in Elliott Wave Theory (1.618)
-Full Fibonacci 0.618 retracement
Based on this, I have set the average target price at approximately 114,500 USDT.
As time goes by, I plan to add more specific drawings to support this idea so that you can understand it more easily, and if the target price is reached, I will also share the entry price and take-profit price for your reference.
Thank you very much for reading,
and I sincerely wish you an overwhelming amount of strong luck.
Thank you.

End of Bitcoin's Bull CycleEnd of Bitcoin's Bull Cycle: Is October 2025 the Final Peak?
"This is my personal opinion and does not constitute any investment advice."
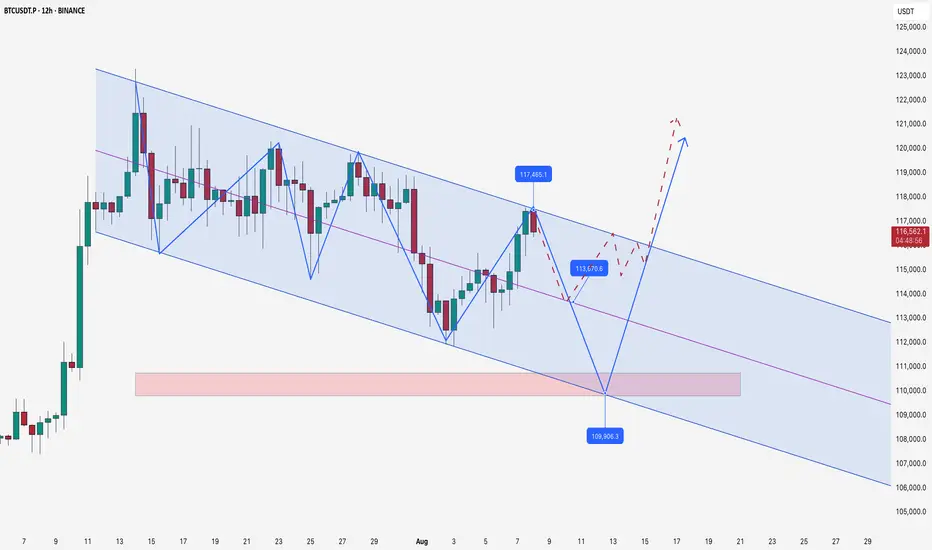
BTC levels for August 2025Simple channel on BINANCE:BTCUSDT.P
retest of equilibrium with main liquidations of 20x - 40x leverages around 113600
this weekend or if we will see some bad macro news drop by end of 12-15 august
109900
keep charts simple
BTC(20250808) market analysis and operationAugust 8th BTC Contract Technical Analysis:
Today, the daily chart closed with a small bullish candlestick pattern, with prices rising above the moving average. The accompanying indicator formed a death cross and showed shrinking volume. The overall upward trend is currently dominant. Although there was a significant pullback at the beginning of this week, it has not continued. However, the upward trend continues, with consecutive highs broken. Positive news and data are driving prices higher. The short-term hourly chart currently shows a series of bearish candlestick patterns and a death cross. This suggests a strong intraday pullback, with support at the 115,500 area. This is a level to watch during the European session. Furthermore, today, Friday, is a cautious market.
Today's BTC Short-Term Contract Trading Strategy:
Sell at the current price of 116,500, with a stop loss at 117,300 and a target of 115,500. Buy if the price does not break below 115,500, with a stop loss at 115,000 and a target of 117,000.

BTC/USDT | Bitcoin Eyes Rebound from $110K Support Zone! (READ)By analyzing the Bitcoin chart on the 4-hour timeframe, we can see that after reaching a new high at $123,218, the price began to pull back and has now corrected down to around $112,500. I expect the current volatility to ease soon. The next critical support zone lies between $110,500–$112,000 — watch price action closely here, as BTC could bounce from this area and push back toward $116,000+. Other key demand zones are located at $109,000, $107,900, and the $105,000–$106,000 range.
Please support me with your likes and comments to motivate me to share more analysis with you and share your opinion about the possible trend of this chart with me !
Best Regards , Arman Shaban

BTC/USD) Bullish trend analysis Read The captionSMC Trading point update
Technical analysis of (BTC/USDT) on the 4-hour timeframe, using Smart Money Concepts and a falling channel breakout approach.
---
Technical Breakdown:
1. Market Structure:
Price has been moving within a descending channel, forming lower highs and lower lows.
BTC just bounced strongly from the Fair Value Gap (FVG) zone, marked in yellow, and the lower boundary of the channel, suggesting a potential trend reversal.
2. Key Levels:
FVG (Demand Zone): Between ~112,000–114,000 — price reacted from this zone with clear bullish momentum.
200 EMA (114,799.70): Price is currently below it, but if it reclaims this level, it will strengthen the bullish setup.
Target Point: ~123,287–123,327 — aligns with the upper boundary of the channel and previous resistance.
3. Projected Price Path:
Step 1: Price is expected to retest the mid-channel resistance and potentially break above.
Step 2: If confirmed, BTC may rally toward the 123k+ target zone, continuing the trend reversal.
4. RSI (14):
RSI is currently at 42.70, moving up from oversold territory (33.05 low), which supports a bullish reversal.
No bearish divergence seen, indicating room for upside.
Mr SMC Trading point
---
Trade Idea Summary:
Bias: Bullish
Entry Confirmation: Strong bounce from FVG and bullish candle close above 114,800 (EMA)
Target Zone:
TP1: 118,000 (channel midline)
TP2: 123,327.97 (channel top / resistance zone)
Invalidation: Close below 112,000 or breakdown of channel and FVG
Indicators: RSI recovery + strong volume bounce supports bullish scenario
plesse support boost this analysis)

Bitcoin Technical Analysis | August 7, 2025 Bitcoin Technical Analysis | August 7, 2025
After a corrective move to the $112,000 support zone, Bitcoin bounced back and is now moving along a rising trendline (highlighted in pink). As long as the price holds above this line, the bullish structure remains intact.
🔸 Currently, BTC is approaching a key resistance zone between $117,500 and $118,600, which aligns with the descending orange trendline on the chart. If this zone is broken with confirmation, the next potential targets will be:
$122,400
and $129,500
🔻 However, if the price gets rejected from this resistance:
The first support lies at $115,570
Breaking below that, the next support will be the purple trendline
A confirmed break of the bullish structure could push BTC down to $110,524
📌 Conclusion:
Bitcoin is nearing the apex of a symmetrical triangle pattern. A breakout in either direction could define the next major move. Make sure to mark these critical levels on your chart and adjust your trading strategy accordingly.
What is likely going to happen.BTC close back inside the range(S/R flip)
The liquidity above 119k is likely going to get tapped if BTC holds inside the range.

BITCOIN PREDICTION: a SECRET PATTERN is FORMING (watch out)!!!Yello paradisers! In this Bitcoin prediction, I'm updating you about the crash we predicted earlier in previous videos. I'm showing you on a high timeframe chart the ABC corrective mode wave; we are now forming the C wave. The C wave subdivides itself into five smaller waves because it's a motive mode wave. We are taking a look at the volume. We understand that bears are still in power, so we are waiting for some nice volume from bulls. We are spectating a bullish divergence on the MACD indicator. On RSI, there is exaggerated bullish divergence, and in stochastic RSI, we are in an oversold area.
Then, we are shifting our focus to a medium timeframe. We are zooming into the fourth wave, where we are making our sub-waves right now. On the medium timeframe, we are also spectating bearish divergence. We are waiting for the second booby that will basically increase the probabilities of absorption.
As we have seen previously, that helped us to predict that Bitcoin will be crashing. We are also taking a look at our head and shoulders target, which is at $109,000.
Then we are shifting our focus to a lower timeframe, where we are seeing the secret pattern, triple three. Right now, we are creating a sub-wave XX, which is forming itself as a possible zigzag. Paradisers, make sure that you are trading professionally, focus on long-term growth, and avoid get-rich-quick schemes. Any shortage in trading usually ends up sooner or later in bankruptcy.
Remember, don’t trade without confirmations. Wait for them before creating a trade. Be disciplined, patient, and emotionally controlled. Only trade the highest probability setups with the greatest risk to reward ratio. This will ensure that you become a long-term profitable professional trader.
Don't be a gambler. Don't try to get rich quick. Make sure that your trading is professionally based on proper strategies and trade tactics.

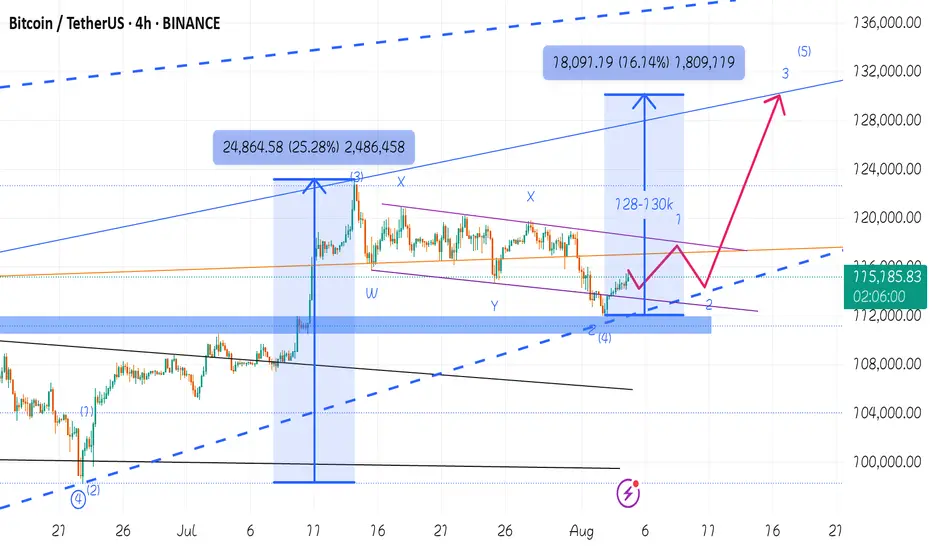
You don't know what's going on , 130K waiting for youI have shown in my previous post that Bitcoin is looking for a correction of wave 4 from wave 5 of the main wave 3 of Elliott waves, I said wait for 112k and then buy altcoins. It seems that the Elliott wave 4 micro-wave has completed its correction with the 50% Fibonacci percentage, I predict Bitcoin will touch the 128-130k levels at the end of Elliott wave 5. as I said before altcoins season is in the midway
btc signalThe analysis went well, but put the breakeven and would you like me to put more signals? I would be happy to hear your comments.Two signals and two profits. Thank you for your attention.

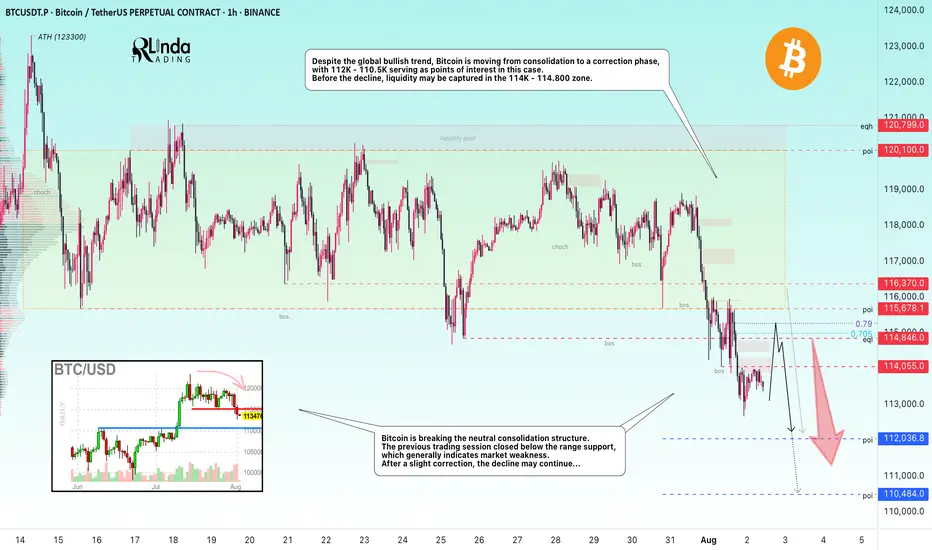
BITCOIN → From consolidation to distribution. Market weaknessBINANCE:BTCUSDT.P is moving from consolidation to a correction phase. The price broke through the support zone of 114.5–115.5, closing within the Friday trading session in the sell zone...
Previous idea from July 22: BITCOIN → Consolidation and compression to 116K. Correction?
The fundamental background is shifting to neutral, the hype has temporarily ended, and there are no bullish drivers yet. And for the health of the market, a correction is needed. Bitcoin is breaking the neutral consolidation structure. The previous trading session closed below the support range, which generally indicates market weakness. Despite the global bullish trend, Bitcoin is moving from consolidation to a correction phase, with 112K - 110.5K serving as points of interest in this case. Before the fall, liquidity may be captured in the 114K - 114.800 zone.
Resistance levels: 114.05, 114.85, 115.67
Support levels: 112.03, 110.48
After a strong movement, the market may enter a correction or local consolidation, during which it may test the specified resistance zones before continuing its downward movement to the zone of interest and liquidity at 112 - 110.5.
Best regards, R. Linda!