U.S. Pensions Enter Crypto Amid Quantum Threat to BitcoinThis week, U.S. President Donald Trump signed an executive order allowing retirement 401(k) plans to invest in cryptocurrencies, as well as private equity and real estate. The move opens the door for digital assets to tap into the $12 trillion U.S. retirement savings market.
A Watershed Moment for Institutions
Integrating cryptocurrencies into retirement plans could be a historic step toward recognizing digital assets as a legitimate asset class. Younger investors, in particular, stand to benefit from exposure to high-growth, long-term instruments. However, financial advisors caution that cryptocurrencies remain highly volatile and should be part of a diversified investment strategy.
Risks and Opportunities
While expanding crypto access through pension plans offers significant upside, it also raises questions around regulation, investor protection, and fee transparency. Past market downturns have shown that excessive exposure to volatile assets can harm savings during periods of instability.
The Quantum Threat to Bitcoin
Parallel to the pension plan news, experts are increasingly discussing the potential threat of quantum computing. According to Barron’s, by the mid-2030s, technological advances could compromise the cryptographic security of older Bitcoin addresses. While approximately 75% of BTC is already stored in more modern, secure wallets, the industry is accelerating the development of quantum-resistant protocols.
Defensive Strategies
Blockchain developers — including the Bitcoin Core and Ethereum Foundation teams — are testing post-quantum cryptography algorithms to ensure long-term security. The objective is to stay ahead of technological breakthroughs that could otherwise undermine digital asset safety.
Conclusion
The U.S. decision to allow crypto investments in pension plans is a milestone for the industry, signaling maturity — but it also presents new regulatory challenges. Meanwhile, the quantum computing threat serves as a reminder that the crypto sector must invest not only in growth, but also in securing its foundational infrastructure.
USDTBTC trade ideas

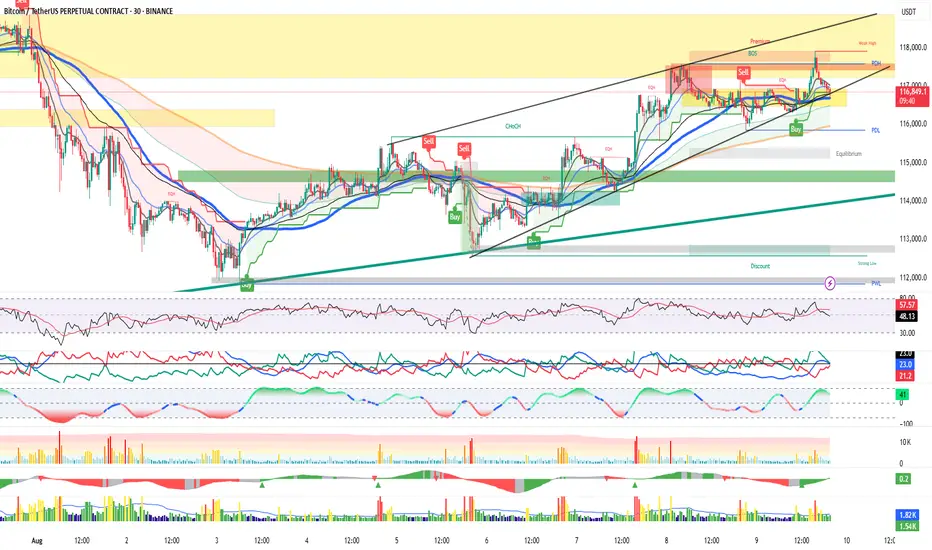
BTC/USDT — All-in-one MTF Map & Trade Plan (30m/4H/1D/1W)Summary: HTF uptrend intact; price is compressing inside a rising channel just under 117.4–117.6 (PDH/supply/premium edge). Intraday path: hold 116.7–116.9 → retest 117.4; lose 116.7 → slide to PDL/EQ.
Structure
Weekly: HH/HL above trendlines; weak high ~120k remains a magnet if 118k clears.
Daily: Riding 21/50D EMAs in an ascending channel; shallow pullbacks bought.
4H: Repeated rejections at 117.4–117.6; higher lows along inner trendline.
30m: Tap of channel/EMA confluence 116.7–116.9 after a PDH sweep; momentum neutral.
Key Levels
R1: 117.4–117.6 (PDH/EQH)
R2: 117.9–118.2
R3: 119.6
R4: 120.0k (weak high/liquidity)
S1: 116.9–116.7 (trendline + EMAs)
S2: 116.1 (PDL)
S3: 115.5–115.0 (Equilibrium block)
S4: 114.9–114.4 (demand)
S5: 112.8–112.2 (discount/“strong low”)
Momentum / Volume
RSI mid-50s (room either way).
ADX ~23 (trend mild) → next break likely expands.
Sell wicks at PDH; lighter pullback volume favors bounce if S1 holds.
Setups (If-Then)
Breakout Long: 30m/4H close >117.6 → 117.9/118.2 → 119.6 → 120k.
Invalidation: swift slip <117.2.
Range Long (buy the dip): Bullish reaction at 116.7–116.9 → 117.0 → 117.4–117.6.
Invalidation: 30m close <116.7.
Breakdown Short: Clean 30m close <116.7 then <116.0 → 116.1 → 115.5–114.6; stretch 112.8.
Invalidation: reclaim >116.9.
Bias: Neutral-to-bullish above 116.7 (look for 117.4 retest / 118k squeeze). Bearish below 116.7, targeting PDL → EQ. Wait for edge breaks; avoid mid-range chop 117.0–117.3.
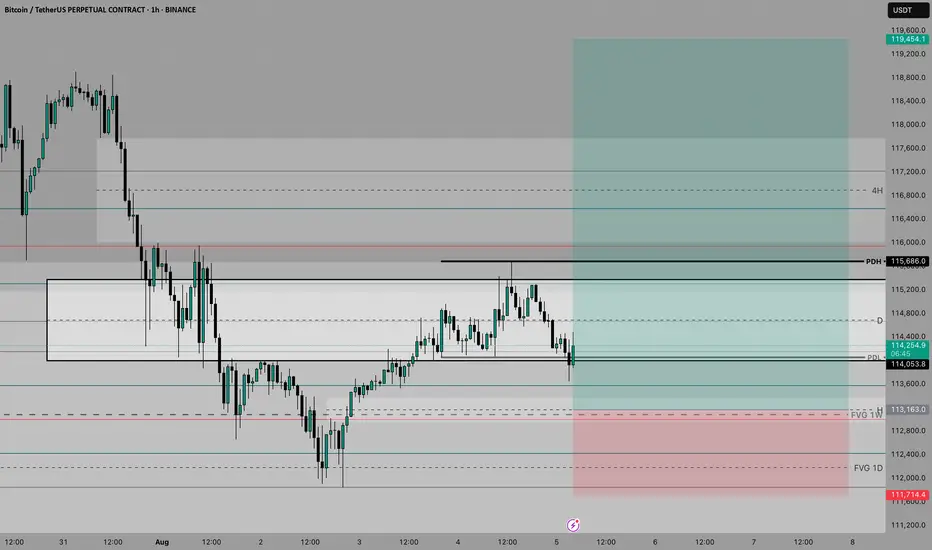
Equal highs sweptBTC has just swept the previous daily relative equal highs whilst re balancing a 4 hour fair value gap.
Expecting a pull back to 115,880 💪

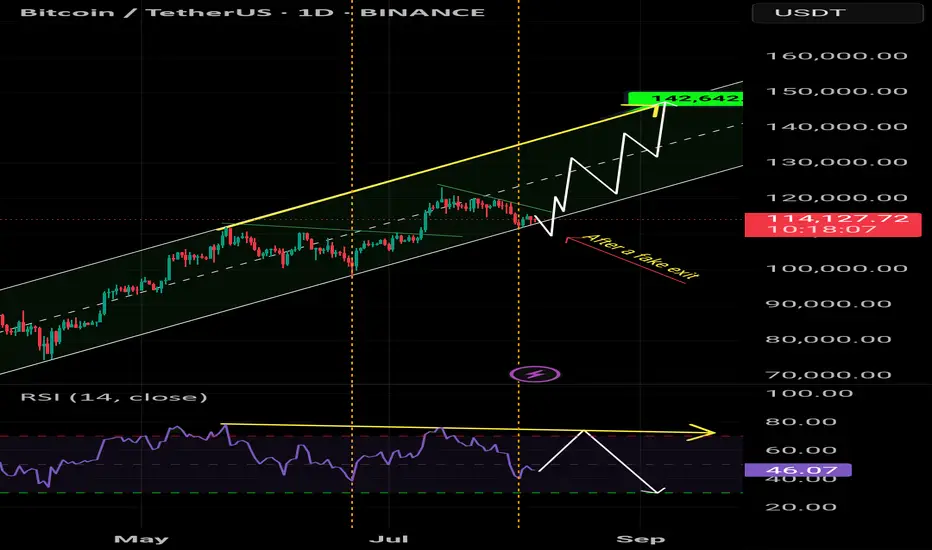
Bitcoin Go 140kAfter a fake exit and a trick, it goes strongly towards the ascending channel and liquidates everyone. The target for Bitcoin is 140,000.
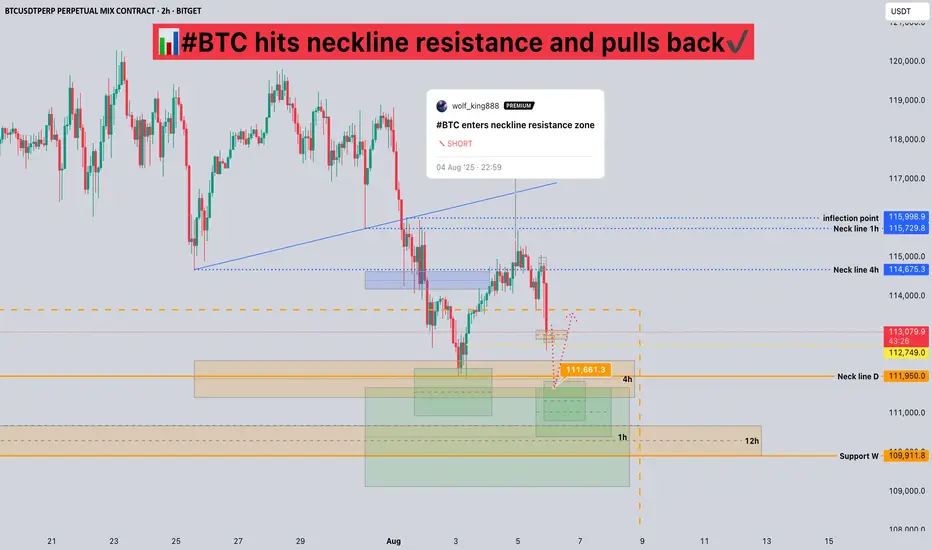
#BTC hits neckline resistance and pulls back📊#BTC hits neckline resistance and pulls back✔️
🧠From a structural perspective, we've retreated after hitting resistance at the neckline, as expected. If the current structure continues to decline rapidly, we could potentially retest support near 112,000, or perhaps break below the previous low to sweep liquidity before rebounding.
➡️The resistance zone remains clear. Only if the neckline resistance zone is broken and stabilizes for a day or so can we maintain a positive bullish stance.
Let's see 👀
🤜If you like my analysis, please like 💖 and share 💬 BITGET:BTCUSDT.P
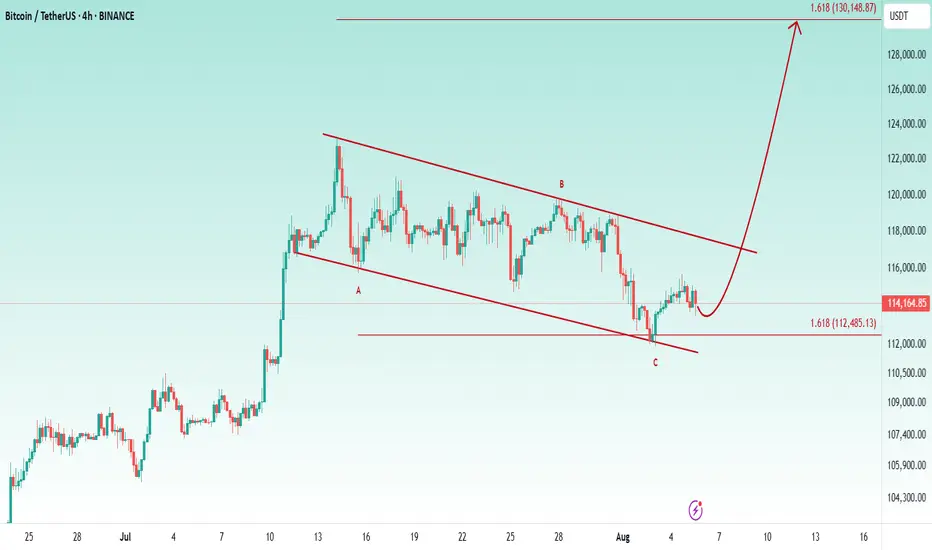
New Bullish Rally About To Start Toward The 130k🔥 Well, the previous update played out perfectly — the price dropped to the $12K support area and bounced back strongly. Now, let’s talk about my next plan for Bitcoin
📥 At the moment, there’s a clear bullish flag forming on the chart. Price has bounced from the 1.618% PRZ (Potential Reversal Zone), which I’ve labeled as wave C of the larger corrective ABC structure.
📈 From here, I’m expecting a new bullish rally, with the next major target around $130K.
BTC/USDT🩸 CRYPTOCAP:BTC ⁀➷
$Bitcoin. Macro chart Another
💯 Intermediate Target — 60 500 $
🚩 Macro Target 1 — 55 000 $
🚩 Macro Target 2 — 47 000 $
🚩 Macro Target 3 — 37 000 $
- Not financial advice, trade with caution.
#Crypto #Bitcoin #BTC #Investment
✅ Stay updated on market news and developments that may influence the price of Bitcoin. Positive or negative news can significantly impact the cryptocurrency's value.
✅ Exercise patience and discipline when executing your trading plan. Avoid making impulsive decisions driven by emotions, and adhere to your strategy even during periods of market volatility.
✅ Remember that trading always involves risk, and there are no guarantees of profit. Conduct thorough research, analyze market conditions, and be prepared for various scenarios. Trade only with funds you can afford to lose and avoid excessive risk-taking.

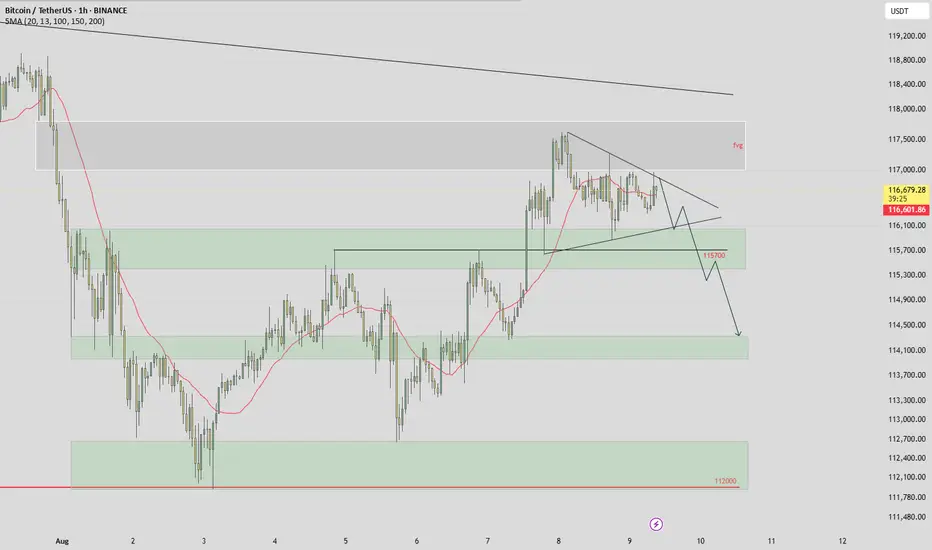
btcHello
My opinion is that the market trend is bearish.
We are currently in a compression pattern, and if we can break this pattern to the downside and establish a strong candlestick below the price of 115,700, the bearish scenario will be activated.
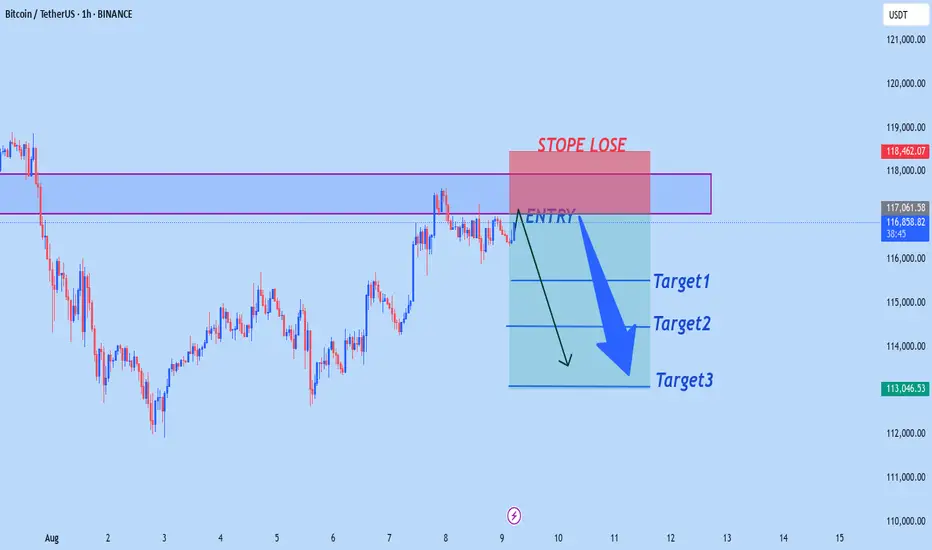
BTCUSD NEW OUTLOOKBtcusd sell from117,000
Target1 115,500
Target2 114,500
Target3 113,000
Stop Lose 118,500
TRADE AT YOUR OWN RISK
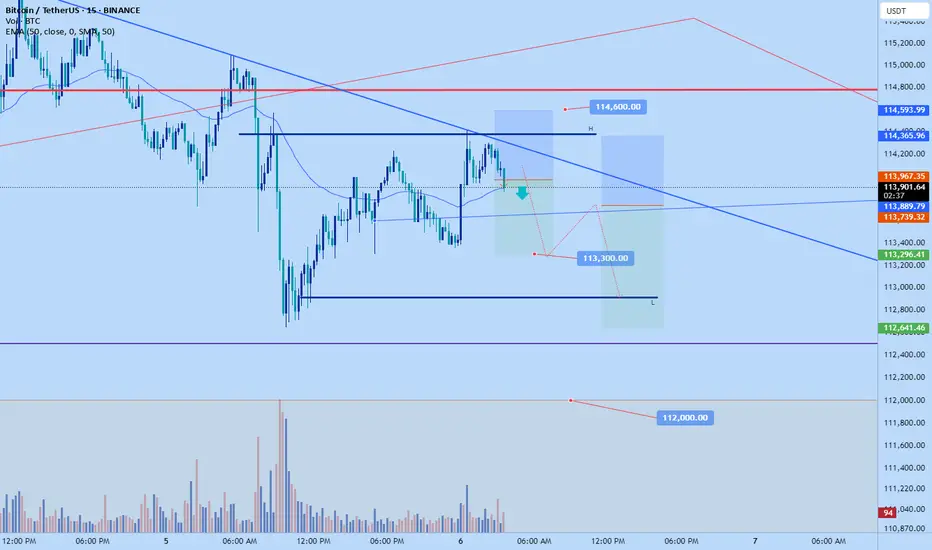
Bitcoin scalp short then main shortJust now opened a scalp short position on #bitcoin. Anticipating another push down to $113300 just in time for another likely correction back up in new york session to dump back down again
Sl: 114,600
TP: 113300
BTC 4H Ascending Support Retest, Will Supply Zone Reject Again?BTC has been respecting this ascending trendline since late June, with buyers stepping in each time price approached support. Now, price is hovering just above the trendline while the upper supply zone remains a strong ceiling. A clean bounce here could push us back toward 120K resistance, but a breakdown would likely open the door to a deeper pullback toward the June demand zone. Bulls need to defend this level decisively to avoid losing the uptrend momentum.

$BTC 1HR TA CRYPTOCAP:BTC Survived the pressures of war and tariffs and bounced well off the 112 zone. The market proved the bulls still have control.
But It's Friday and we know the markets tend to get pull back and get choppy... I'm expecting CRYPTOCAP:BTC to pull back some.

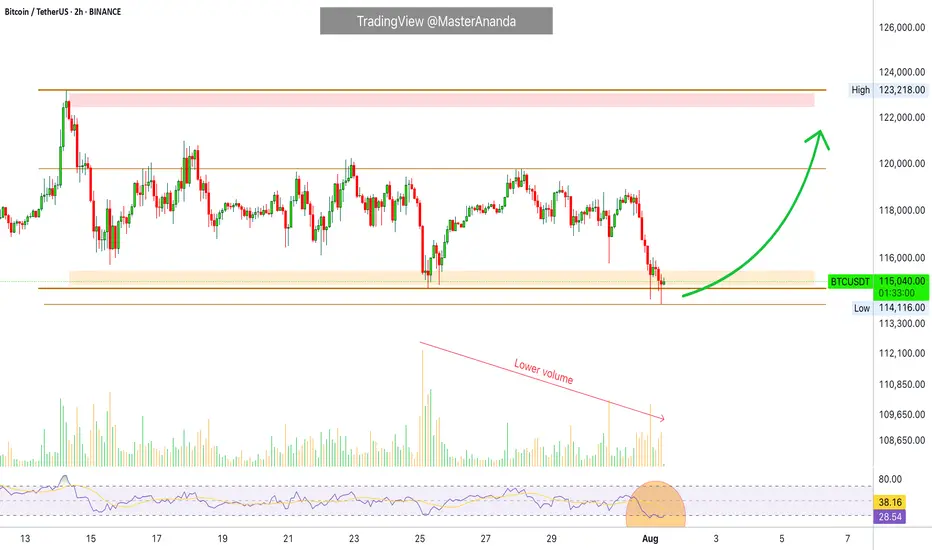
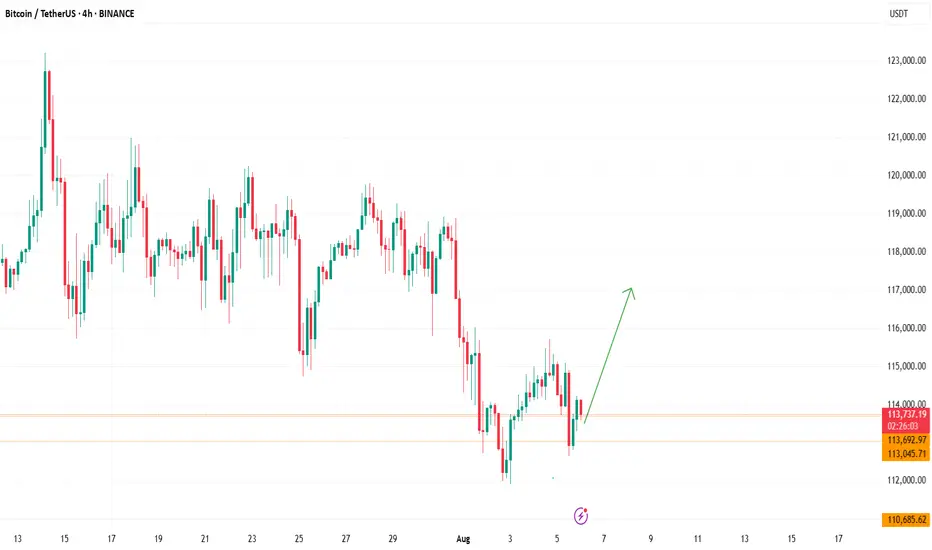
Bitcoin Hits $40,000, It Will Recover —Name Your AltcoinSorry, there is a typo there on the title, I meant to say: Bitcoin hits $114,000, soon to recover.
As you can see from our trading range, Bitcoin just went beyond the lower boundary and hit a new low, the lowest since 10-July but there is good news. There isn't room for prices to move much lower, this is part of the consolidation phase.
The first low happened 25-July and notice the high (bear) volume. The second low happens today and we have lower volume compared to 25-July, but Bitcoin hit a lower low. This reveals that the bearish move is already weak and losing force. It also reveals the fact that Bitcoin is about to recover.
Also notice the RSI, 2H. It hit oversold recently and went the lowest in a long while. Reversals tend to happen when the RSI becomes oversold.
Bitcoin is testing the lower boundary of the trading range, when this happens, the action reverses and moves back up. Prepare to see Bitcoin back above $120,000. It is normal and it will happen... But it is wise to give the market a few days. 5-August was bad last year. It gets bad but it also marks the bottom. Once the bottom is hit, growth long-term.
— Name Your Altcoin
Leave a comment with the altcoins you are holding now and I will do an analysis for you. The altcoins will also recover and we are witnessing just a small retrace. Hold strong as this is the most important part. We will have a very strong new bullish wave develop within days.
As Bitcoin moves to test support, it will reverse to test resistance next. Which one is your top altcoins choice?
Thank you for reading.
Namaste.
BTC_TRADING IDEA 08/01/25So we had a nice retracement. I’m now patiently waiting in a discount zone, aiming for a MTF LQ.
I have plenty of reasons to wait here:
– FVG
– OB
– OTE
If it doesn’t play out, I’ll look for another PD Array.
Let’s see!
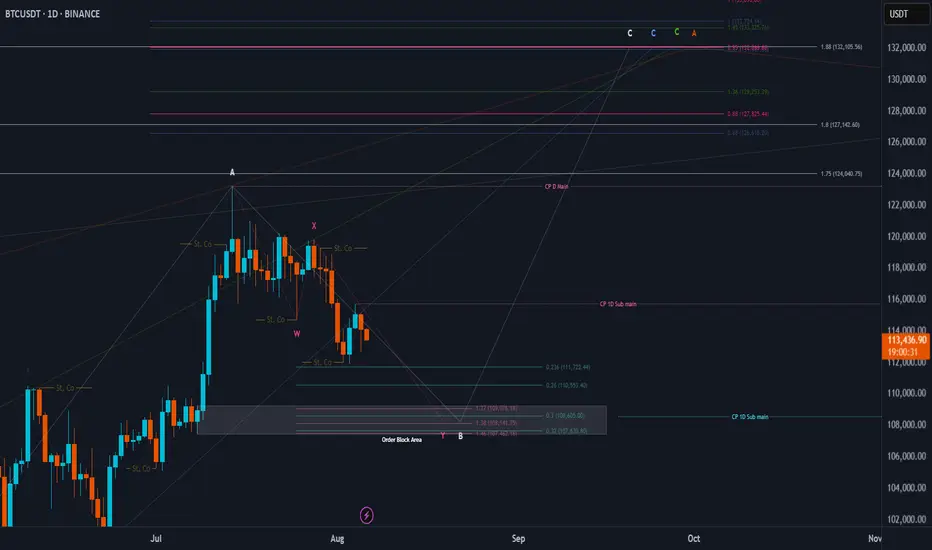
BTC Price Prediction and Elliott Wave AnalysisHello friends,
>> Thank you for joining me in my analysis.
* For the biger imagination of the BTC path, we are still moving into the Orange wave A of the final Green C for ABC from its begining.
* For the smaller imagination of the BTC path, we are still moving into the Blue wave C of the final Green C for the upper Orange wave A.
* For the tighter imagination of the BTC path, I think we are still moving into the correction wave B for the upper Blue wave C.
>> Now we are moving in this Pink wave C for this correction B wave.
Keep liking and supporting me to continue. See you soon!
Thanks, bros
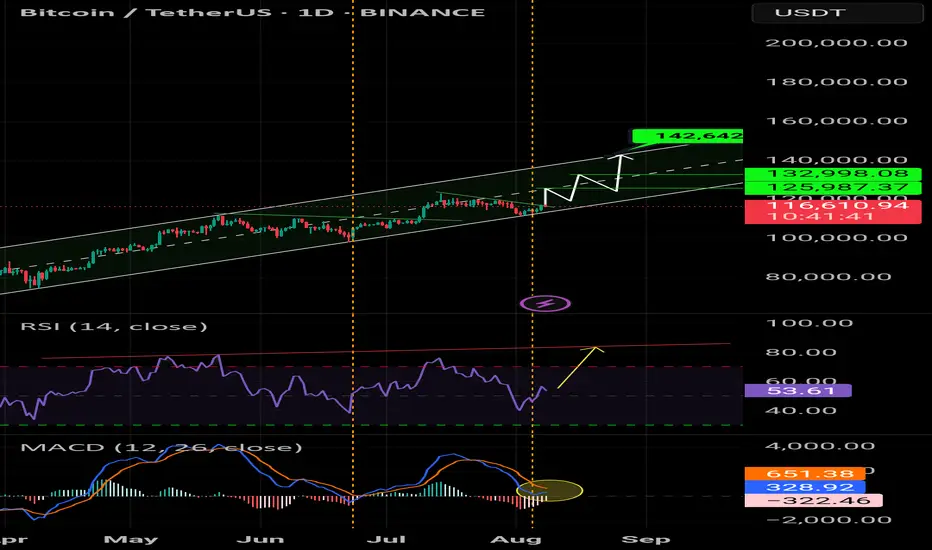
Bitcoin Go 140kAfter a strong break of the trend line, it is ready to launch to the targets of 125,000, 132,000, and 142,000. The MACD and RSI also gave a bullish signal.
125000
132000
142000
🤪🤪🤪
BTC/USDT Analysis – Continued Growth
Hello everyone! This is the daily update from a CryptoRobotics trader-analyst.
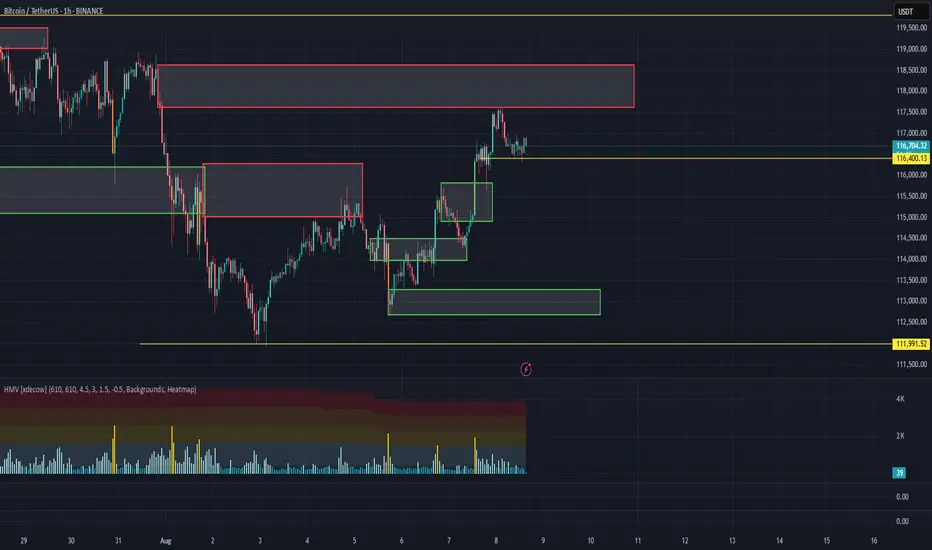
Yesterday, Bitcoin tested the local volume area at $115,800–$114,900 and then continued its upward movement, reaching the lower boundary of the strong resistance zone at $117,600–$118,600 (accumulated volume), followed by a pullback.
Currently, the price is hovering around the volume support zone near ~$116,400. Selling pressure is relatively weak and is being absorbed by buyers — which is confirmed by delta data. This makes it reasonable to expect another wave of buying and a deeper test of the resistance zone. After that, we’ll watch closely for the seller’s reaction.
Buy zones:
• ~$116,400 (local volume support)
• $113,300–$112,700 (local absorption of selling)
• $110,000–$107,000 (accumulated volume)
Sell zone:
• $117,600–$118,600 (accumulated volume)
This publication is not financial advice.
BITCOIN CRASH PREDICTED! HERE’S WHAT HAPPENS NEXT! (scary)Yello Paradisers, Bitcoin crashed exactly as we predicted in the previous videos that it will happen with the highest probability.
In this video I am explaining to you what's gonna happen next.
Head and shoulders, neckline, is be breaking to the downside, we need a clear confirmation of a reclaim Our channel on high timeframe is getting breakout to the downside and confirmation was that a reclaim was already successful.
In this video I'm sharing with you Elliott Way theory on low timeframe and what needs to be done for confirmation perspective in order for us to continue to go to the downside or have a reversal to the upside.
Don't be a gambler. Don't try to get rich quick. Make sure that your trading is professionally based on proper strategies and trade tactics.

Next Volatility Period: Around August 13th (August 12th-14th)
Hello, fellow traders!
Follow us to get the latest information quickly.
Have a great day!
-------------------------------------
(USDT 12M Chart)
A lot of money has been flowing into the coin market through USDT.
A decline in USDT indicates capital outflow from the coin market.
(USDT.D 12M chart)
As USDT continues to rise, its dominance naturally rises.
However, if USDT is used to purchase coins (tokens) in the coin market, its dominance will decline.
USDT dominance peaked in 2022 and is showing a downward trend.
This indicates that a significant amount of capital flowing into the coin market was used to purchase coins (tokens).
USDT dominance is expected to fall to around 2.84 this year before beginning an upward trend, marking the end of its three-year bull market.
I believe this trend will inject new vitality into the coin market.
For the coin market to maintain an upward trend, USDT dominance must remain below 4.91 or show a downward trend.
If this fails and the price rises above 4.91, the coin market is likely already in a downward trend.
A decline occurred on May 8, 2025, creating a reverse trend.
To maintain this reverse trend, we need to see if it can fall below 4.24.
If USDT dominance declines, the coin market is likely to show an upward trend.
------------------------------------------------------
(BTCUSDT 1D chart)
As the new week begins, the HA-High indicator on the 1W chart is showing signs of forming a new level at 114454.57.
Accordingly, the key question is whether the price can rise after finding support in the 114454.57-115854.56 range.
The formation of the HA-High indicator means that the price has fallen from its high.
This also means that further declines are highly likely.
Therefore, if possible, the price should rise above the 114454.57-115854.56 range and maintain its upward momentum.
This period of volatility is expected to last until August 6th.
Therefore, the key question is whether the price can rise above the 114454.57-115854.56 range after the volatility period.
If not, we assume the price will decline until it meets the HA-Low indicator and consider countermeasures accordingly.
This is because the HA-Low and HA-High indicators are paired.
As the price declines, indicators such as the HA-Low or DOM(-60) may appear.
Therefore, if the price declines, you should monitor for the emergence of indicators such as the HA-Low or DOM(-60).
The basic trading strategy is to buy between the DOM(-60) and HA-Low ranges and sell between the HA-High and DOM(60) ranges.
-
If the price falls below the M-Signal indicator on the 1D chart, it is highly likely that the trend will be re-established upon meeting the M-Signal indicator on the 1W chart.
Therefore, if the price fails to rise to the 114454.57-115854.56 range, it is highly likely that the price will eventually meet the M-Signal indicator on the 1W chart.
At this time, a key support and resistance level is expected to be around 108353.0.
When new support and resistance levels are formed, they must remain horizontal for at least three candlesticks to function as support and resistance.
In other words, the HA-High indicator on the 1W chart is showing signs of forming, but it hasn't yet.
Therefore, if the current price holds this week, it will form next week.
Therefore, for the HA-High indicator to function properly as support and resistance, it must remain horizontal for three candlesticks, or three weeks.
This rule must be acquired through significant time and observation.
-
If you sold partially in the 115854.56-119177.56 range according to your basic trading strategy, you will find it easier to observe the current movement. If not, you will likely become anxious.
The key to trading is maintaining a stable psychological state.
If you begin to feel anxious, you should consider how to stabilize your psychological state.
Otherwise, you'll end up making the wrong trades.
-
Thank you for reading to the end.
I wish you successful trading.
--------------------------------------------------
- Here's an explanation of the big picture.
(3-year bull market, 1-year bear market pattern)
I'll explain more in detail when the bear market begins.
------------------------------------------------------

Plan $BTC - 08/08/2025Daily timeframe (D)
📍 Price is reacting at the resistance zone.
📌 Triple-top pattern → price has shown a decent recovery, retesting the previous support zone at 117k – 117.5k before reacting.
⚠️ Only consider short positions if the lower timeframes form a clear bearish structure.
✅ Prefer looking for pullbacks to long, as the previous daily candle showed strong buying momentum.
H4 – H1 timeframe
🎯 Long target: 118k (Fibonacci extension 1.618).
📌 Long entry zones:
1️⃣ 116k1xx → H1 base + EMA34 test.
2️⃣ 115k – 115k4xx → Support zone + Fibonacci 0.5 retracement. → Can also long selected altcoins: CRYPTOCAP:XRP , $HEADEL, CRYPTOCAP:AVAX , $APT.

BTC 8H – Fib Support Holds, Will Bulls Defend This Reclaim Zone?Bitcoin is back at a key decision point on the 8H chart — retesting the exact zone it broke out from just two weeks ago. This former resistance has flipped to support, but with momentum cooling off, bulls need to step in fast to avoid a deeper retrace.
🔹 Structure & Levels
Price is hovering inside a reclaimed range (blue box), retesting it from above.
Just below sits the Golden Pocket (0.5–0.618) retracement zone from the July rally — a classic bounce zone if the reclaim fails.
The 0.5 level at $110,879 aligns with previous consolidation structure, adding extra confluence.
Further below lies the 0.786 at $103,802, which marks invalidation for most swing long setups.
🔹 Momentum Check
The Stoch RSI has started curling down from overbought, suggesting momentum may stall short term.
If bulls can’t defend the current reclaim zone, we could see a flush into the Fib pocket before trend continuation.
🔹 Bias & Trade Idea
Holding this level = bullish continuation toward $118K–$120K range highs.
Lose it cleanly = watch for signs of reversal inside the golden pocket.
Risk is defined, structure is clear — and BTC has a habit of reacting cleanly to these zones.
Are you buying the dip now — or waiting for a cleaner tag of the Fib levels?
Drop your thoughts 👇

BTC/USDT NalysisThis is a full BTC/USDT market analysis including all technical indicators, chart patterns, trend analysis, and strategies for potential long/short entries.