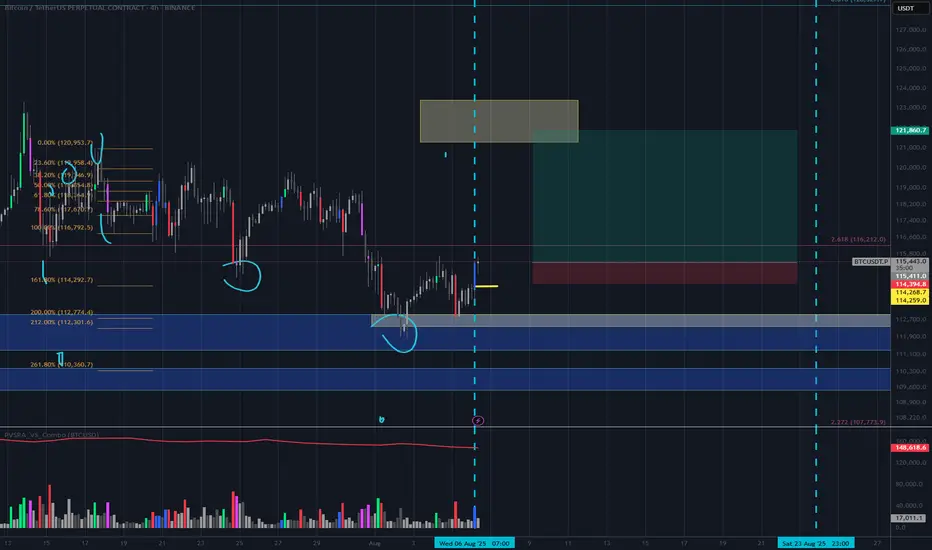
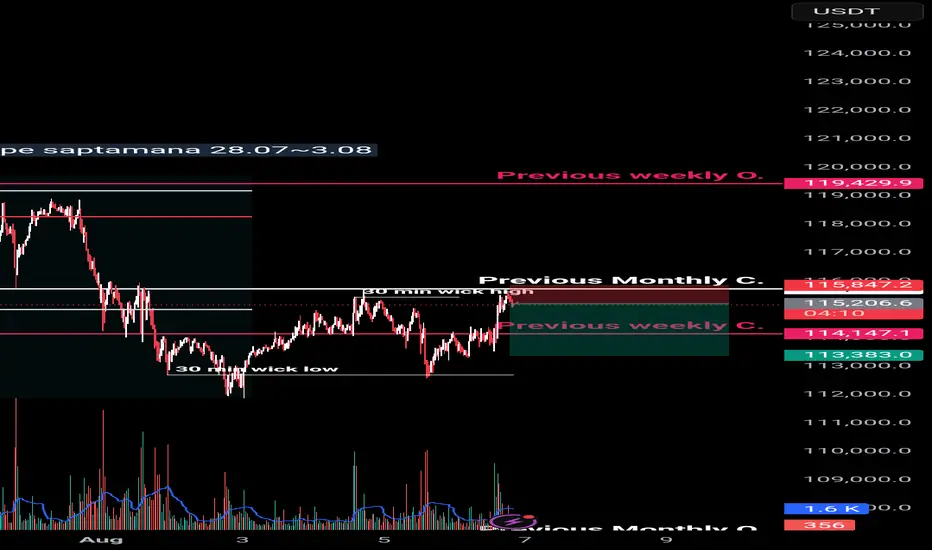
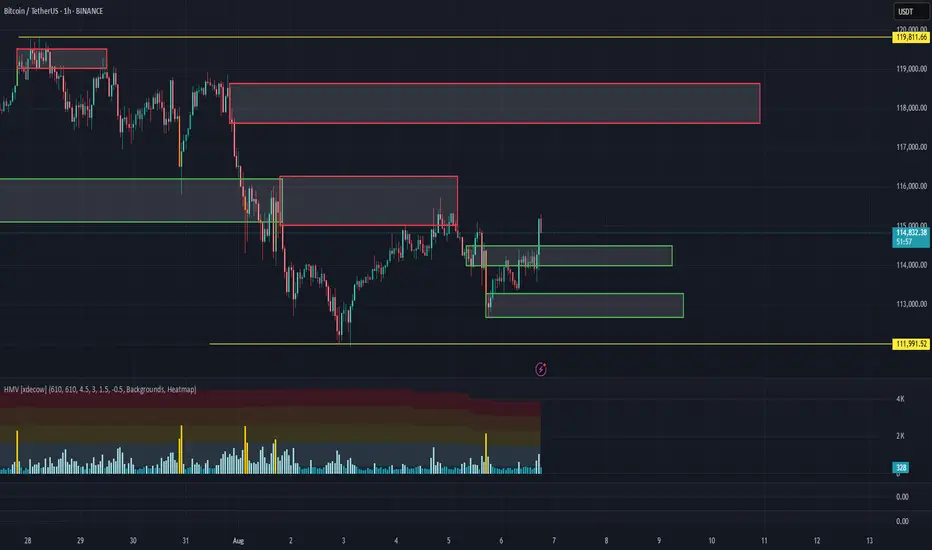
BTC long with stop lossA leg of our strategy says price will return to broken threshold candle price levels. Meaning the corresponding price candle to the volulme bar that broke threshold will have price back within that candles open and close range; at some point in time. Things get kind of shaky below 15minute with my script but nonethe less we will use our stop loss just below the candles open at 114268. yellow line
USDTBTC trade ideas
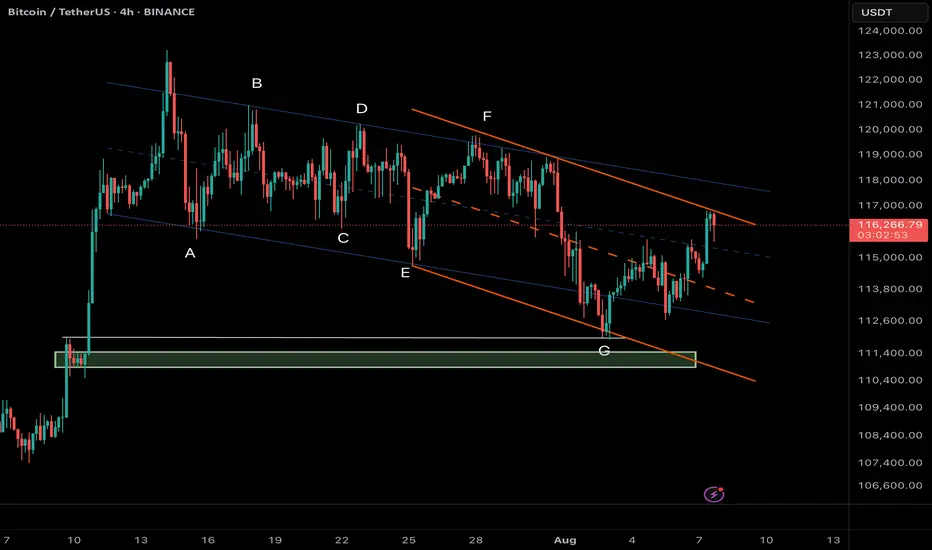
Bitcoin (BTC/USDT) – Bearish Scenario Remains in Focus4H Chart Analysis – Structural + Price Action Insight
Bitcoin is currently trading inside a descending minor channel (orange), which is part of a larger complex correction pattern, potentially a contracting running flat or diametric in NeoWave context. The sequence A to G may suggest that the market completed its G-leg after bouncing off the lower support.
Now, BTC has reached the upper boundary of the orange channel, which aligns with a strong resistance zone around 116.8K–117K.
⸻
✅ Primary Scenario (Bearish Bias):
As long as BTC fails to break and sustain above 116,800 – 117,000, the current move can be interpreted as a pullback within the correction, with high probability of price heading back toward the green liquidity/support zone near 110,800 – 111,400.
This could be a continuation of the broader corrective structure, or even the beginning of a new downward cycle.
⸻
❗ Alternative Scenario:
If bulls manage to break above 117,000 with strong momentum and confirmation (e.g., breakout + retest), the structure may shift bullish with short-term targets near 118,500 – 120,000.
⸻
🎯 Key Takeaways:
• Watch price action closely at the current resistance zone.
• Bearish confirmation (e.g., bearish engulfing, rejection wicks, or supply absorption signs) is required before considering short entries.
• High R:R setups emerge near channel extremes with clear invalidation levels.
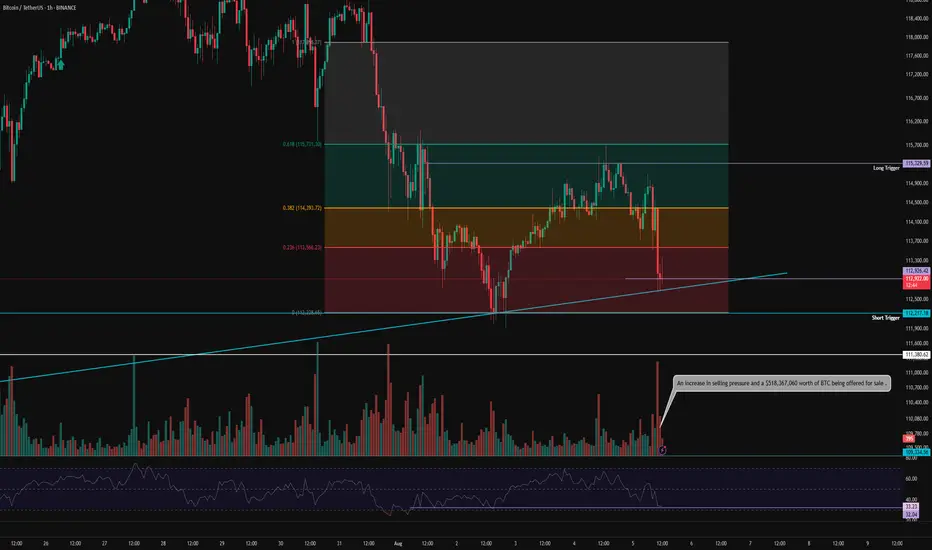
BTC 1H Analysis – Key Triggers Ahead | Day 2💀 Hey , how's it going ? Come over here — Satoshi got something for you !
⏰ We’re analyzing BTC on the 1-hour timeframe .
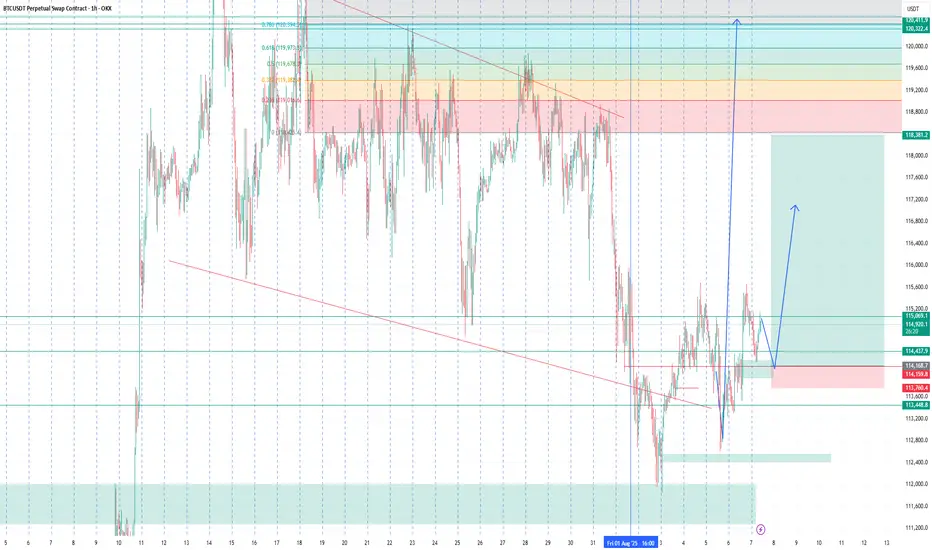
👀 After the strengthening of the US dollar , Bitcoin experienced a drop and formed a short-term support bottom around the $113,000 level . It is currently completing a pullback to the levels of this recent decline .
🎮 Our Fibonacci retracement is drawn from the breakout zone to the $112,200 bottom . Bitcoin broke below the 0.236 level and then found support . The best potential entry trigger, based on Fibonacci, is at the 0.382 level, or around $115,000 . If Bitcoin breaks above this level , it could form a higher high and a higher low in this timeframe .
⚙️ The RSI is showing a support level around 32 , which is currently preventing Bitcoin from entering the oversold zone . However , if this support is lost , Bitcoin could move into oversold territory .
📈 Our long position trigger is at the 0.382 Fibonacci level . A confirmed breakout of this level , combined with RSI overbuying and increased volume , would be our entry signal .
📉 Our short position trigger is around $113,000 . If this support breaks , we may open a short position . However, the main short trigger is at the 0 Fibonacci level ( support at $112,200 ) . If selling pressure increases and RSI enters the oversold zone , we will consider entering a short position with confirmation .
❤️ Disclaimer : This analysis is purely based on my personal opinion and I only trade if the stated triggers are activated .
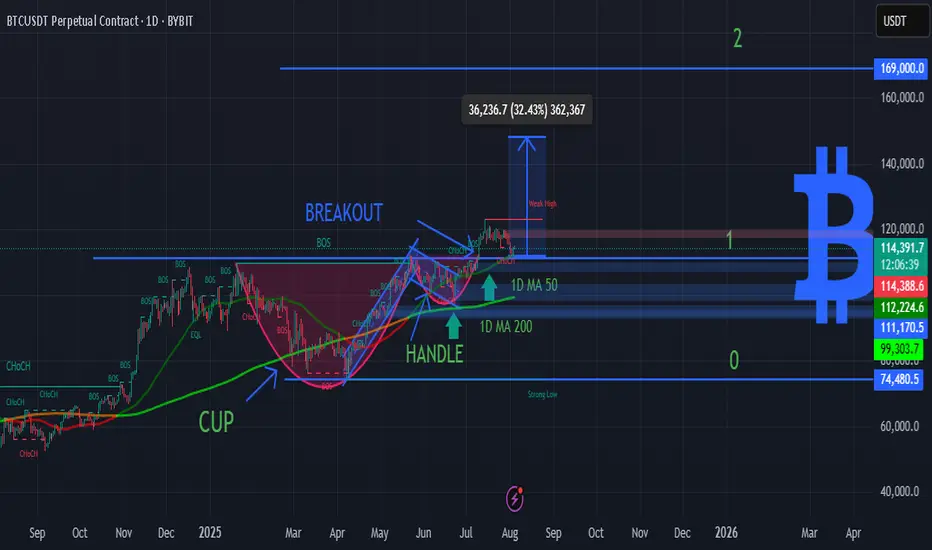
BTC DAILY - CUP & HANDLE BREAKOUT TARGETING $169KBitcoin just confirmed a macro Cup & Handle breakout with a strong push above the $112K neckline. The price is now consolidating above key moving averages – setting up for a potential explosive continuation. 🔥
🟢 Technical Highlights:
📈 Cup & Handle pattern – classic bullish continuation
💥 Breakout target: +32% move → $169,000
🟩 1D MA 50 / MA 200 acting as dynamic support
🔄 MACD bullish cross confirming momentum
🟦 Breakout above major resistance = new market structure zone
🧲 Psychological support near $99K and $112K
***********************************
🎯 Buy Signal Details:
Entry Zone (Pullback Valid): $112,000–$114,000
Take Profit: $169,000 🎯
Stop Loss: $99,000 🛡️
Buy Confidence: 95% ✅
📌 Not financial advice. This is pure chart-based technical analysis.
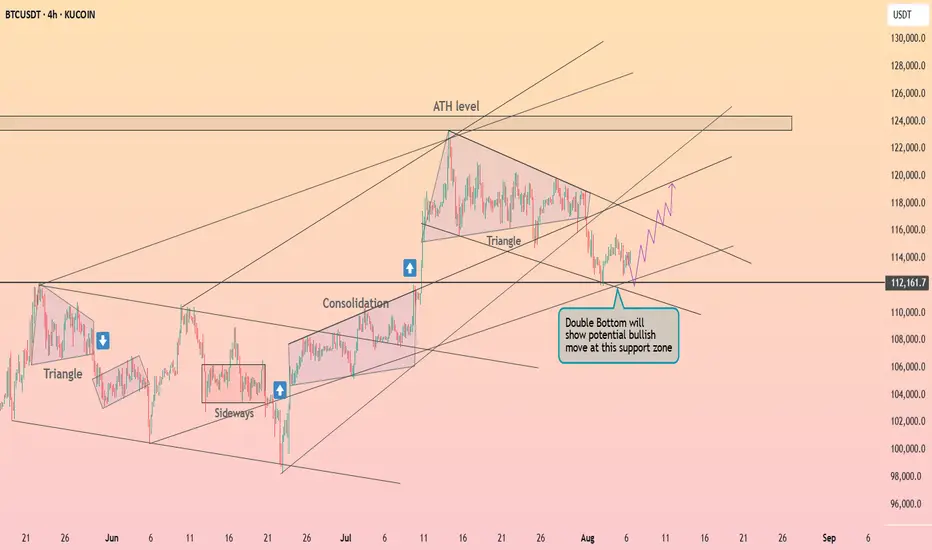
Bitcoin is forming a double bottom ┆ HolderStatKUCOIN:BTCUSDT is bouncing from 112,000 support, forming a potential double bottom. The setup aligns with prior bullish continuations from similar consolidation zones. A push toward the ATH region could follow if buyers remain in control.
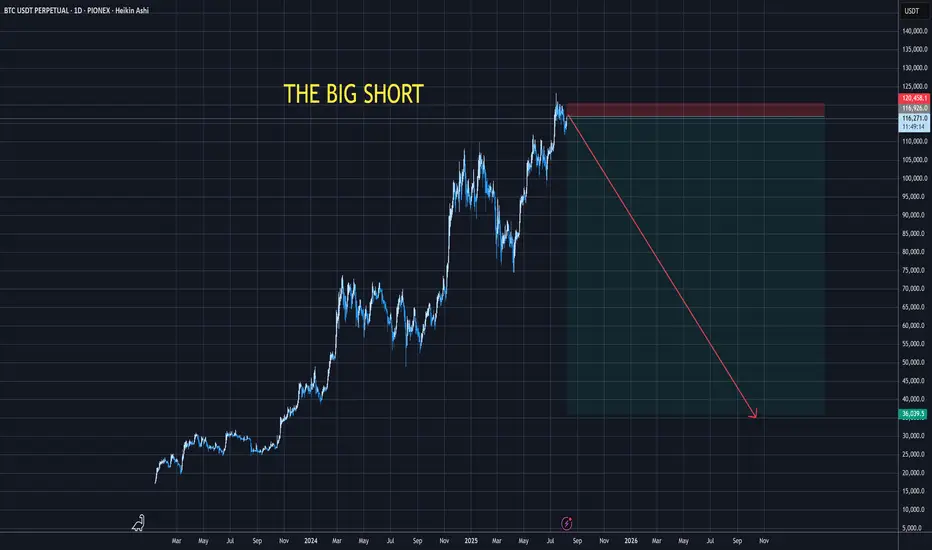
The Big Btc Shortposting this for the fun of it if its correct
i know its not a popular belief, that the top is in
but
we will see
the idea is basically that we had 12345 up and A down to 73k and overshooting B to new ath.
and now the big 5 waves down to 786 or so
BTC BUYBitcoin in “interesting spot” during support retest
Bitcoin price comparisons keep coming as market participants see similarities between current market structure and earlier in the bull run.
Bitcoin Price Prediction 2025–2030 | EMA & MACD AnalysisBitcoin trades near $114K in August 2025, sitting below EMA 9 and EMA 15 while holding above the EMA 200. The MACD shows weakening momentum, but support at $114K remains firm. This analysis highlights key support and resistance levels ($114K, $120K, $125K) and outlines scenarios for September, with long‑term forecasts pointing toward $300K–$350K by 2030.

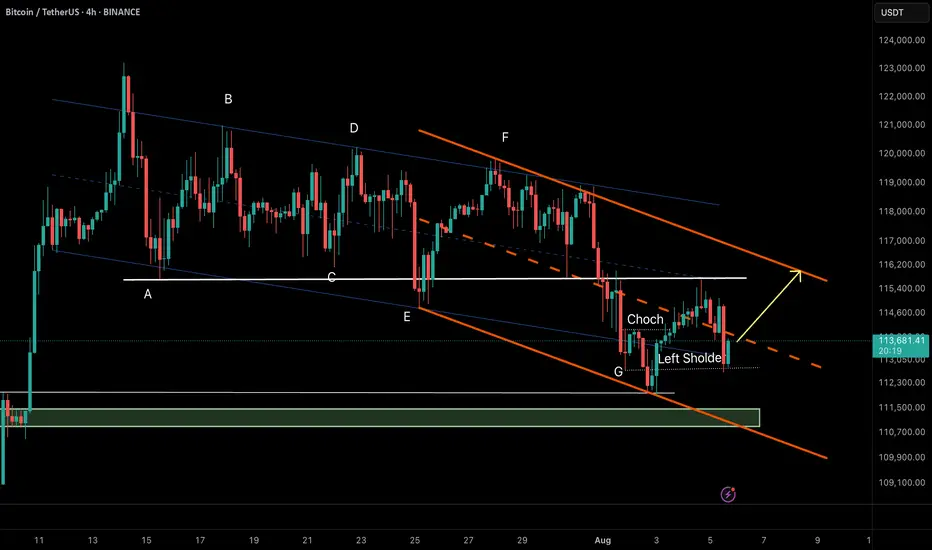
Bitcoin (BTC/USDT) – RTM Reversal Pattern in Action🔸 Market Structure:
Bitcoin has formed a descending channel after a prolonged correction. Recently, price tapped the channel bottom and printed a CHoCH (Change of Character), indicating a potential reversal.
The price has now retraced to the left shoulder of a potential inverse head & shoulders pattern—an RTM classic structure—which held as support, suggesting bullish continuation.
⸻
🔸 Key Technical Signals:
• ✅ CHoCH confirmed at demand zone near $112,300
• ✅ Retest of the left shoulder validates bullish structure
• ✅ Holding above the internal bullish trendline
• ✅ Price aiming toward upper channel resistance
⸻
🎯 Target:
$116,200 – Top of the descending channel & next key resistance.
❌ Invalidation:
Break and close below $112,800 would invalidate the current RTM setup and open room for deeper correction.
⸻
📌 Summary:
This is a textbook RTM reversal:
CHoCH → Retracement → Left Shoulder Test → Continuation
As long as the structure holds, we remain bullish toward the channel top.
BITCOINTHE daily structure of the bitcoin shows a break out of the daily ascending trendline ,but on 4hrs we are protected by 4hr ascending trendline line ,the daily sr/rs level holds superior opinion of price action than any intraday time frame .so trade with care and know that any key level on 4r/3r can fail while contesting with daily TF and weekly structure.
#bitcoin #btc

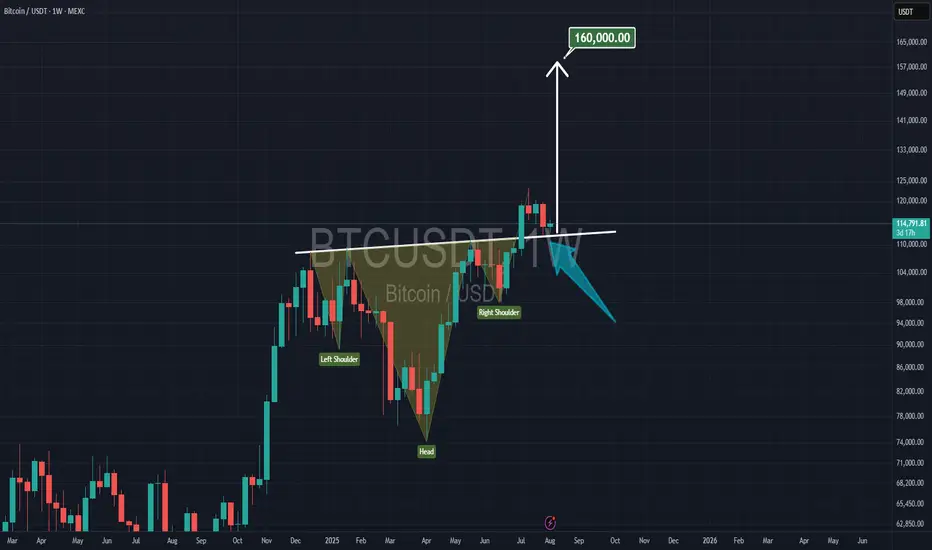
Bitcoin inverted HEAD & SHOULDERSIf this is an inverted HEAD & shoulders pattern for bitcoin, then the neckline is already broken and bitcoin is Back testing that now, well the target is $160k as well
BITCOIN THE daily structure of the bitcoin shows a break out of the daily ascending trendline ,but on 4hrs we are protected by 4hr ascending trendline line ,the daily sr/rs level holds superior opinion of price action than any intraday timie frame .so trade with care and know that any key level on 4r/3r can fail while contesting with daily TF and weekly structure.
#bitcoin #btc

$BTC bouncing over crucial support!CRYPTOCAP:BTC is currently pulling back from the $123K resistance area, heading toward a major confluence support zone between $107K–$110K, which aligns with:
✅ Previous breakout zone
✅ 0.5–0.618 Fibonacci retracement
✅ Lower bound of the ascending channel
✅ 200 EMA support
This level is expected to attract buyers and act as a strong base for the next bullish leg.
Price dips into the $107K–$110K support
Look for a bullish reversal (reaction candles or bullish divergence)
Target 1: $128K – retest of resistance
Target 2: $132K – upper boundary of the ascending channel
CRYPTOCAP:BTC remains within a healthy bullish structure.
This pullback is constructive, not bearish.
The $108K–$110K zone is a high-probability long setup — wait for bullish confirmation before entering.
A daily close below $106.8K would invalidate the structure and open up downside risk.

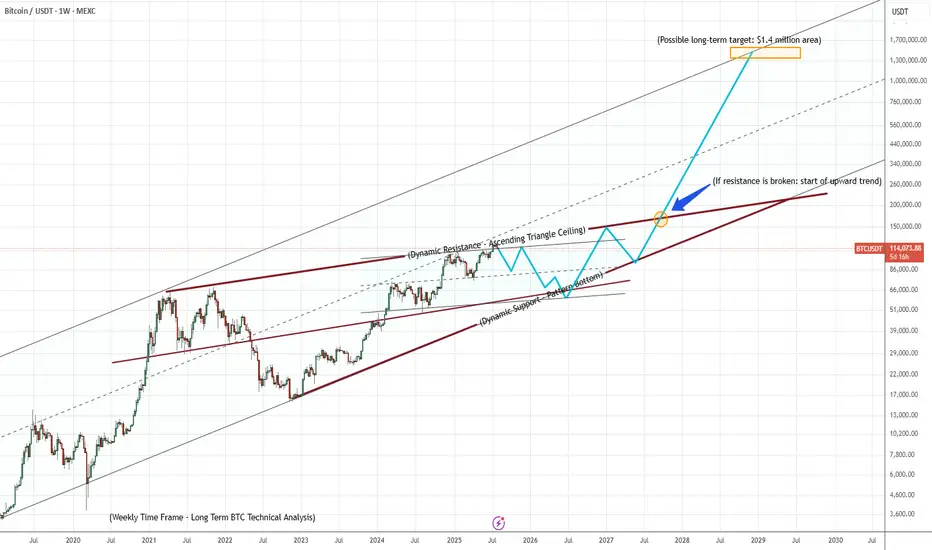
BTCUSDT – Ascending Triangle Completing the Path!📊 Bitcoin is currently forming an ascending triangle, clearly marked in bold red.
This zone is showing high volatility and provides great Buy/Sell opportunities for traders. 🔄
📈 If the price breaks out above the resistance line, we can expect a strong bullish move, following the path highlighted in blue polyline, with potential to reach the long-term target of 🔹 1.4 million USDT. 🚀
📌 If you listen closely, this chart’s basically yelling: “Something’s coming...” 🎧👀
🧭 Next move will define the trend — don’t blink.
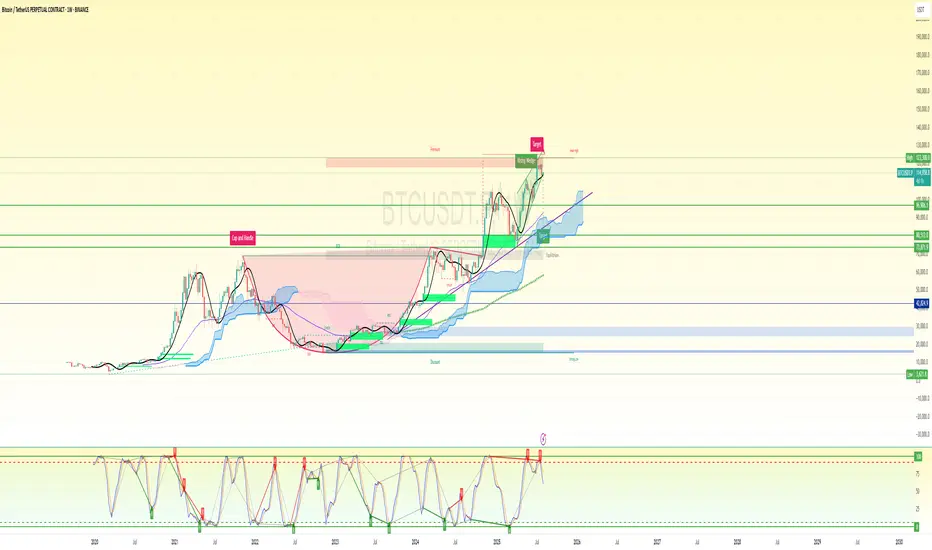
BTC SHORT SET UP (only facts in the chart)📌 Chart Summary
Price: ~$115,000
Pattern: Rising Wedge (Bearish)
Macro Structure: Completed Cup & Handle
Stochastic RSI: Overbought + Bearish cross confirmed
Ichimoku Cloud: Price far above cloud – extended
EMA/MAs: Bullish but overstretched
🧠 Bias-Free Most Probable Setup (Weekly Outlook)
🟥 Bearish Sniper Setup — High Probability
The chart is showing rising wedge exhaustion + Stoch RSI bear cross in extreme overbought = probable correction ahead.
🔽 Short Entry Plan (Sniper Setup)
Entry (Short): $114,200 – $116,000
Ideal sniper zone inside the wedge breakdown area / resistance rejection zone
Stop Loss: $123,000
Above wedge top and key psychological resistance
Take Profit 1 Range: $96,000 – $99,000
Previous major horizontal resistance zone and wedge support retest
Take Profit 2 (final target): $80,500 – $83,000
Major structure zone + Ichimoku cloud top + high-volume node
Risk:Reward: 1:3.5 to 1:5+
📈 Alternate Scenario: Bullish Breakout Setup (Low Probability but noted)
If BTC breaks and closes above $123,000 on weekly, wedge invalidates and opens target:
Breakout Target: $143,000 – $150,000
Based on wedge measured move + Fib extension
⚠️ Additional Confluences Supporting Bearish Bias:
Weekly RSI + Stoch RSI overbought and curling down
Rising wedge near exhaustion
Bearish divergence risk with higher highs in price, lower oscillator momentum
Volume is declining despite price rising – exhaustion signal
🧩 Strategic Notes:
Avoid longing here unless $123K clean break + volume spike
Best play = wait for confirmation of wedge breakdown to enter short
Leverage carefully – this is a macro weekly timeframe setup
BITCOIN PREDICTION: THIS Breaks - and BTC WILL CRASH TO HERE!!!!Yello Paradisers! I’m sharing my Bitcoin prediction with you. We’re using technical analysis on TradingView, specifically Elliott Wave theory.
On the ultra-high time frame, we noticed a Shooting star candlestick pattern. We’re analyzing the channel where the zigzag formation is occurring.
We’re also looking at bearish divergence on the ultra-high time frame chart and the zigzag on the high time frame chart. There’s a bullish divergence visible there. The Fibonacci level at $108,000 is also noteworthy, as is the volume, which shows that bears are still in control on the medium timeframe. We’re also analyzing the head and shoulders target plus bearish divergence on the low time frame. On the low time frame, we’re looking at the impulse of the flat C, which is an expanded flat and is currently creating its fourth wave.
Remember, don’t trade without confirmations. Wait for them before creating a trade. Be disciplined, patient, and emotionally controlled. Only trade the highest probability setups with the greatest risk to reward ratio. This will ensure that you become a long-term profitable professional trader.
Don't be a gambler. Don't try to get rich quick. Make sure that your trading is professionally based on proper strategies and trade tactics.

From Fakeout to Takeoff: How the V-Pattern REALLY WorksEver seen a support level break, only for the price to rocket back up in a V-shape? That’s the V-Pattern in action! In this post, Skeptic from Skeptic Lab breaks down the step-by-step mechanics of this powerful setup. From the fakeout that traps short sellers to the surge of buy orders from liquidations, you’ll learn exactly how buyers flip the script and create explosive reversals. Perfect for traders looking to spot high-probability setups. Join me to decode the markets—check out the steps and level up your trading game!

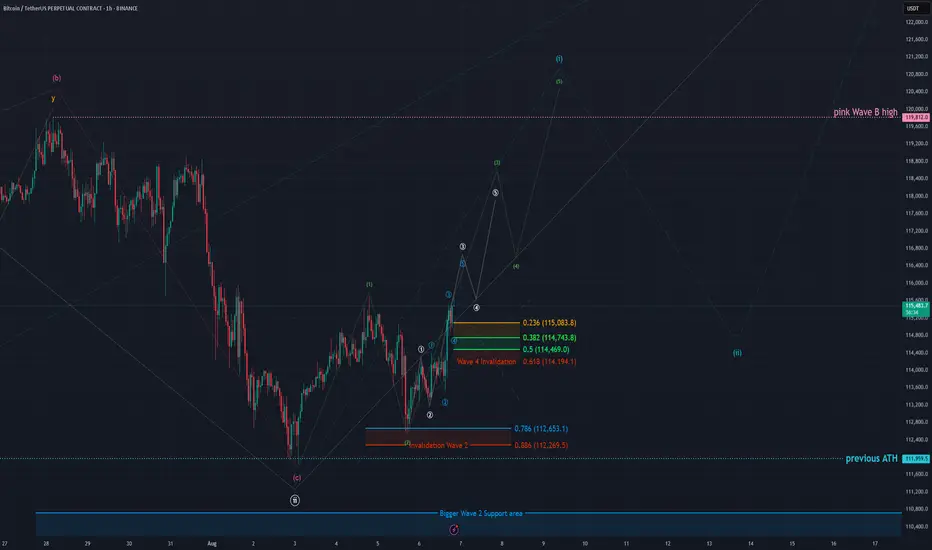
BTC - 1H Elliott Wave Analysis - 06.08.25Welcome to our Elliott Wave Count for Bitcoin!
We have seen a decent reaction to the upside from our Wave 2 support area.
We did remove the bearish red Wave count even if it hasn't been strictly invalided yet but we think it keeps the chart cleaner. Additionally if we take the recent high at 115'686 USD we would have an overlap of red Wave 2 and 4 which would decrease the probabilities of the bearish count.
It appears that we held the Wave 2 support and got a decent reaction to the upside.
At the moment we are continue to see the price surge to the upside.
We did add some Elliott Wave counts displayed each in 5 Waves in turquoise, white and green to help keep track of the price development.
Additionally we added a provisional support area for Wave 4 of the white count.
It sits between the 0.5 FIB at 114'469 USD and the 0.236 FIB at 115'083 USD with the invalidation at the 0.618 FIB at 114'194 USD.
Be aware that the support area moves with the price surging.
Preferable we stay above that support area.
Thanks for reading.
We would appreciate a follow and boost if you like the analysis! :)
NO FINANCIAL ADVICE.
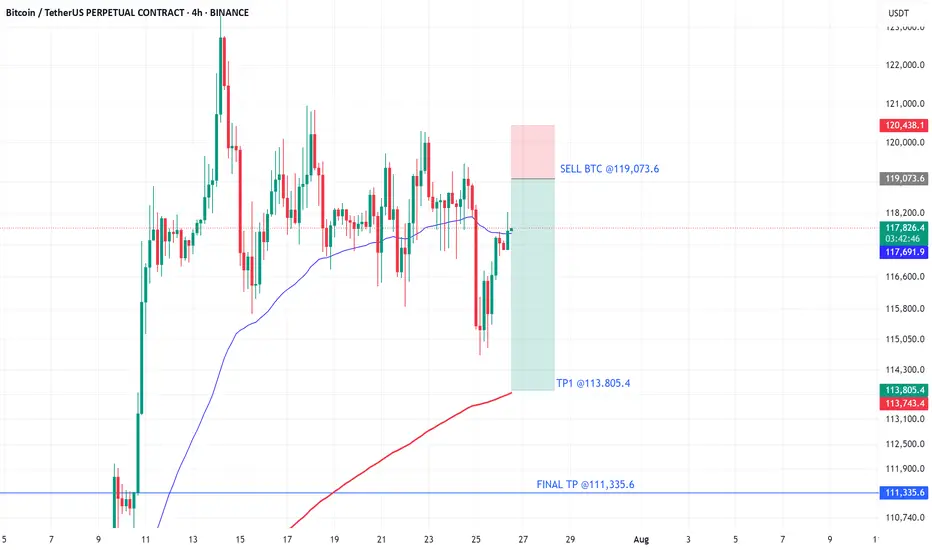
EXPECTATION THAT BTC WILL FALL IS VERY HIGHThe area im looking to sell BINANCE:BTCUSDT.P from is a very strong resistance that would be very difficult for mr BITCOIN to pass through, so therefore, im expecting BTC to reject from there and fall to the down side. Sell BTC
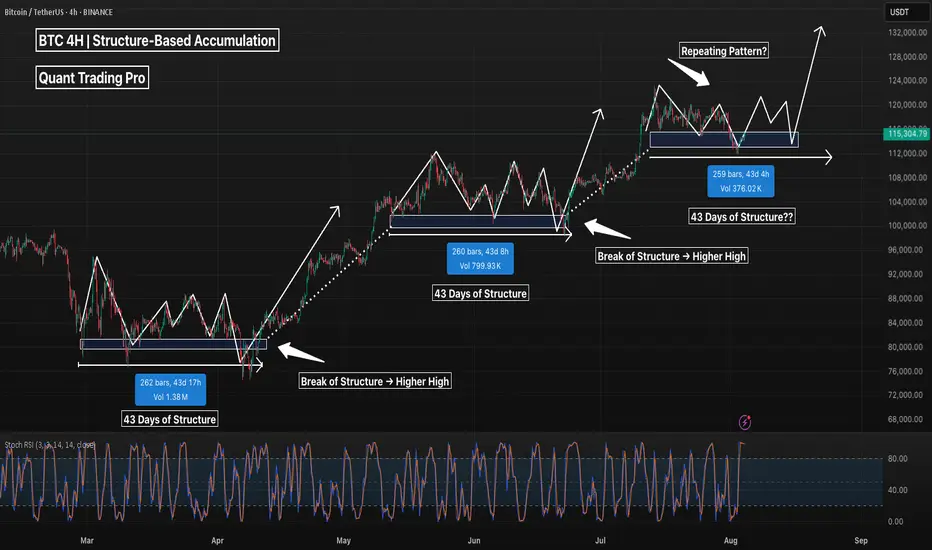
BTC 4H – Repeating Accumulation Pattern, But Will It Hold Again?Bitcoin has shown a clear structural tendency to consolidate for ~43 days at key demand zones before breaking to new highs. This 4H chart highlights three nearly identical accumulation phases, each lasting around 260 bars with a clear base, fakeout, and bullish continuation.
We’re now sitting in the fourth demand zone, with price revisiting the same volume pocket and reclaiming key structure. If history repeats, we may be looking at another breakout leg above $124K+.
Key observations:
– Each consolidation zone lasted ~43 days
– Volume decreases into the base → demand absorption
– Reclaim of structure precedes each leg up
– Current consolidation mirrors previous 3 (in time, shape, and volume)
⚠️ A clean break below ~$112K would invalidate the pattern and suggest deeper retracement.
Are we seeing another accumulation leg… or distribution in disguise?
Drop your thoughts below.
#Bitcoin #BTCUSDT #Crypto #TradingView #PriceAction #MarketStructure #BTC4H #CryptoAnalysis #Accumulation #Wyckoff #SwingTrading #PatternRecognition #TechnicalAnalysis
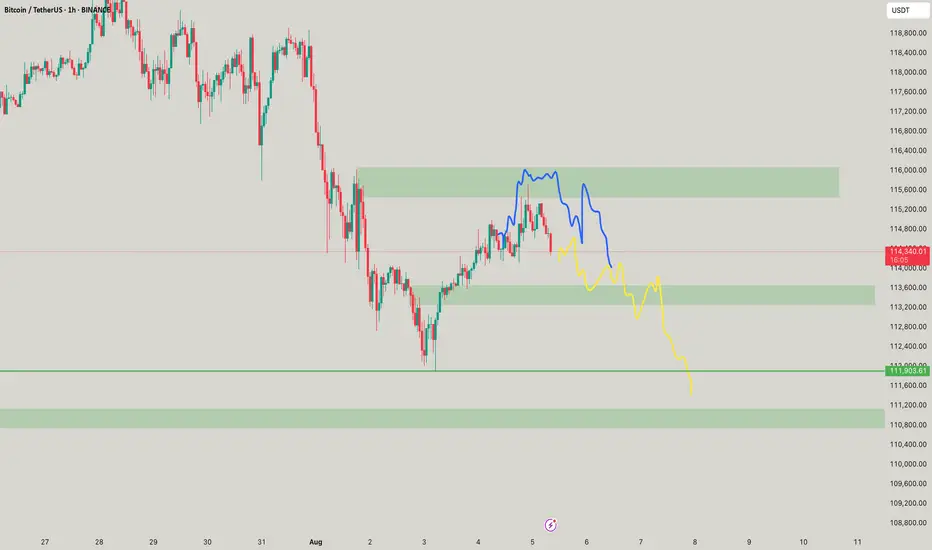
BTC/USDT Analysis — First Signs of Buyer Support
Hello everyone! This is the daily market analysis from the CryptoRobotics trading analyst.
Yesterday, Bitcoin experienced another wave of decline but failed to reach the local low. A strong absorption of sell orders occurred, and a local support zone formed at $113,300–$112,700. We currently interpret the resulting volume as being positioned for buying.
We are now waiting for a retest of two local support zones:
$114,500–$114,000 (mirror volume zone)
$113,300–$112,700 (local absorption of selling pressure)
From there, we consider local long entries.
The movement potential is aimed at the next sell zone.
If price drops further and shows no reaction within these zones, it's important to closely monitor the price reaction near the $112,000 level.
Buy Zones:
$114,500–$114,000 (mirror volume zone)
$113,300–$112,700 (local absorption of selling pressure)
$110,000–$107,000 (accumulated volume)
Sell Zones:
$115,000–$116,300 (mirror volume zone)
$117,600–$118,600 (accumulated volume)
This publication is not financial advice.
BTC ~ will it make new lows!?Ideally its following the pattern i drew, and latter after NY session, it would claim the lows ideally after the buying activity I am antiiipating now!