The Final PushNot long ago Terry started a journey. He led with faith and a determined spirit. Now the time has come for the end. Fortunes were made and fortunes were lost. The end must come so..........
That his new journey may begin,
Thanks for the adventure cant wait to see what is next.
USDTBTC trade ideas

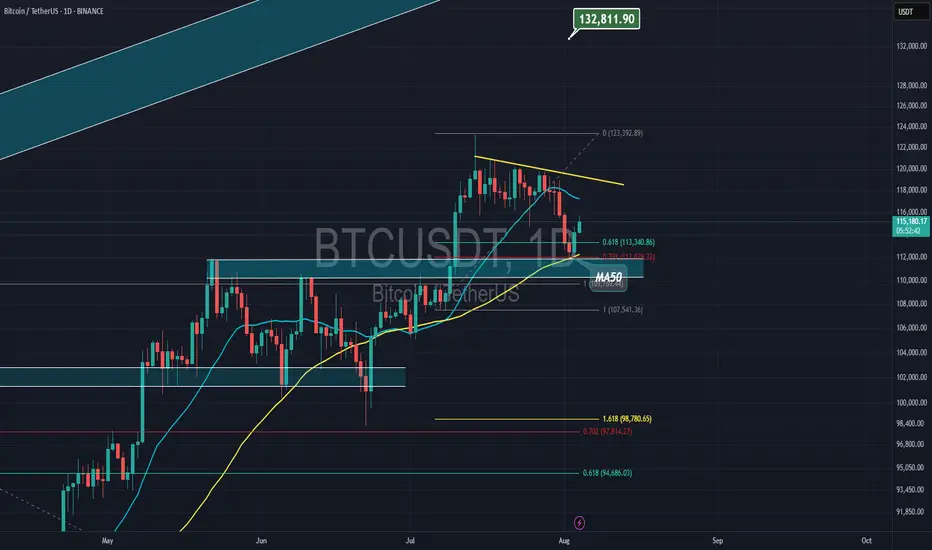
BTC/USDT.dIt looks like BTC is establishing support above this trendline if you study the line chart on a daily timeframe. A bounce here could mean serious growth... a fake out to go lower.. can be catastrophic. So far we are solid on track to go higher. Lets see

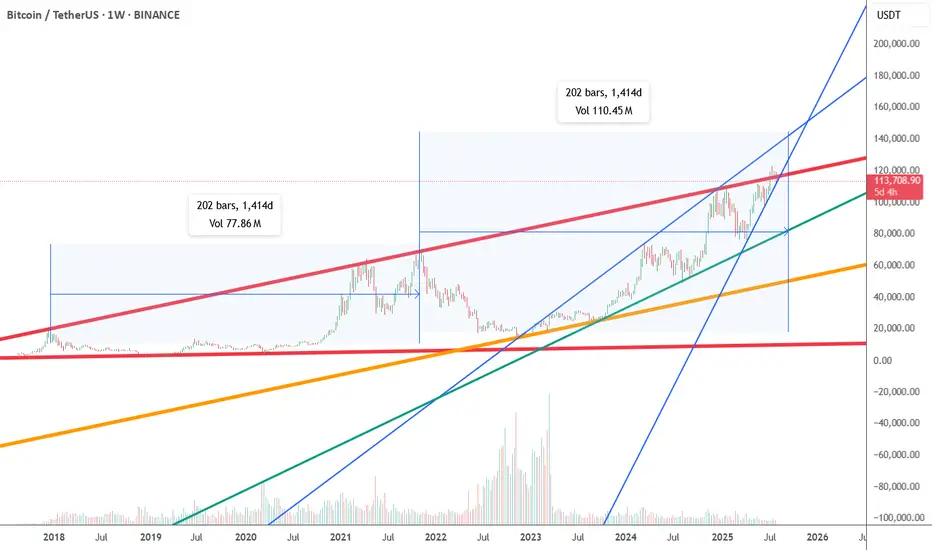
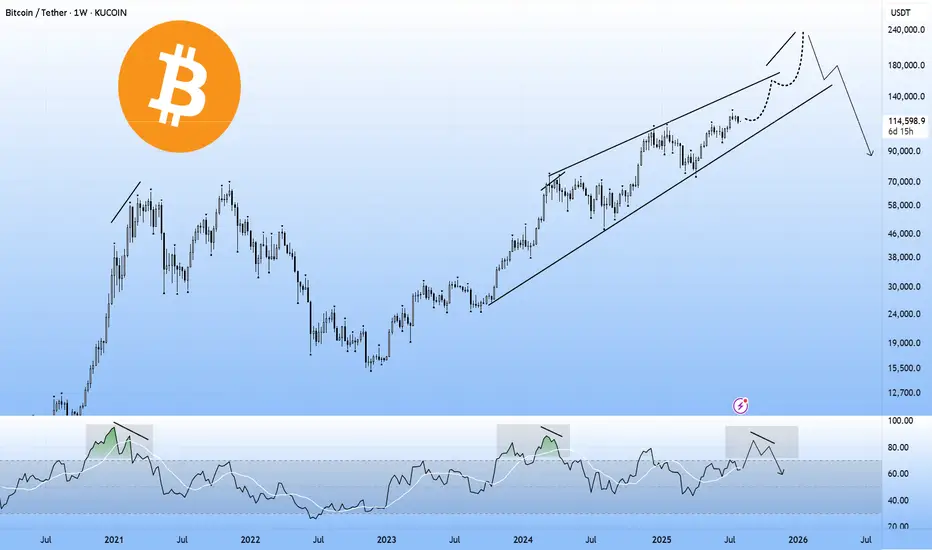
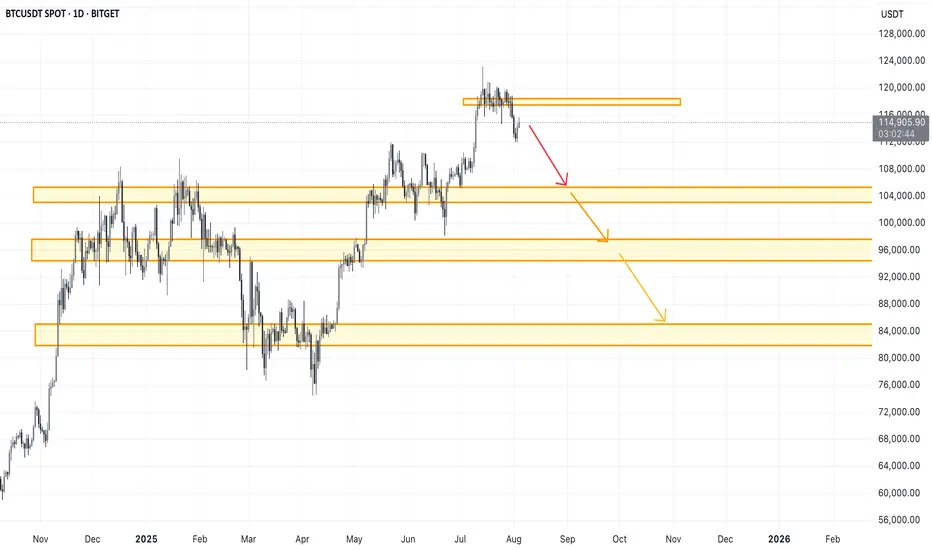
on weekly chart btcusdt long term shortAccording to the weekly chart it would say that btc is near or at the peak and in the next few weeks or months it will start to fall.
As can be seen on the chart, if btc continues to follow the time interval of 202 bars and the fractal structure of the previous period, the next decline should last longer than a year. The lines of resistance in that case would be:
1. green line or about 90k
2. orange line or about 55k
3. red line or about 15k
Disclaimer: This is not financial, investment, trade or other advice. This is my personal opinion which can very easily be wrong.
You trade at your own risk.
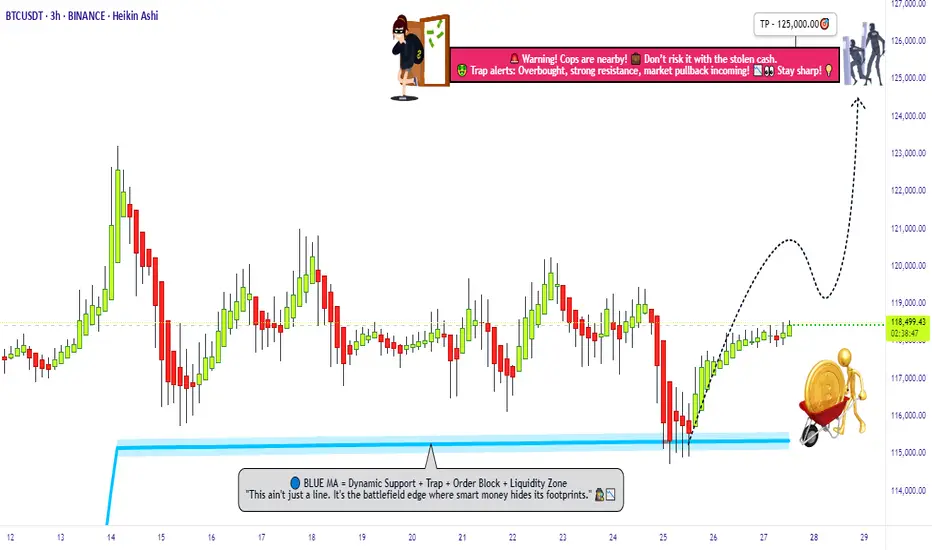
"Bitcoin’s Big Heist – Are You In or Out?"🚨 BTC/USDT HEIST MISSION – SWIPE THE BULL RUN BEFORE THE BEARS WAKE UP 💰💣
🌟Hi! Hola! Ola! Bonjour! Hallo! Marhaba!🌟
Money Makers & Robbers, assemble! 🤑💰✈️💸
Here’s your decoded BTC/USDT “Bitcoin vs Tether” Crypto Market Heist Plan, fully loaded with Thief Trading Style 🔥 TA + FA combo. We’re prepping for a bullish breakout loot – eyes on the vault, ignore the noise.
🎯 PLAN OF ATTACK:
🎯 ENTRY (BUY ZONE):
💥 “The vault’s open—time to sweep!”
DCA/Layer your buy limit orders near the 15–30 min swing lows/highs for sniper pullback entries.
Use multi-entry method to stack positions (layering / DCA) as per your ammo (capital 💵).
🛑 STOP LOSS:
Set SL at the nearest swing low wick (4H TF) — around 115000.00, adjust based on your risk/load.
SL = insurance. Not optional.
🏁 TARGET:
Lock sights on 125000.00
🎉 Or… vanish with profits before the bear cops arrive.
🔎 MARKET BACKDROP & ANALYSIS:
📈 BTC/USDT currently signals bullish vibes on the swing/day horizon — fueled by:
Macro Fuel & Fundamentals
Sentiment Radar
COT Reports
On-Chain Pulse
Intermarket Clues
🚀 Connect the dots. The smart money's already prepping a breakout move.
🧲 Scalpers Note:
Stick to the long side only. No shorting the beast — unless you’re made of diamonds.
Secure your bag with trailing SLs.
⚠️ NEWS TRIGGER ZONE – TRADE WITH TACT:
📢 Upcoming high-volatility news events can spike charts.
Avoid new entries during releases and guard open trades with trailing SLs.
Protect the loot. Always.
💖 SUPPORT THE HEIST GANG: BOOST IT!
Smash that ❤️ to boost our thief squad’s momentum!
Every click powers this underground mission – making money with style, one pip at a time. 🎯💣💵
🚀 See you in the next heist drop.
Until then – Stay stealthy. Stay profitable. Stay legendary. 🐱👤💸🏆
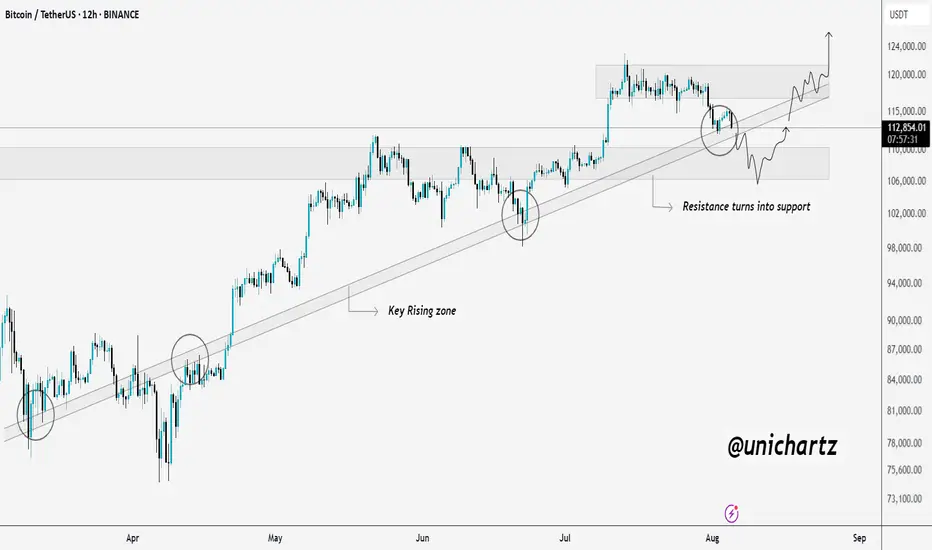
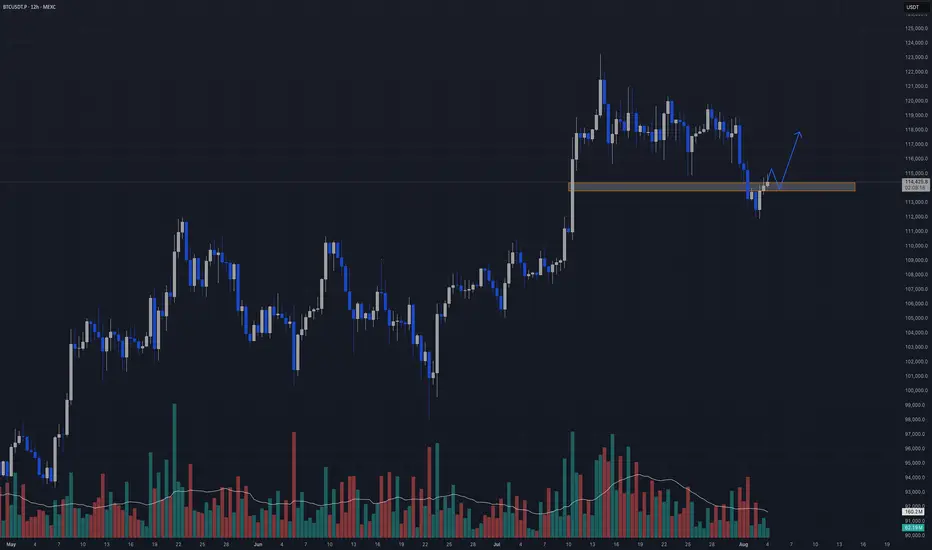
Don’t Panic Yet… BTC Might Just Be ReloadingBitcoin is doing something it’s done before.
Every time CRYPTOCAP:BTC has pulled back into this key rising zone, it’s bounced back stronger. The last few dips got absorbed right at this level, and we’re seeing the same setup again now.
Price recently flipped a major resistance into new support, and that level is being tested again. If it holds, we’re likely looking at another leg up possibly towards $124K.
Nothing is broken. Just a typical retest in an uptrend.
DYOR, NFA
Thanks for the reading
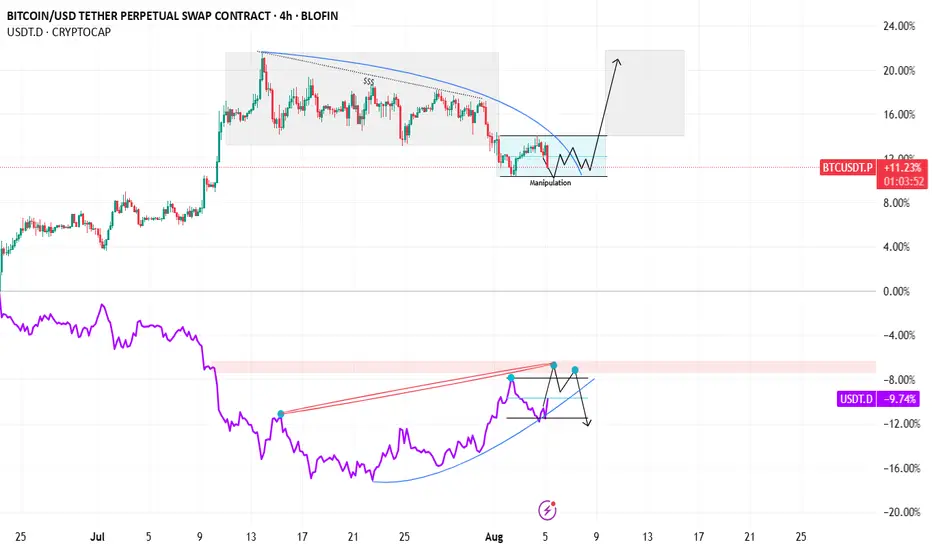
BTC PO3 setup with USDT D confluenceBTC PO3 with USDT D confluence.
BTC is in a LTF Range, where we can accumulate at the range low.
In confluence with USDT Dominance distributing in the LTF + MTF Range this can be a extra + 1 on a long on btc
Make or Break. This next move is a big deal for me personallyTo stand behind the AI I have gone all in on this next move
Many things can go wrong, including a wick that liquidates my position, me getting in too soon or perhaps the AI did as well as it could until now, but did not get the next move correct.
Whatever happens, I'm all in. (this is not to say you should do the same, its to say I believe in my craft and am backing it with massive action).
Lets see what the Bitcoin Gods have in stall

BTC Hourly Analysis – Day 1 | Trend Structure & Key Reactions⏱️ We’re analyzing Bitcoin on the 1-hour timeframe.
👀 After breaking below its support zone at 107,402, Bitcoin experienced a correction along with increasing sell pressure. The price then moved toward the 112,200 support area, where it formed a V-pattern — which has now been broken to the upside.
🎮 We’re using Fibonacci levels to identify key resistance zones and long-entry triggers. A higher low has formed above the 112,217 support and above the 0.382 Fib level, which could serve as a strong confirmation of the breakout .
⚙️ The RSI oscillator on the 1H chart is currently above 50. If buying volume increases, RSI may enter the Overbought zone. The critical level here is 70 — breaking above it can act as a confirmation for a long position .
☄️ A specific Fibonacci-based zone, linked to market maker sellers and supply pressure, was touched, triggering a reaction — around 177 BTC were sold following that touch .
🖥 Summary : As long as Bitcoin stays above its previous high, there’s no immediate concern for long positions. Based on the confirmations above, you may consider entering a long position upon a resistance breakout and taker-seller zone clearance .
📉 No short positions are planned until the 110,000 support level is clearly broken .

A big drop is ahead in the coming weeksBitcoin appears overbought, and in the current global economic climate, cash is king — a dynamic that may prompt investors to lock in profits. I anticipate a pullback to the 0.5 Fibonacci level, which sits around $69,000.

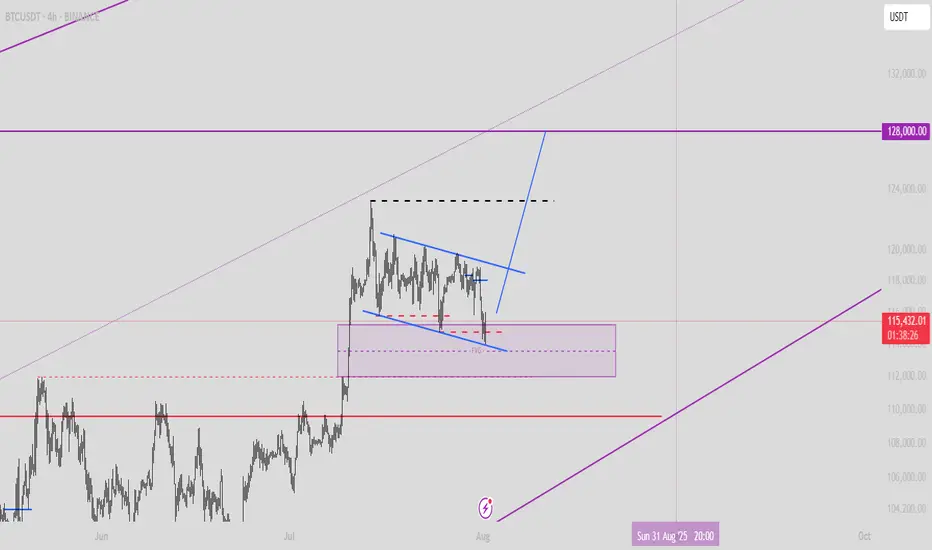
BTC is just beginning its correction🌐 As always, people like to find meaning in everything to make life seem simpler and more meaningful. So, once again, Trump has been blamed for the market crash.
Probably, if it weren't for geopolitics, Bitcoin would have grown indefinitely, and no one would have taken profits, but simply admired the numbers in their accounts 😁
But this is the real world, and BTC has long been asking for a correction along with the entire market, which I have been talking about for a long time in my ideas.
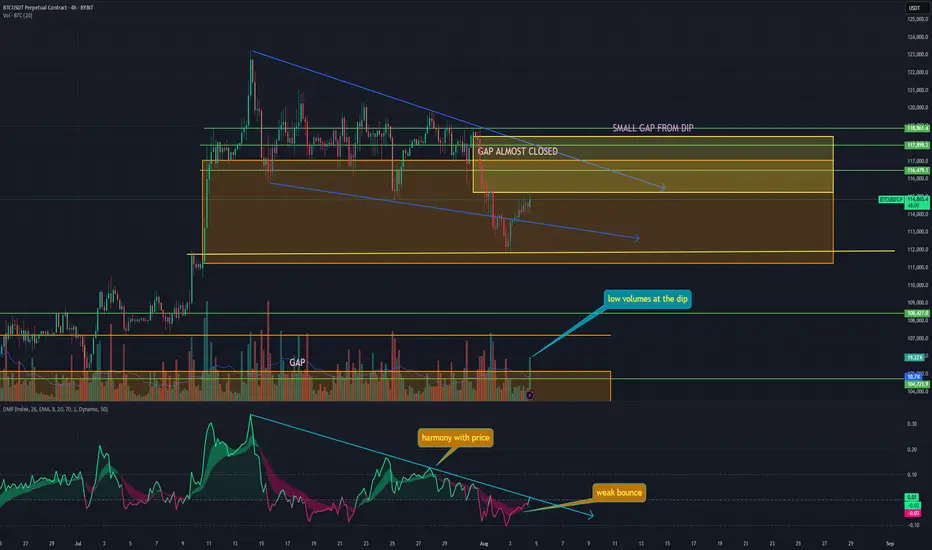
That is why this is not just a dip, but the likely beginning of a full-scale correction:
➡️ Last week's decline was expected because there is a GAP at $117,000 - $111,245 at these levels. Now that it is almost closed, a new GAP has formed during the decline at $118,403 - $115,245.
➡️ Volume - The volume of purchases at this price is simply negligible; no one wants to buy the dip even at $112,000. In addition, a divergence has been forming since last week in the volume of purchases, which has been declining for a long time.
➡️ Money Flow - very little liquidity entered on the rebound. This signals a lack of interest in buying the dip. The indicator is firmly in negative territory.
➡️ The price has also returned to the boundaries of the descending flag. Technically, this means a probable rebound to $118,000, the upper boundary of the flag, where the GAP is practically ending.
📌 Conclusion:
The main question now is: what next? Either we go higher and close the GAP from above, or we go down to retest the bottom from Sunday and close the GAP.
So far, everything points to the second scenario being more likely.
✍️ What do you think will happen next for BTC?
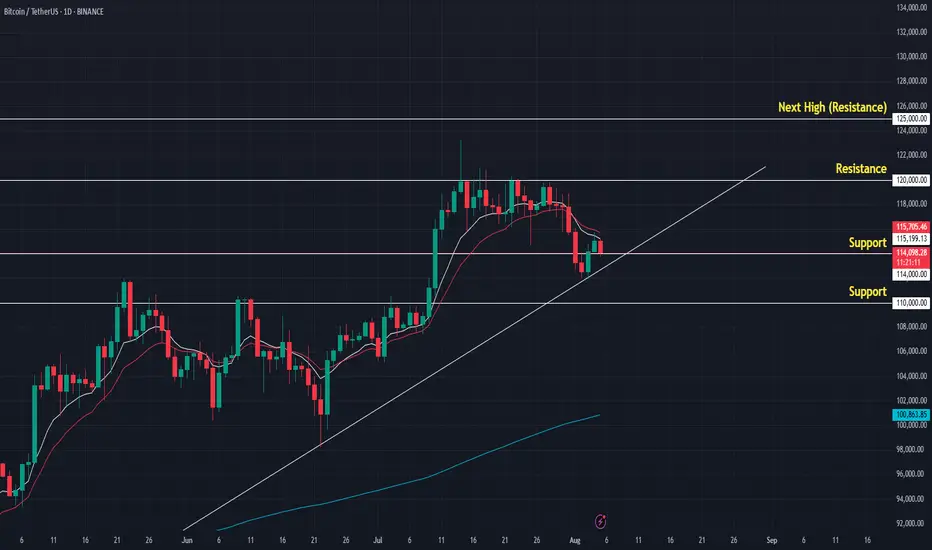
Bitcoin Price Outlook 2025–2030 | EMA & MACD SignalsBitcoin trades near $114K in August 2025, sitting just below EMA 9 and EMA 15, while the EMA 200 at $100,870 keeps the long‑term trend bullish. Support at $114K remains crucial, with resistance at $120K–$122K. A close above short‑term EMAs could spark a move toward $127K, while rejection may bring a retest of $110K. Long‑term analysis points toward a potential rise to $300K–$350K by 2030.
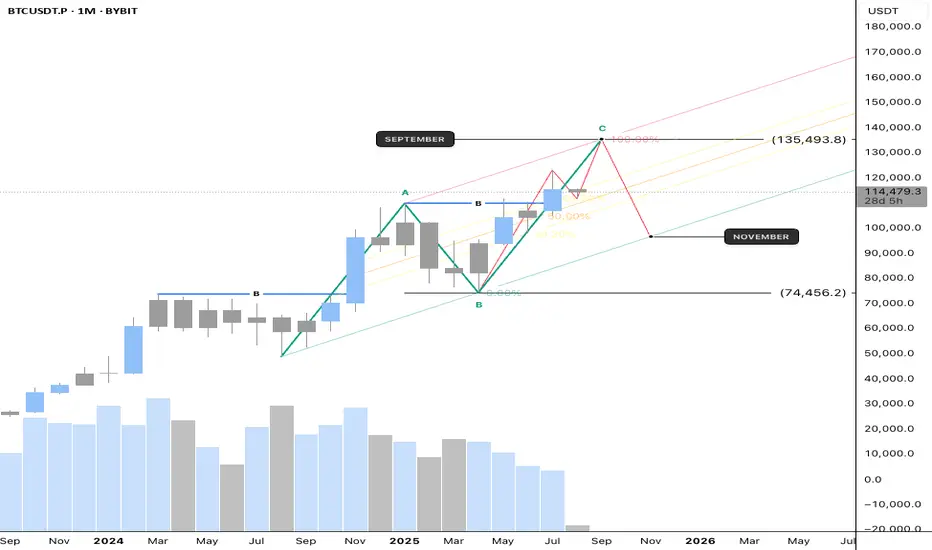
Market StructureIf we look at the underlying market structure, Bitcoin's structure isn't fully formed yet. There are still unsolved puzzles around 135,000. I believe Bitcoin will finalize its final structure around 135,000, which will be its expansionary structure.
The final candle on this weekly timeframe will determine Bitcoin's direction. This August, Bitcoin will either continue its bullish structure or continue its minor retracement.
Disclamer: Any information provided is for educational and informational purposes only and does not constitute investment advice.
127k after small fall to 112k . buy altcoins in 112k
Hello. Wait for a small correction to the 112k range. There is still wave 5 left to end this bullish move, which I think will make a new record in the 127k range.

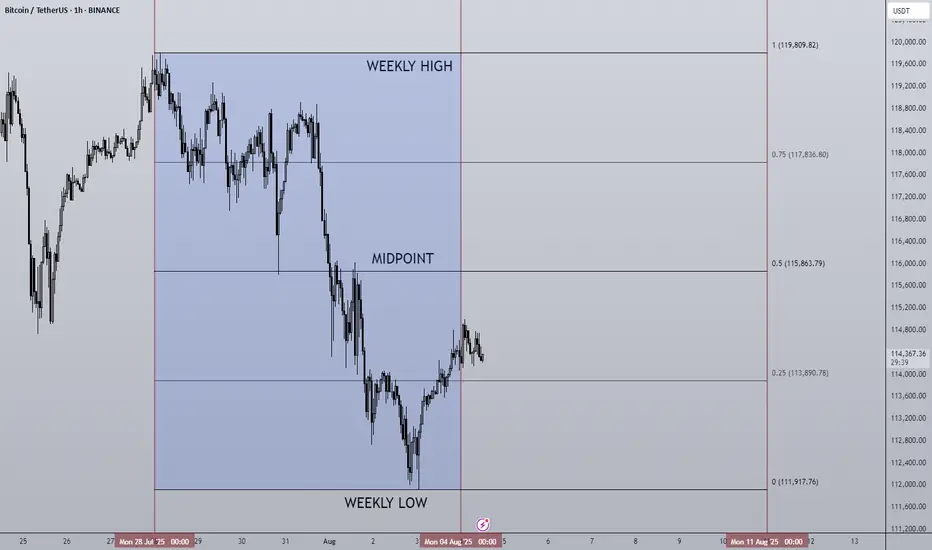
04/08/25 Weekly OutlookLast weeks high: $119,809.82
Last weeks low: $111,917.76
Midpoint: $115,863.79
First net outflow for BTC in seven weeks (-$643m) following the FOMC data release and also month end. Yet again no change by the FED but the chances of Septembers FOMC giving us a rate cut has drastically increased, currently at a 78.5% chance of a 25Bps cut.
Month end usually gives us a pullback/sell-off as larger institutions window dress which often includes de-risking somewhat. We saw this last Thursday combined with the weekends typical lower volume has resulted in quite a significant correction for BTC. Altcoins have down the same as many assets reject from HTF resistance areas, the correction has been on the cards and isn't too worrying on the face of it.
What I would say is August seasonality is generally not a bullish month and so expecting price to rebound and extend the rally would go against historical trends. I could see more of a ranging environment taking place for several weeks before any next leg up is possible.
This week I would like to see where altcoins find support and establish a trading range where some rotational setups tend to present themselves.
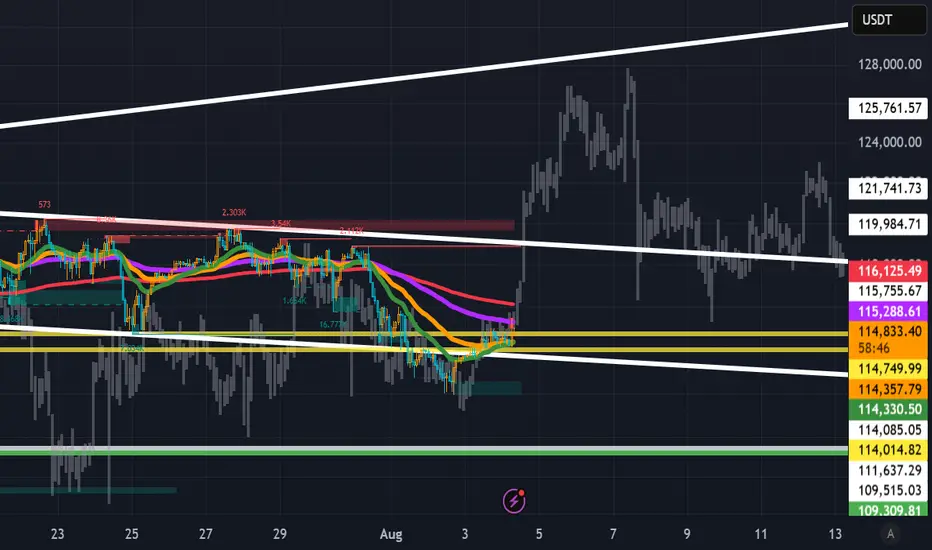
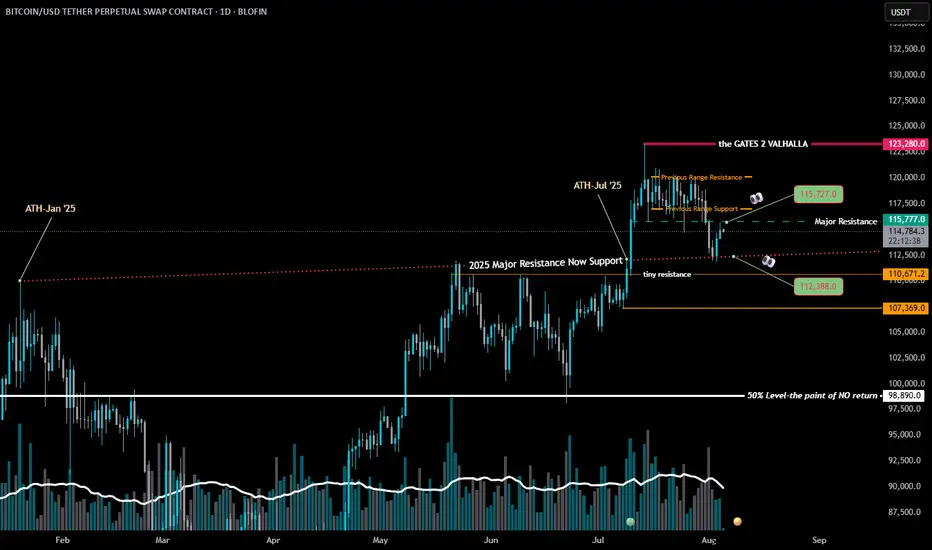
BTC-Stay Sharp. Self RegulateBTC Update
👀All Eyes on These Levels 👇
We’re back in A zone.
The level? 115,727.
This isn’t just any line on the chart — this is the same trendline that flipped from major resistance to support back to resistance on the same date of the infamous #bUCKmOON pump.
📈 If BTC breaks this level with strength and volume — I’m in long.🟢
No volume? No conviction. No entry.
But let’s not get carried away — resistance lurks right above at 117,000 — the former Exhaustion Zone Support now turned resistance.
A classic case of "what once held you up now wants to drag you down."
And if the bulls somehow clear that hurdle?
They'll run headfirst into the Exhaustion Zone Resistance — the real boss fight.
These are stacked walls — one after the other. No easy wins here.
🧠 As a chartist, I’m not here to write about what happens if we break through every ceiling like it’s some fanboy fantasy. That’s not analysis — that’s hopium.
🥂 Yeah yeah but— it’s fun to daydream about all the champagne showers, yacht parties, laser eyes, and the sudden urge to start a DAO that changes the world.
We all picture it.
We all love it.
And sure, when BTC rips through all resistance like butter, we’ll act like we "knew all along."
But anyways — snap back to reality...
There’s another level we can’t ignore:
112,388
👀 Even a 4-hour close below this level?
Just check the chart.
That’s when the bears come storming out of hibernation — angry, hungry, and ready to feast.
🎯Bottom line:
Stay sharp. Self Regulate.
The chart is the map. Discipline is the treasure.
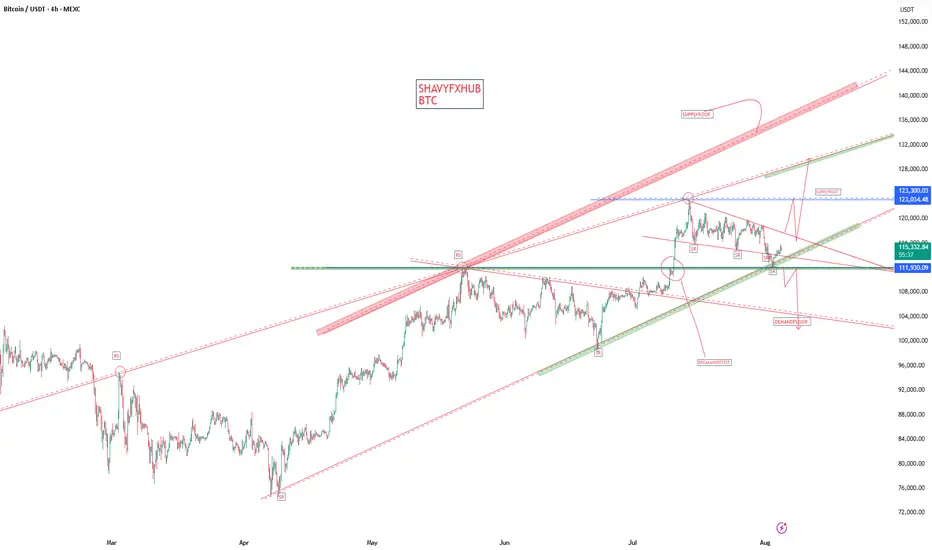
BTC rally starts / 241.000$Bitcoin is entering the last bullish rally before bear market. I want to see new phase of euphoria on crypto and altcoins also and overbought on RSI indicator
BITCOIN TRADING IS 100% PROBABILITY,ANY KEY LEVEL IN THIS CHART CAN FAIL,pls manage your risk and build a strong mindset.
bitcoin is showing a bullish drive. If i retest the 123k level again and gets rejected we are selling down ,the structure has given us a clue on 135k and above possible upswing on sentiment ,this level represents the ascending trendline and a supply roof.
#btc #bitcoin #crypto #eth #sol
BTC Long Setup (Post-Liquidation Reclaim)Hey Candle Fam,
The weak hands just got flushed harder than a memecoin rug—perfect. While retail panicked on the dip, smart money was quietly filling bags near $114k. Now it’s our turn to strike with precision.
🔥 BTC Long Setup (Post-Liquidation Reclaim)
🎯 Entry: $114,390–$113,800
🛡️ Stop Loss: $111,900
💰 Targets: $121k / $130k / $140k
📊 Strategy: Liquidity Grab + Weekly Demand Tap
– HTF bias: Still bullish, above key $115k zone
– LTF confluence: Sweep of lows + CHoCH forming on 12H/1H
– Footprint data: Volume absorption + delta flip confirm buyer interest
⚠️ Caution:
Breakdown below $110k would invalidate this setup and likely trigger a strong bearish leg. This is not a “to the moon” YOLO.
Stick to your system, manage risk, and remove emotion.
🧠 Final Note:
We don’t chase dreams—we execute plans.
All the hours we spend studying this game? It’s not for fun. It’s for freedom.
Financial independence is the goal—this is the craft.
Candle Craft | Signal. Structure. Execution.
$BTC Is Bullish: Bull Flag + Liquidity sweep + RSI DivI see higher targets for bitcoin. right now Bitcoin is forming a bullish flag, two times it has targeted short stops, and on the 4H timeframe we also have an RSI divergence.
BTCUSDT local correction is expectedExpecting local correction on BTC, as the price didn't manage to fix above 118500. Main target is around 103-105. In case of the deeper correction - next targets are mentioned on chart.
Invalidation will occur when price will fix above 118500 at least with one full candle.
Bitcoin & strong supportBitcoin is holding above 50MA and 61% of Fibonacci, it also has bullish divergence on RSI with bullish engulfing candle. upside movement is coming soon