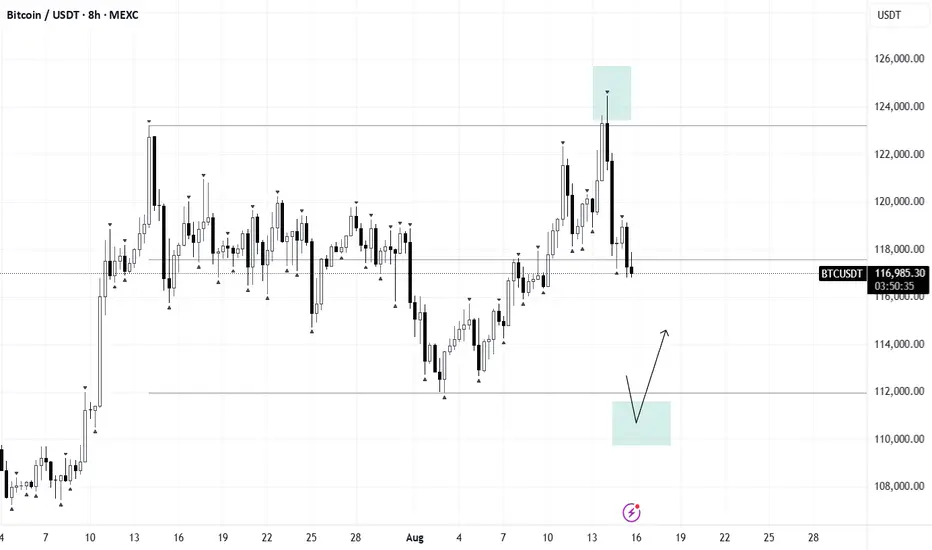
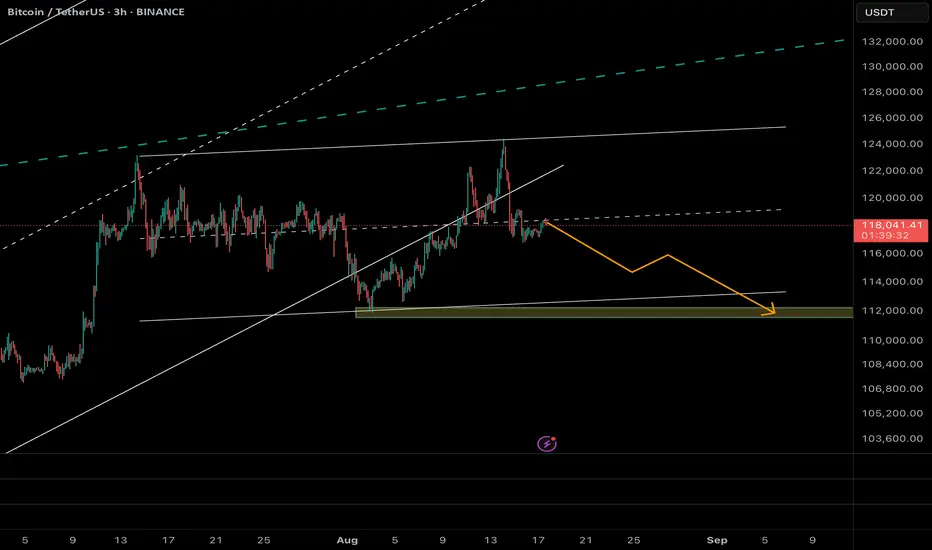
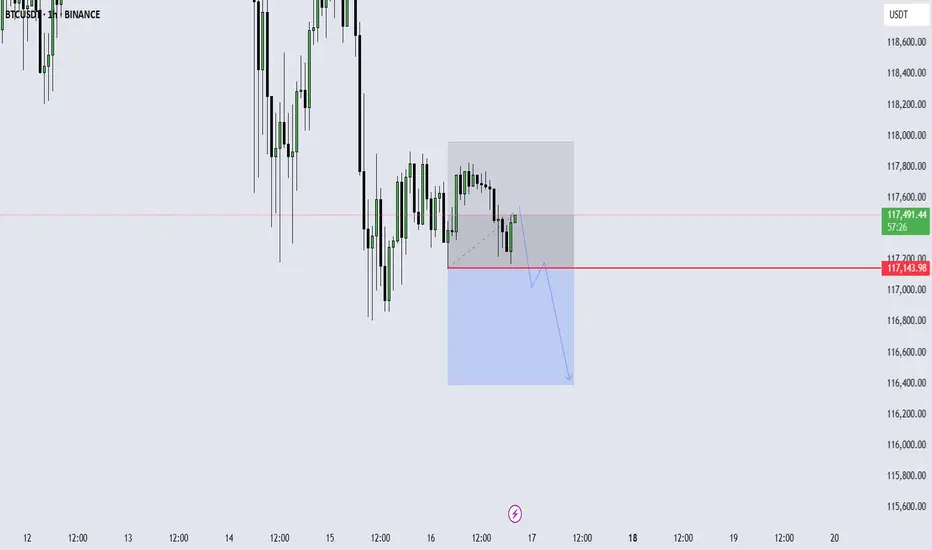
Bitcoin (BTC/USDT) – Potential Pullback Toward 112k Support
On the 3H chart, Bitcoin is showing signs of weakness after failing to hold above the mid-channel resistance. Price action is rolling over, with a clear break of the short-term trendline and rejection at ~118.5k.
🔹 The structure suggests BTC is forming a corrective leg, with the next major liquidity pool resting near 112,000 – 111,500 (highlighted green zone). This level also aligns with:
• Prior demand block & consolidation base
• Lower boundary of the short-term channel
• Key Fibonacci retracement cluster
If buyers fail to defend this zone, we could see acceleration toward the deeper supports around 109k.
📊 Scenario Path (Orange Projection):
• Short-term consolidation under 118k
• Breakdown continuation toward 114.5k (intermediate support)
• Final sweep into 112k liquidity zone before any strong rebound attempt
⚠️ Risk factors:
• A reclaim of 121.5k invalidates the bearish scenario and opens the door to retesting 125k.
• Watch funding rates & BTC.D — a sudden risk-off move in alts could accelerate the drop.
🎯 Trading Outlook (Not Financial Advice):
• Short bias while below 118.5k–121.5k
• Main target: 112k
• Tight stops required due to volatility
USDTBTC trade ideas
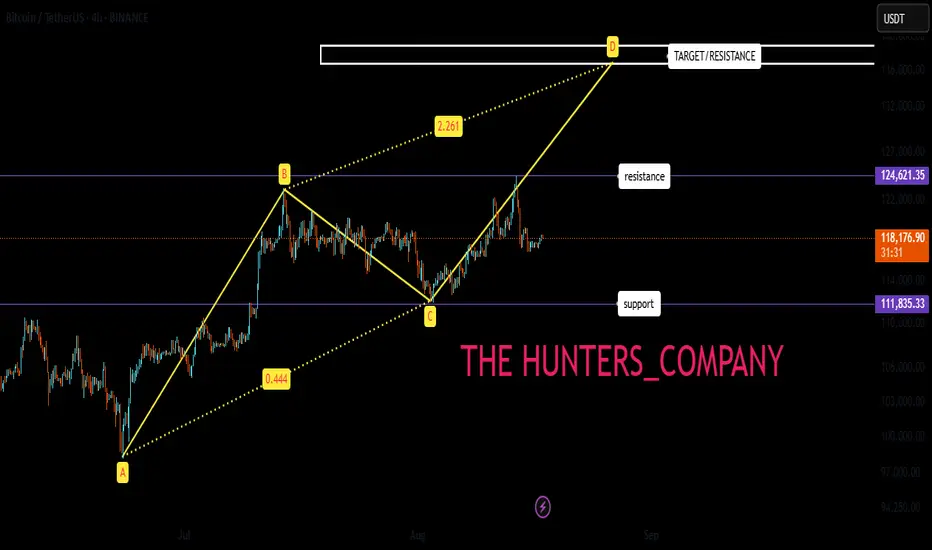
What will happen to Bitcoin in the end?Hello friends
Bitcoin has made a correction in this 4-hour timeframe after its rise and is now in a range. Considering the waves formed, it is expected to move upwards and form wave D if the important resistance is broken by the buyers.
The price may remain in this range for a while, so be patient.
Now, for a safe entry, we can let the resistance or support be broken validly and then enter.
The specified price range can be our target and it makes sense to take profit in that area.
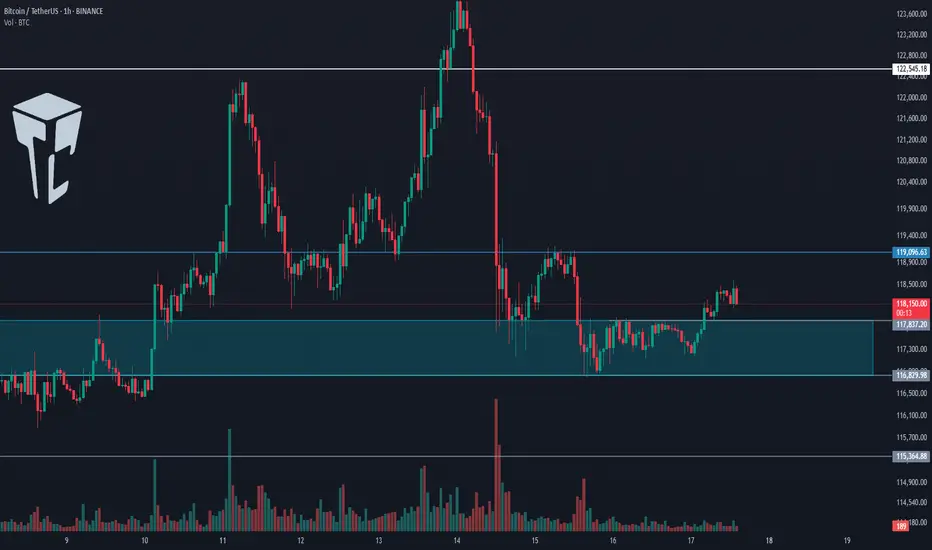
TradeCityPro | Bitcoin Daily Analysis #155👋 Welcome to TradeCity Pro!
Let’s move on to Bitcoin analysis. Bitcoin is still ranging with low volume. Let’s see what could happen to Bitcoin in the coming week.
⏳ 1-Hour Timeframe
Yesterday, Bitcoin rose from its support zone and, by breaking 117837, it managed to hold above this level.
📊 The volume is still very low and will probably remain so until the new weekly candle opens. But if the volume increases, with the break of the 119096 zone we can open a long position.
📈 For long positions, my preference is still on altcoins because Bitcoin dominance is falling and the money flowing into altcoins is more than into Bitcoin.
✔️ If 119096 is broken and dominance continues to fall, altcoins can once again have an upward move and I will open a new position on altcoins.
🔔 On the other hand, if with the start of the new weekly candle the price holds below 116829, it is very likely the market will go into correction and range for the whole week. But if its initial move is bullish and it breaks the 119096 high, a new bullish leg for the market can begin.
❌ Disclaimer ❌
Trading futures is highly risky and dangerous. If you're not an expert, these triggers may not be suitable for you. You should first learn risk and capital management. You can also use the educational content from this channel.
Finally, these triggers reflect my personal opinions on price action, and the market may move completely against this analysis. So, do your own research before opening any position.
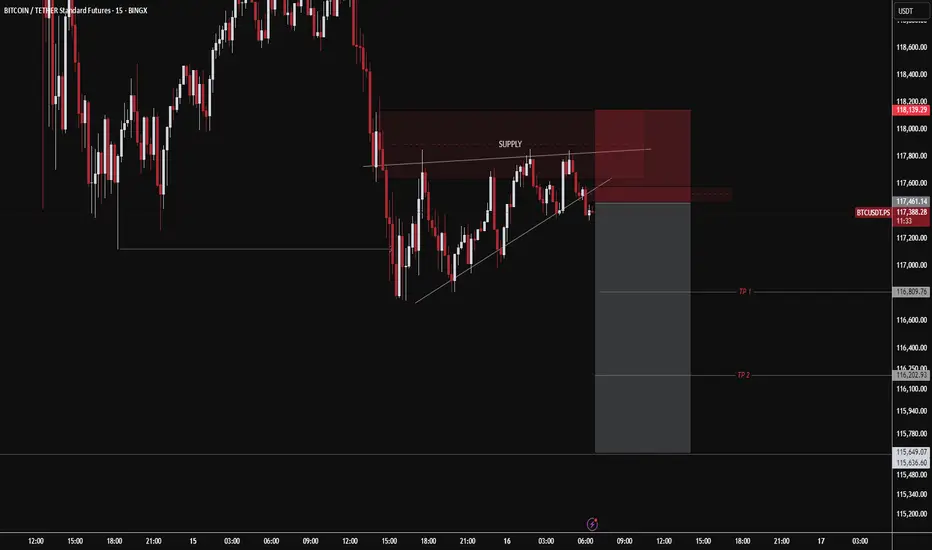
BITCOIN THE bitcoin intraday supply roof interchange was respected at 118.491k and if that broken supply roof becomes support i will look for buy on 4hr line chart close .
on intraday i have respect for 4hr/3r only.the reason is because of the close of the candles gives me a clear view of daily directional bias as long as i get an interchange(RS/SR OR SR/RS)
AM looking to sell on top layer supply roof.
trade like a hunter and aim like David
precision is everything.
trading is 100% probability,pls manage your risk
GOODLUCK
BYE

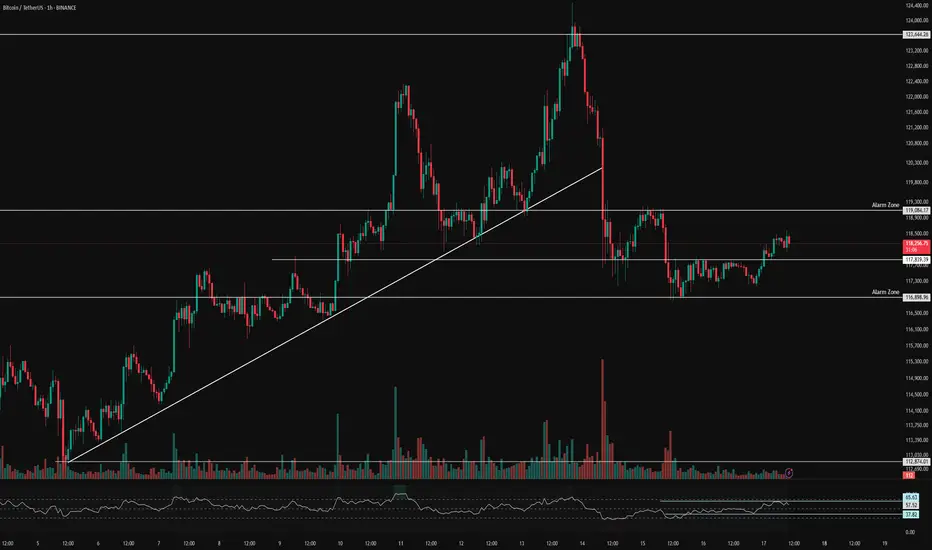
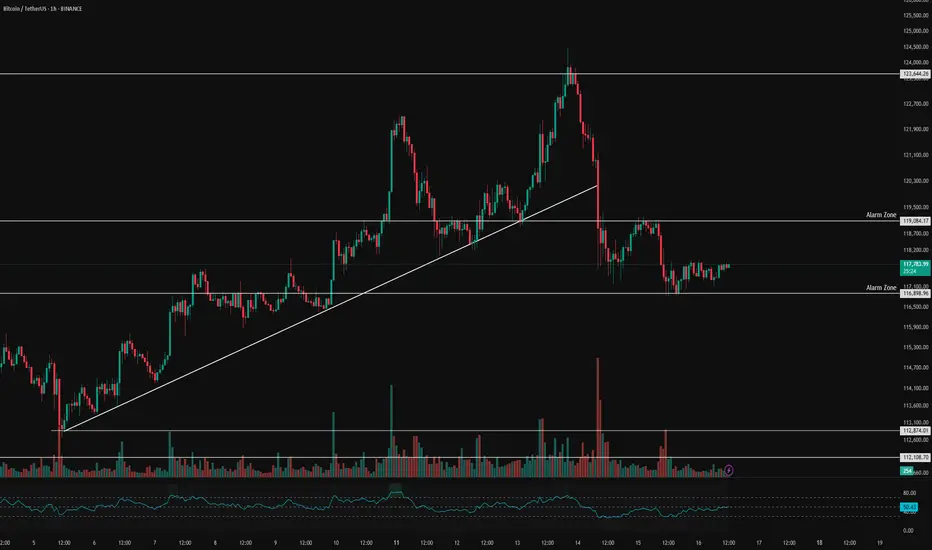
BTC 1H Analysis – Key Triggers Ahead | Day 14💀 Hey , how's it going ? Come over here — Satoshi got something for you !
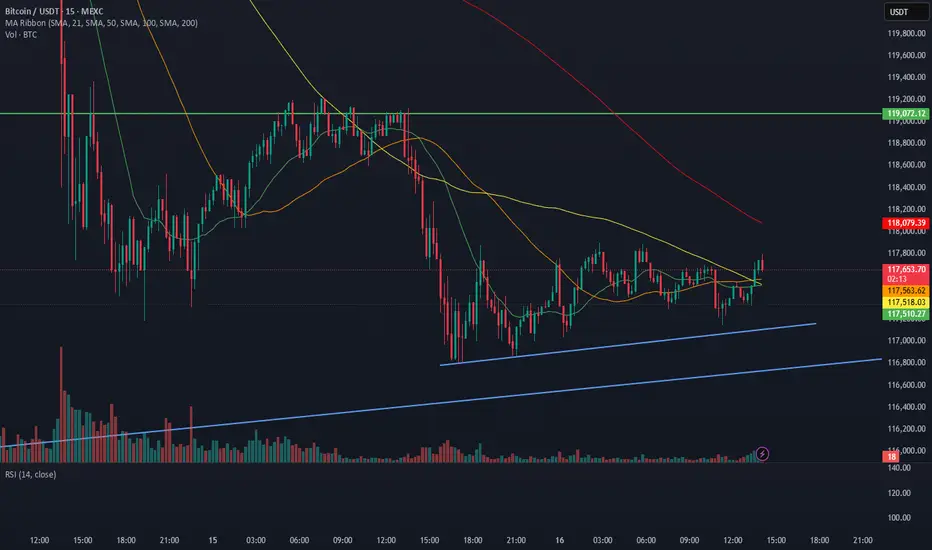
⏰ We’re analyzing BTC on the 1-hour timeframe timeframe , we can see that Bitcoin is building a range above the $117,000 support level while trading with reduced volume.
👀 After breaking through the $118,000 zone (which acted as the midline of the range), Bitcoin has formed a consolidation just above $117,000. At the moment, it is ranging with a slight upward bias in the short term.
🕯 Trading volume and the number of transactions have decreased due to the weekend/holidays.
⚙️ On the RSI, the key resistance zone is 65.63. A breakout above this level could increase the probability of moving into overbought territory. On the other hand, losing the support zone around 37.82 could trigger selling pressure and push RSI into oversold territory.
🔔 Our alarm zones are set at $119,000 and $117,000. Breaking either of these levels could provide a trading signal. Monitoring price action around these zones will give clearer entries.
💵 Looking at USDT.D , we can see a 1-hour box range structure. It recently broke down from the bottom of the box. Now, the question is whether this decline will continue or if it will return inside the range.
🖥 Summary: Bitcoin is currently consolidating in a range with a slightly upward slope. However, due to the weekend, trading volume has dropped significantly, so any breakout needs confirmation with stronger liquidity.
❤️ Disclaimer : This analysis is purely based on my personal opinion and I only trade if the stated triggers are activated .
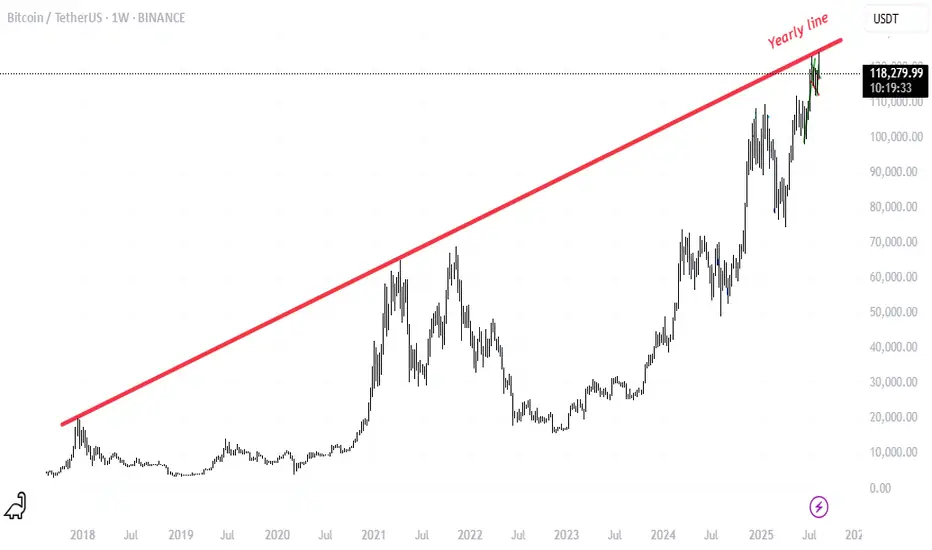
BTC On Weekly chartBased on the weekly trend, it's clear that the price has reached the trend line, and there's a high probability of a price drop or correction
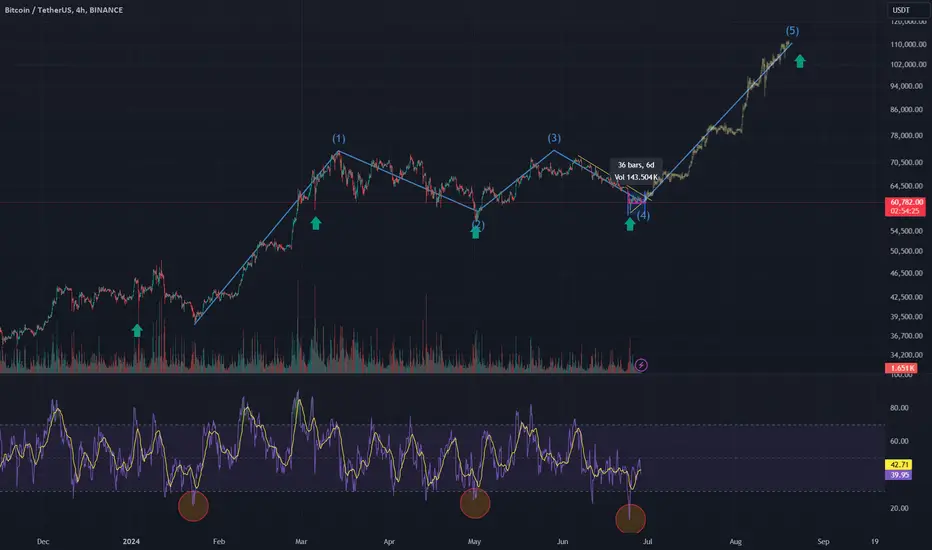
Bitcoin and Elliott Wave TheoryThe recent analysis of Bitcoin's price action shows a compelling Elliott Wave pattern that indicates a possible final leg breakout. The chart provided highlights the completion of waves 1 through 4, suggesting that Bitcoin might be poised for the fifth and final impulsive wave.
Zooming in, many have also noticed the inverted head and shoulders pattern, which also indicates a bullish narrative.
Evidence Supporting the Breakout:
-RSI: Showing low numbers similar to previous great pushes.
-Daily Cycle Low: Most likely confirmed.
-ETH ETF Launch: Expected to boost crypto volume.
-BTC ATH: Will attract attention and spark news, starting the mania phase.
-M2 Money Supply: Uptrend indicating increased liquidity to boost assets.
-BTC Halving Cycle: Suggests an impending euphoria phase.
-Fear/Greed Index: Indicates the market is ready for a new push.
These factors collectively suggest that Bitcoin is ready for a significant upward move, potentially leading to new all-time highs.
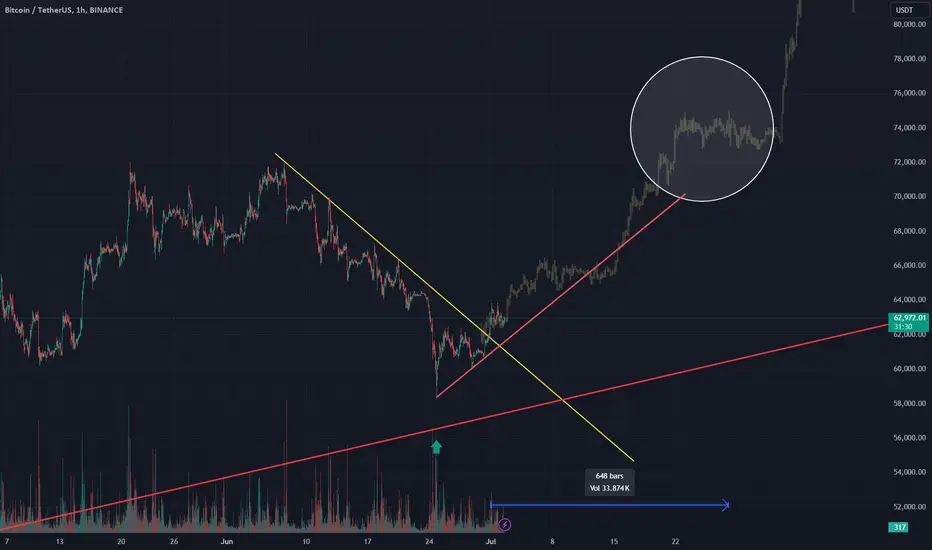
Bitcoin's Path to a New All-Time HighIn the captivating world of cryptocurrency trading, Bitcoin has always been a cornerstone of attention. Recently, its price trajectory has offered a compelling narrative of resilience and potential growth. A detailed examination of the current Bitcoin chart, as depicted, indicates a significant trend shift that might suggest a new all-time high (ATH) by July 27th.
The chart showcases a strong upward trend after breaking through a major descending resistance line in early July. This breakout was supported by an increase in trading volume, a bullish indicator that often precedes sustained price movements. After this pivotal shift, Bitcoin has maintained a robust ascent along a rising support line, marked in red on the graph.
The focal point of this analysis lies in the highlighted circle, where Bitcoin consolidates around $72,000 after a sharp increase. This consolidation phase often serves as a springboard for further price escalation if supported by underlying market sentiment and continued investor interest.
Drawing on these observations, the trajectory extends towards a potential reach for $73,000, a figure that would mark a new ATH, by July 27th. Such a target is not only technically feasible but also aligns with market dynamics often observed in post-consolidation phases.
Investors and traders might want to keep a close eye on any changes in trading volume and watch for any signs of a price pullback to the supporting trend line, which could serve as potential buying opportunities. As always, while the signs are promising, the volatile nature of Bitcoin requires a balanced approach to risk management.
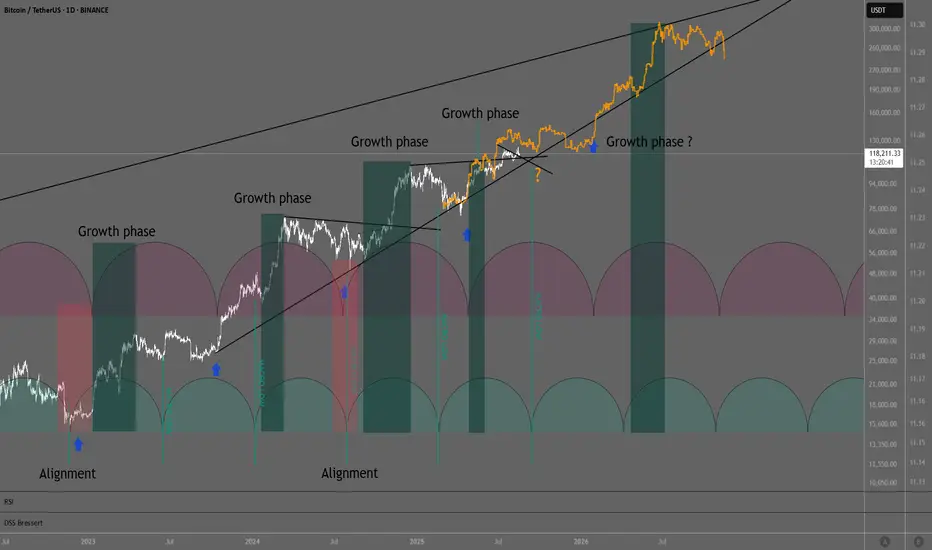
BTC cycle overviewLooking through my charts in gold, BTC, and cycle influencers I have seen that everybody has an different count in the weekly cycles.
I have overlaid the two popular cycles on top of each others, and believe to have found some interesting patterns.
Shortly said the larger red timing cycle is the more dominant cycle, matching all the larger lows. But looking at the green timing cycle count macro lows can be observed. And when comparing the alignment of the two cycles interesting things can be seen.
Example when the weekly cycle moves down and green cycle goes up, price move sideways, and when cycle lows align, big moves down occur. After the alignment lows, the cycle have moved simultaneously toward the cycle crests, and this have given BTC big volatile moves up.
Growth phase happens when both cycles move align from low to crest, here there is a period where more volatile upside is observed, on the other side a volatile negative period can be seen when the cycle lows align, as seen with the FTX collapse that marked the last bear market bottom, and last summer where we was a +30% correction after the ATH before the halving. Looking forward a macro low can be seen mid September, and a larger weekly cycle low January 2026. This is not ideal for a big blow off top. But more of an curved choppy top unfortunately.
Looking at the coming macro low and weekly cycle low in January which can be the end of the cycle, this can be looking very similarly to the start of the cycle ironically. Here we observe that the macro or green cycle bottoms right in the middle of the larger weekly cycle.
The next where both cycle align is October 2026. Is this the next bear market low?
BTC 1H Analysis – Key Triggers Ahead | Day 13💀 Hey , how's it going ? Come over here — Satoshi got something for you !
⏰ We’re analyzing BTC on the 1-hour timeframe timeframe, we’re observing price action.
👀 After the recent drop, Bitcoin has moved into a 1H range box. A breakout on either side of this box can give us a potential long or short setup.
🕯 Trading volume is lower due to the holidays, and Bitcoin usually carves out a decision zone toward the end of each week.
⚙️ Our RSI oscillator shows an important swing area around the 50 level. Holding above 50 increases the odds that the $117,000 floor will act as stronger support.
🔔 Two alert zones based on the chosen breakout: price behavior around $119,000 and $117,000 can help determine which position to take.
💵 We’re monitoring Tether (USDT) dominance. It’s also sitting in a 1-hour range box; a breakout in either direction could feed trading volume into Bitcoin .
🖥 Summary: Bitcoin is in a 1-hour multi-timeframe range box, and the $117,000 support looks firmer than before.
❤️ Disclaimer : This analysis is purely based on my personal opinion and I only trade if the stated triggers are activated .
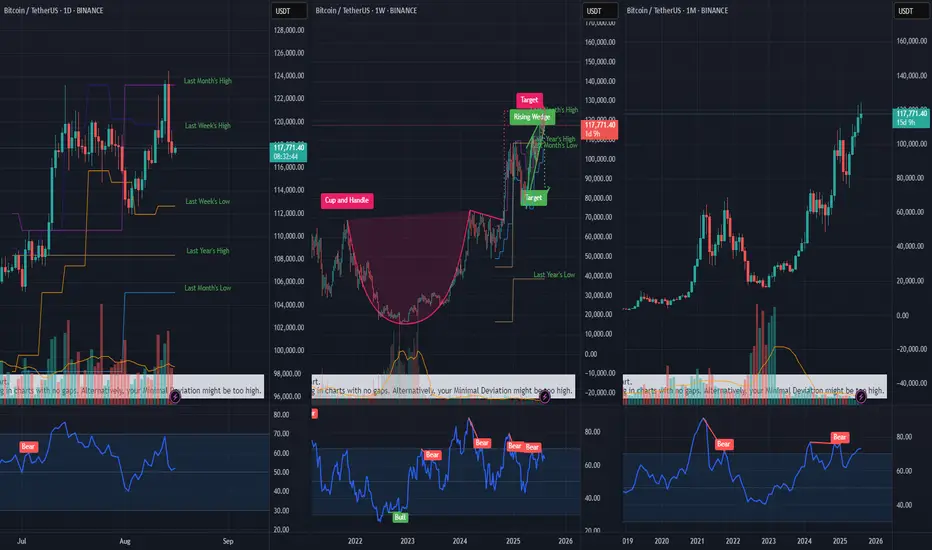
Bitcoin reached technical price target of cup and handleBearish argument:
Bitcoin has reached the technical price target of cup and handle pattern as seen on the weekly chart.
Safe entry: Need to wait for closed monthly reversal candle
Early and risky entry: Double top on the daily and weekly with daily bearish divergence and bearish engulfing candle.
Bullish case: No major volume spike and Ethereum hasn't shown a clear bearish reversal yet at the ATH level.
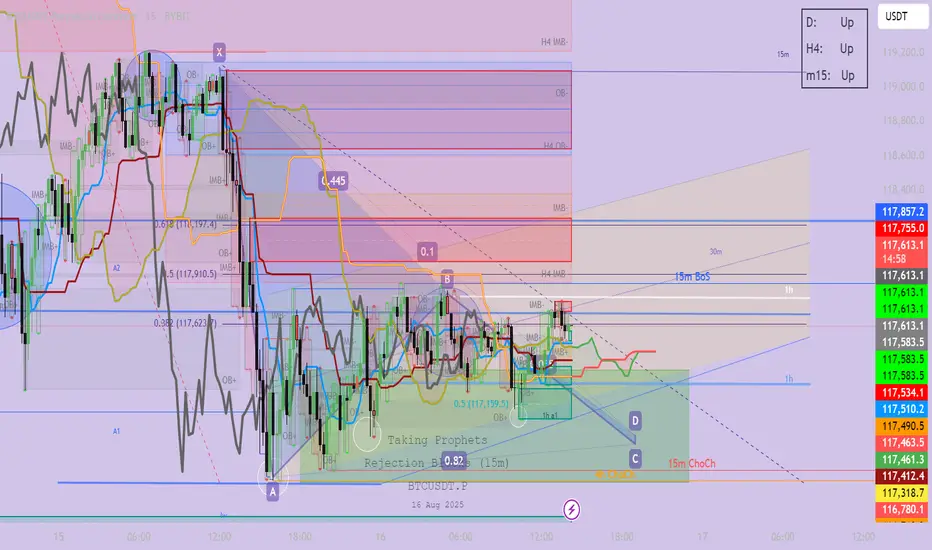
A high probability BUYLooking at the overall Structure which is Bullish, price has created series of accumulated liquidity forming the bases of price accumulation. With an mitigated engineer liquidity and a subsequent liquidity accumulation, price is going for a manipulation which the engineered Liquidity and then distribute. At the entry just wait for a choch or a candlestick rejection to reduce momentum and Buy.
BTC Analysis - ICT Structure ShiftSubtle changes in structure to be noted for BTC trades on 4Hour, Daily and Weekly basis...

Uncertain times for BTC. But take a chance here.tradingview.sweetlogin.com
The good news is that, if we have some bullish strength, we have large 4H/1D vector candle to fill between around 119 to 122k.
However, short term max pain at every level is on the short side. If you take the short term max pain volume product, again, all favour short.
Hidden bullish divergence lost on all time frames.
117.9k short term resistance, support 116.8. If it breaks I think we head to 116,500 LQ pool and, then, long term channel support.
I would be looking to go long hard, here.
TPs - according to your risk tolerance.
SL - 114900.
I am currently in a position but won't be adding to it in this weakness.
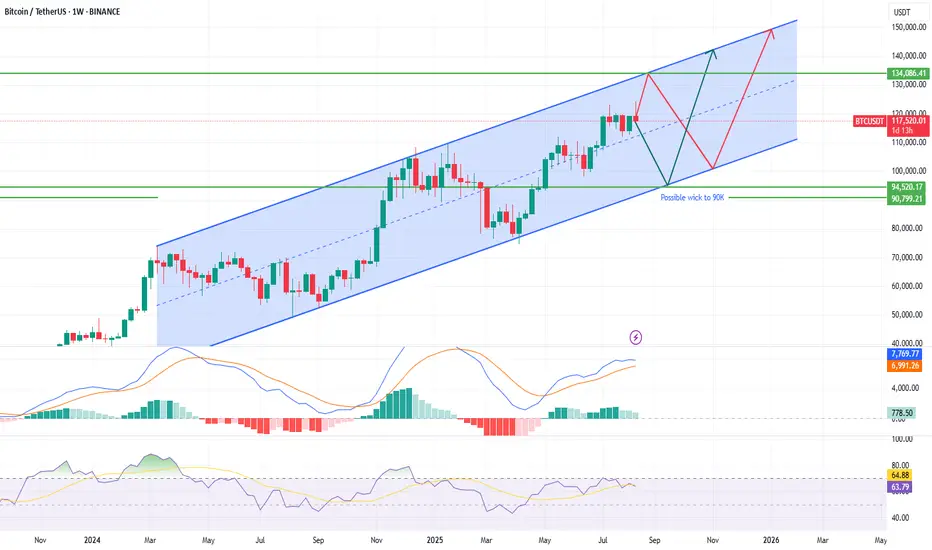
Bitcoin Weekly Chart – Possible Scenarios into September 2025Scenario 1 – Direct Upside Move
BTC holds current mid-channel structure and builds momentum.
A push toward $134,000 comes first, driven by bullish sentiment and strong inflows.
After the rally, possible rejection sends BTC back down to retest $100,000 before any continuation.
This path suggests an earlier breakout, followed by a mid-cycle correction.
Scenario 2 – Deeper Correction Before Final Rally
BTC breaks lower within the channel, sliding toward $94,000 .
A wick to $90,500 may form, testing major horizontal support and channel base.
This coincides with the September 2025 Fed rate cuts , which could provide the macro catalyst for reversal.
From there, BTC rebounds sharply, igniting a strong year-end rally toward $134,000 .
This second scenario may align more closely with macro timing, where policy easing sparks the next leg higher.
Conclusion:
Both scenarios project $134k as the next major upside target. The path differs:
Either a direct move with a later retest of $100k (Scenario 1).
Or a final deeper flush to $90–94k before the September rate cuts, then a powerful year-end rally (Scenario 2).
BTCUSDT. Where to look for buys?Hi traders and investors!
This analysis is based on the Initiative Analysis concept (IA).
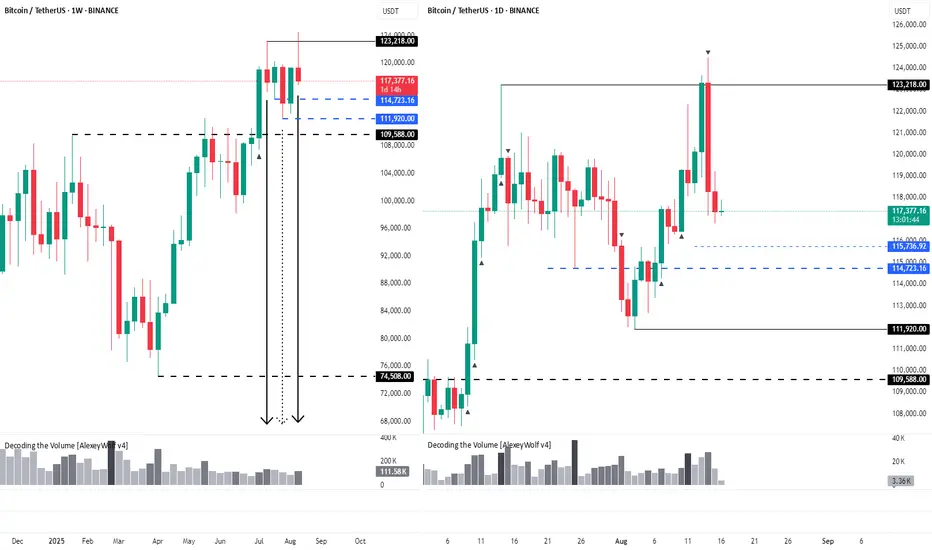
On the weekly timeframe, there was a sideways range (boundaries marked with black lines) that the buyer broke to the upside, but so far has been unable to extend the initiative further. Sellers are still defending the 123,000 level — we can see this from the volume that appears whenever price touches this zone.
On the weekly chart, there’s also the 114,723 level, where price interacted with a seller candle on declining volume. That’s not a bullish signal for looking at longs and suggests price may move lower. If 114,723 doesn’t hold, we could see a retest of the local low at 111,920.
On the daily timeframe, price has formed a sideways range (boundaries marked with black lines).
The current vector is with the sellers, with a target at 115,736.
We’ll be watching how price reacts at 115,736 and at 114,723 — and whether a strong buyer appears at these levels.
Wishing you profitable trades!
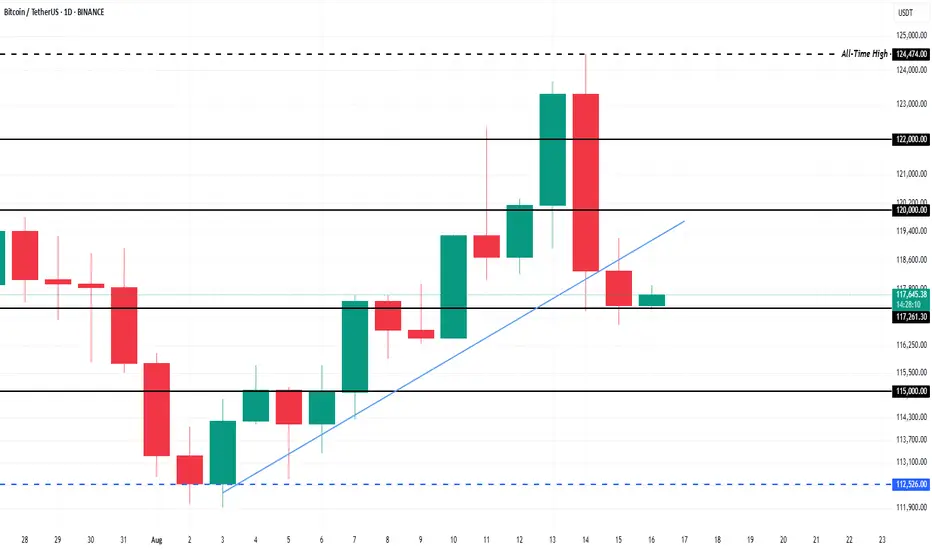
Bitcoin Key Holders Turn Neutral Ahead Of Volatility ExplosionBINANCE:BTCUSDT price had shown an upward trend throughout the month, but this momentum faltered in the last 24 hours, with BTC falling to $117,305 . This decline occurred as the price slipped below the established uptrend line, signaling a shift in market sentiment.
If investors maintain their positions during the expected volatility surge, BINANCE:BTCUSDT could stabilize above $117,000. This would open the door for a potential push toward $120,000, turning it into support and allowing further upside movement.
However, if investor sentiment turns bearish and selling increases in response to volatility, BINANCE:BTCUSDT could face a significant drop . In this case, the price may fall through the $115,000 support level, potentially reaching as low as $112,526 . This would wipe out the gains seen in August, invalidating the bullish outlook.
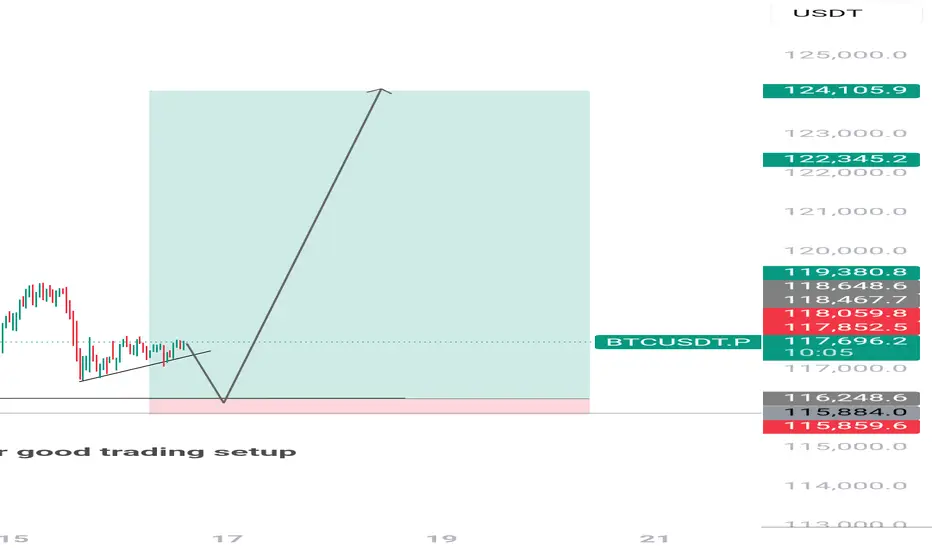
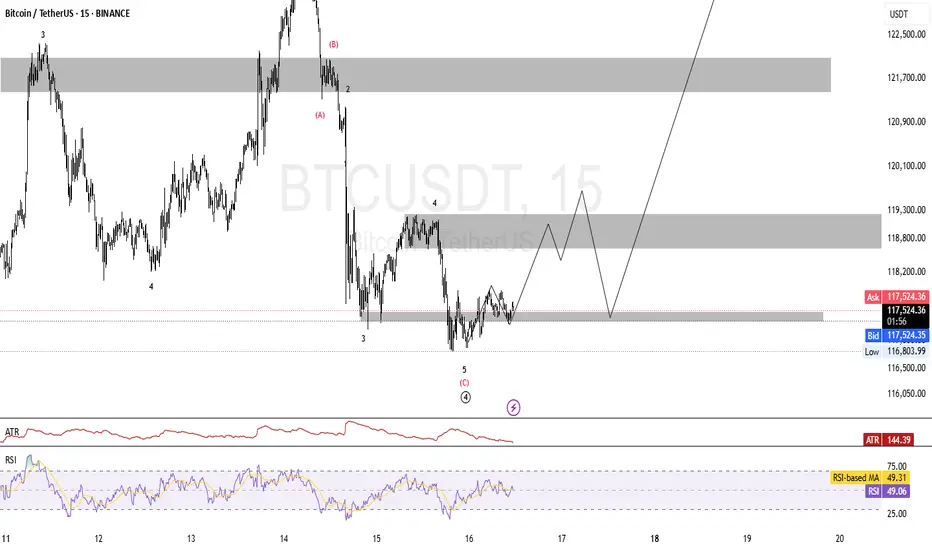
BTCUSDT:Elliot Wave 15minAccording to the previous analysis, it is expected that Bitcoin's upward trend will occur with the formation of waves 1 and 2. Considering the market structure, the market structure must be broken and stabilized above the previous ceiling, followed by a decline towards liquidity as the second wave, after which we will expect growth.
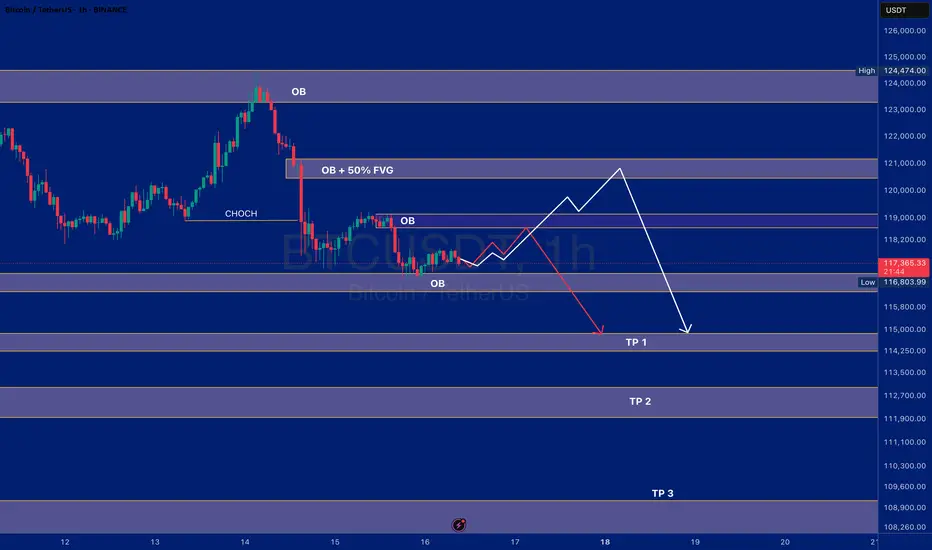
BTC Technical Analysis – Order Block Reaction or Trend Reversal?Bitcoin has recently formed a CHOCH after a corrective move and is currently trading within the previous Order Block.
In the short term, price may push upward to test the first Order Block and retrace, or extend higher into the second Order Block, aligning with the 50% FVG level, before a potential pullback.
The broader market outlook remains bearish, targeting the predefined downside levels.
However, if Bitcoin breaks above 121,166 with a strong bullish candle, this scenario would be invalidated, and a bullish trend shift could begin.
$BTC Next Move Short position, chart is on the screen. SL and TP are set.
I’m using 15% margin for the entry.
Let’s start with Bismillah...
I see the high chart forming a bearish flag.
BTC/USDTBTC is currently in consolidation, with a deviation above the range already in place.
If we see a deviation below the range, long setups can be considered — but only with clear confirmation