BITCOIN PREDICTION: THIS FIBONACCI SPIRAL WILL BLOW YOUR MIND!! Yello Paradisers! I've revealed to you the secret Fibonacci spiral target. We have been going through multi-timeframe analysis as professional traders. We have been going through the high timeframe chart. We have understood that we are trading inside of that ABC zigzag. Right now, we are in the C wave and we are creating the five moves that are upside. That might take us towards $135,000.
We are right now in the first wave of that fifth wave. We are having bullish divergences on the high timeframe chart. All important indicators like stochastic RSI, RSI, and MACD are having bullish signs, and we have successfully reclaimed the volume profile point of control from resistance into support.
Then, we are turning our focus on the medium timeframe. We are again going through the Elliot wave. We are taking a look at the contracting triangle; the deviation there happened, we are seeing the bullish divergence, and we are updating the Fibonacci spiral. Then we are moving our focus to the low timeframe where we are concluding the Elliot wave count of smaller waves and understanding that the fifth one might be extended.
Paradisers! Keep in mind to trade only with a proper professional trading strategy. Wait for confirmations. Play with tactics. This is the only way you can be long-term profitable.
Remember, don’t trade without confirmations. Wait for them before creating a trade. Be disciplined, patient, and emotionally controlled. Only trade the highest probability setups with the greatest risk to reward ratio. This will ensure that you become a long-term profitable professional trader.
Don't be a gambler. Don't try to get rich quick. Make sure that your trading is professionally based on proper strategies and trade tactics.
USDTBTC trade ideas

BITCOIN PREDICTION: CRITICAL UPDATE (warning) Yello Paradisers! In this video, we are going through high-timeframe, medium-timeframe, and lower-timeframe analysis. This multi-timeframe analysis is important for us to understand the whole context of the market, and that is how we are able to make the best trading decisions as professional traders.
I'm explaining to you that we are on the high-timeframe chart, trading inside of a channel ABC zigzag formation. From an Elliott Wave perspective, we are currently in the C wave, which is a motive wave, and we are creating the smaller secondary wave. We can see a bullish divergence confirmed, and we are waiting for RSI to have a successful bullish reclaim.
I'm updating you about the 0.61 Fibonacci retracement level and all of the confluences at around $116,000 and $117,000. From a medium-timeframe perspective, we are updating the Elliott Wave price action development count. I'm sharing with you the contracting triangle. The deviation that happened during the E wave, the confluence of the $116,000 and $117,000, and truly sharing with you how important this demand zone area really is.
Then we are moving our attention to low time frame analysis where I share with you the most probable price action development in the upcoming days, weeks, and months.
Paradisers! Keep in mind to trade only with a proper professional trading strategy. Wait for confirmations. Play with tactics. This is the only way you can be long-term profitable.
Remember, don’t trade without confirmations. Wait for them before creating a trade. Be disciplined, patient, and emotionally controlled. Only trade the highest probability setups with the greatest risk to reward ratio. This will ensure that you become a long-term profitable professional trader.
Don't be a gambler. Don't try to get rich quick. Make sure that your trading is professionally based on proper strategies and trade tactics.

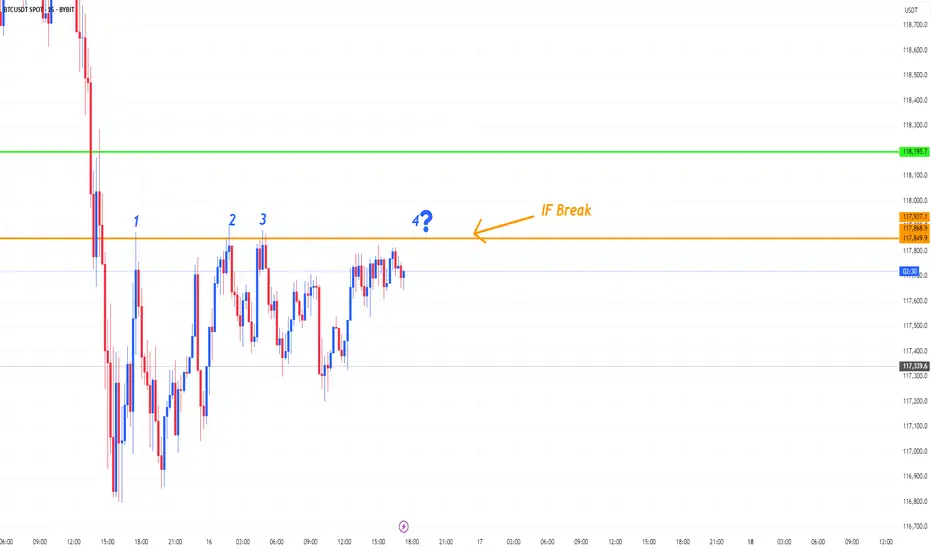
Is it possible to climb on the 4th attempt?
Hi my dears
In all the previous moves, a major resistance level has not been broken. Is there a possibility of this level being broken in the coming times? If and only if this level is broken with a good candle, then there is a possibility of an uptrend. So for now, the best decision is to watch.
What do you think, buddy?
TradeCityPro | Bitcoin Daily Analysis #150👋 Welcome to the 150th Bitcoin Analysis on TradingView by TradeCity Pro!
I am very happy that the number of daily Bitcoin analyses has reached 150. I hope the analyses have been useful so far and that you have been able to benefit from them. On this occasion, I want to present a complete and comprehensive analysis of Bitcoin.
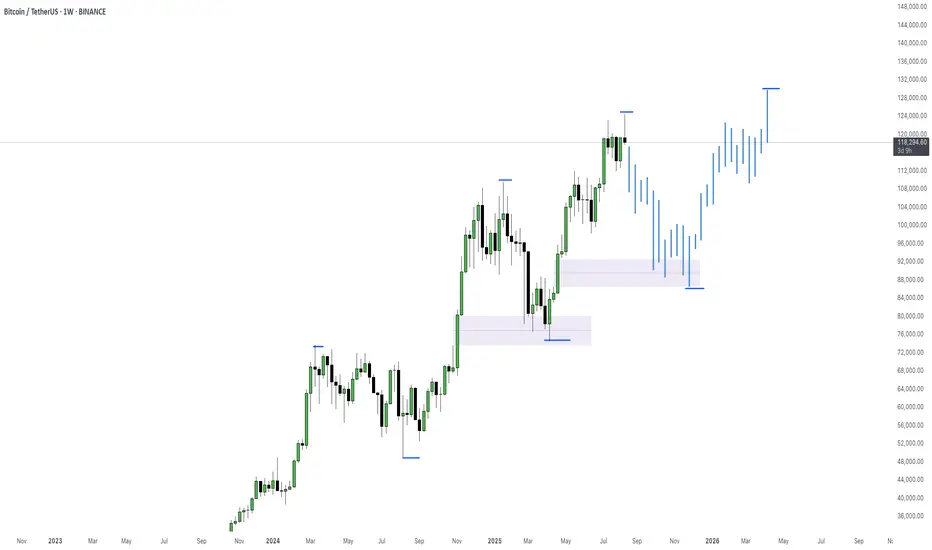
📅 Weekly Timeframe
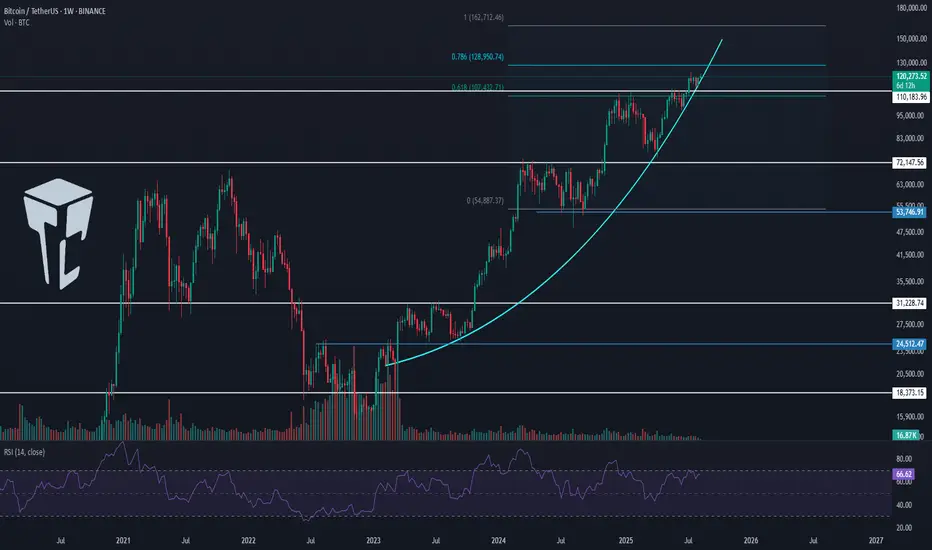
On the weekly timeframe, Bitcoin has been in a very strong uptrend since early 2023. After breaking the 24512 resistance, it made several sharp moves and, in multiple bullish waves, managed to register a new ATH in the 120000 zone.
✨ At the moment, it can be said that Bitcoin is in the seventh wave of its trend, which is quite a high number. The more waves a trend has and the more it shows signs of weakness, the higher the probability of a trend reversal.
📊 Regarding volume, there is not much to say because over time, Bitcoin’s trading volume on Binance has decreased. The reason is partly due to Binance exiting certain countries, and partly due to the growth of the DeFi space, where a significant percentage of trading now happens on DEXs, naturally reducing CEX volume.
⭐ However, if we compare the magnitude, slope, and candlestick size of the bullish waves, the trend weakness is clearly visible. But this does not mean the trend will reverse.
🧩 Many trends, even after showing weakness, continue for several more waves. If this happens for Bitcoin on the weekly timeframe, we can still take many long positions in futures during those waves.
💥 Therefore, this trend weakness is not a solid reason to avoid opening long positions for now. I still believe long positions in futures take priority over short positions.
🛒 For spot, if you have already bought Bitcoin, I suggest you keep holding for now. We can take profit after confirming the trend, but for now, it is better to hold.
🎲 However, for spot buying at current prices, I do not recommend it because it is not worth it. It is better to open futures positions to get a more reasonable profit.
🔔 Now that the 110000 resistance has been broken, the next targets are 128000 and 162000. If RSI enters the Overbought zone, these targets will be within reach.
📅 Daily Timeframe
In the last analysis I shared for this timeframe, the price was in a correction phase, and I mentioned that as long as the price is above 110183, the trend is bullish, and the probability of upward movement is higher than a drop.
🔑 That’s exactly what happened — the price formed a higher low above 110183, and RSI bounced from near the 38.21 support level and moved upward.
🔍 We had a Maker Seller zone between 120000 and 122000, and now the price has penetrated into it.
🔼 It seems to be getting rejected from the top of this zone and today failed to break it. Now we need to see what happens during the New York session.
✔️ In my opinion, it is unlikely that the price will break this top today. The market will probably wait for the U.S. inflation data release tomorrow before deciding on the next move.
📊 If inflation comes in higher than expected, the market will re-enter a correction phase, likely dropping back toward 110183.
📈 If inflation is lower than expected, Bitcoin can break the 122000 resistance and start a new bullish leg.
⏳ 4-Hour Timeframe
On this timeframe, Bitcoin finally broke through the Maker Seller zone it had formed, with a strong bullish candle. After RSI entered the Overbought zone, a Blow Off candle was printed near the 122733 resistance.
☘️ Currently, given the recent red candles, it appears that RSI’s entry into Overbought was a fake-out, and the price has pulled back to 120041.
⚡️ There is a possibility that the price could resume its upward movement from here, as the 120041 zone is an important level that can prevent further declines. In this scenario, the price would also have completed a pullback to the SMA7.
💥 If a deeper correction occurs, the next dynamic support is the SMA25, which is also an important momentum support.
📉 The lower static support levels for Bitcoin are currently 116829 and 115364.
❌ Disclaimer ❌
Trading futures is highly risky and dangerous. If you're not an expert, these triggers may not be suitable for you. You should first learn risk and capital management. You can also use the educational content from this channel.
Finally, these triggers reflect my personal opinions on price action, and the market may move completely against this analysis. So, do your own research before opening any position.
BTC | ALT Season, then BEARISH CYCLE BeginsBitcoin is likely moving in to the beginning of a bearish cycle.
I'm not saying this is immediate, we first need to see altseason - however, if BTC increases it may not go any higher than the last high of $123k. We could easily see the price hover around this zone with a few small increases and decreases for the next few weeks as alts make their respective moves.
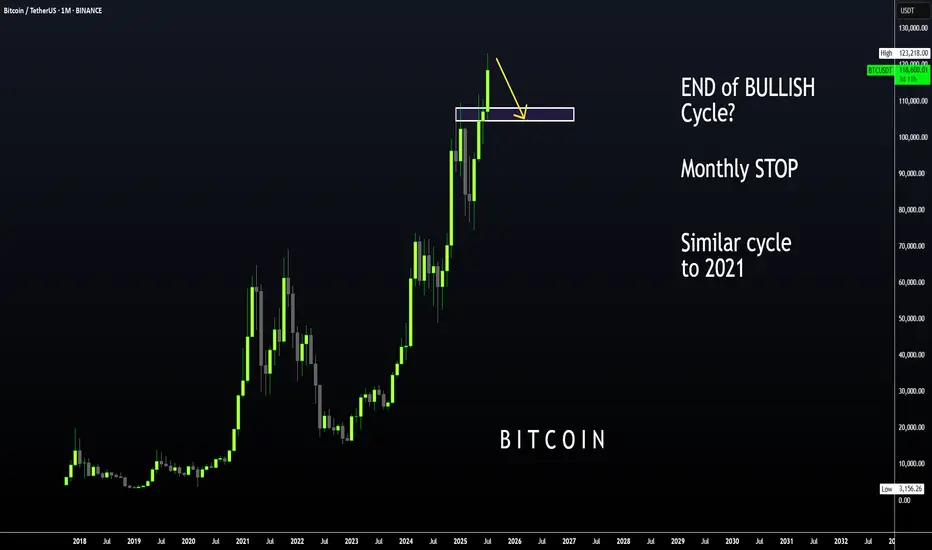
I have been talking about the 2021 fractal for a couple of months, where BTC took its time to correct and then made another ATH which was only slightly higher.
We already see a similar pattern playing out in the monthly timeframe if we overlay bars pattern from 2021:
Although Bonce zone 3 may only be in several months, these are the major support zones where BTC could bounce from. Ideal for a swing:
____________________
BINANCE:BTCUSDT
A clear head and shoulders pattern on Btc 4 h A clear head and shoulders pattern is forming on Btc 4 h
If price dropped below 117 k I guess it can continue falling until 114-113
Trade carefully
BTCUSDT - short.Short BTC from August to September targeting the weekly gap fill , then flip long mid-September through January for trend continuation .
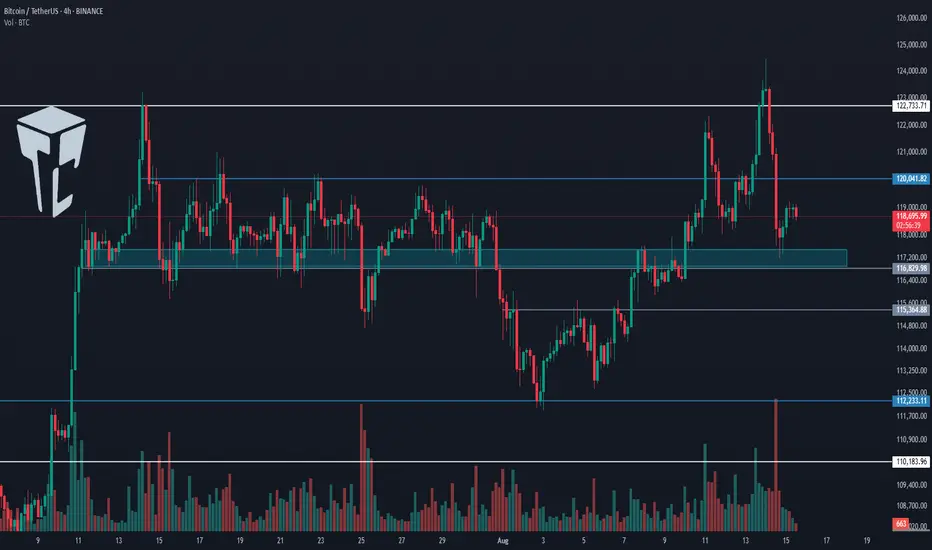
TradeCityPro | Bitcoin Daily Analysis #153👋 Welcome to TradeCity Pro!
Let’s move on to Bitcoin analysis — yesterday we saw Bitcoin’s reaction to the news, and now we’ll see what it plans to do today.
⏳ 4-Hour Timeframe
Yesterday, the 117,000 support level held, and Bitcoin managed to bounce from this area, preventing further decline.
✔️ As I mentioned before, if the price doesn’t close below this level, the overall trend remains bullish. As long as we stay above this zone, I’ll be looking for long triggers in the market, not shorts.
💥 Yesterday, with the news release, Bitcoin dominance saw an upward correction, but the overall trend remains bearish. If that continues, we can keep focusing more on altcoins.
🔔 Currently, there’s no trigger for opening a Bitcoin position, and personally, I’m not very eager to trade it now, because dominance is dropping, and as long as Bitcoin isn’t bearish, altcoins can keep moving up.
✨ Considering the sharp decline in volume in today’s candles, I think the chances are high that Bitcoin will range until the start of next week. If dominance continues its correction, the market won’t be giving us many trade setups over the next few days.
🔍 For now, it’s better to wait until our strategy’s structure and triggers form again, and then, once they’re activated, we can open our positions.
❌ Disclaimer ❌
Trading futures is highly risky and dangerous. If you're not an expert, these triggers may not be suitable for you. You should first learn risk and capital management. You can also use the educational content from this channel.
Finally, these triggers reflect my personal opinions on price action, and the market may move completely against this analysis. So, do your own research before opening any position.
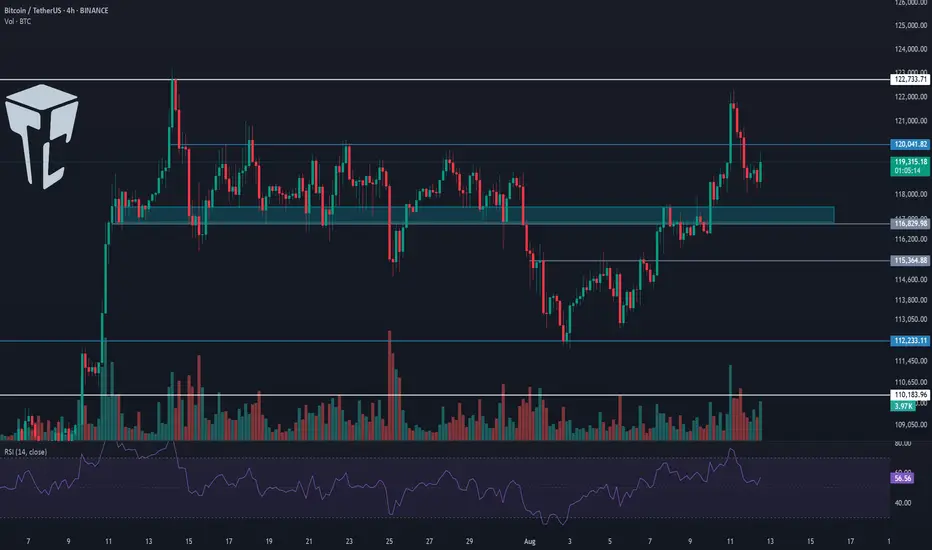
TradeCityPro | Bitcoin Daily Analysis #151👋 Welcome to TradeCity Pro!
Let’s dive into today’s Bitcoin analysis. Earlier today, the highly anticipated U.S. inflation data was released — let’s see how it has impacted Bitcoin.
⌛️ 4-Hour Timeframe
Bitcoin continued its correction yesterday, and remained in a corrective phase until today’s U.S. inflation news hit the market.
✔️ The news came out in Bitcoin’s favor, and we are now seeing a bullish engulfing candle on the 4-hour chart with solid volume. If this candle can close with a slightly larger body, it would be a strong signal for a potential continuation of the uptrend.
📊 As long as the price holds above the 116,829 level, I consider Bitcoin’s trend in LWC to be bullish. On the MWC, we are still ranging, and on the HWC, Bitcoin remains bullish.
🔔 Currently, there’s a resistance level at 120,041, which was previously faked out from above. We need to wait for the next tests to identify the precise resistance line.
✨ If this resistance at 120,041 breaks, a long position could be considered. The main trigger for confirming an MWC uptrend would be a breakout above 122,733. However, I recommend aiming to enter on the 120,041 breakout instead, as waiting for 122,733 might be too late — the move would likely be sharp, with no ideal entry candle.
🔽 On the other hand, if the current candle turns into a wick and closes red, Bitcoin could enter a deeper correction toward the 116,829 and 115,364 zones.
💥 If RSI closes below 50, that would give a momentum-based confirmation of bearish conditions, increasing the likelihood of a corrective scenario as selling momentum builds in the market.
❌ Disclaimer ❌
Trading futures is highly risky and dangerous. If you're not an expert, these triggers may not be suitable for you. You should first learn risk and capital management. You can also use the educational content from this channel.
Finally, these triggers reflect my personal opinions on price action, and the market may move completely against this analysis. So, do your own research before opening any position.
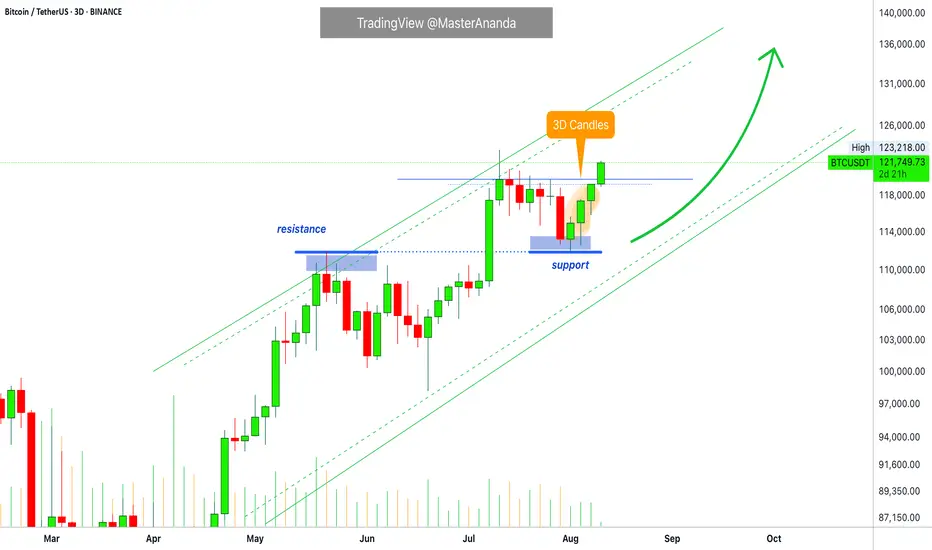
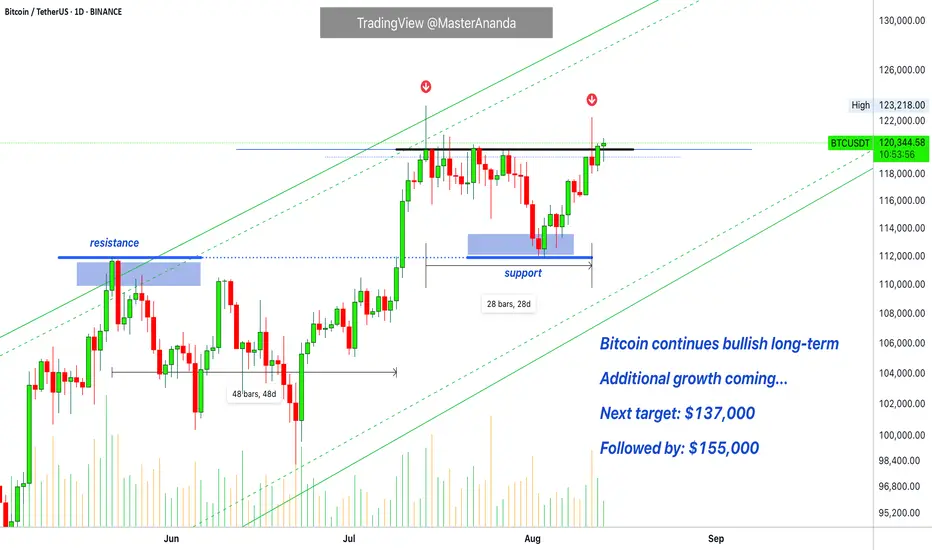
Bitcoin 3D · $137000 Next Target & The Altcoins Market & MercuryBitcoin continues to look awesome. The next target is $137,000 short to mid-term, let's say within 1-2 months. Certainly Bitcoin will continue growing after this target. It comes up and we know when this level is reached there will be a stop. Just as Bitcoin stopped after reaching $123,000. A small pause, a small retrace and then more growth.
We are now in the more growth phase, you are looking at 3D candles. Just today, 11-August 2025, a new 3D session started and as you can see, full green. Bitcoin is now trading at is highest price ever since the all-time high. At resistance, challenging resistance, ultra-bullish.
There are many signals that support a bull market, bullish growth, bullish continuation, bullish impulse, bullish resumption, bullish trend and long-term growth. One of the strongest signals comes from the altcoins.
When Bitcoin consolidates at a high price, it is hard to know if the next move is down or up, the market always goes into a frenzy and half go SHORT the other half go LONG.
You don't have to guess. If the altcoins are rising while Bitcoin is consolidating, this means that the consolidation will lead to additional growth. If the altcoins are dropping while Bitcoin is consolidating, this means that the consolidation phase will end as a breakdown with lower prices.
We see the altcoins growing; we saw the new multiple years high Ether (ETH) did. We know how the smaller altcoins are performing after looking at hundreds of charts. We know the market is not red. We know some are lagging behind or some are way ahead... We know, we know, we know... We know the market is painful when it is bearish; we know the market is quite generous when it is set to grow.
The market does not discriminate between down or up. When it is going down, it will activate all of your stop-loss and beyond. When it is going up, it will fill up all of your sell orders and then go higher... That's how the Cryptocurrency market works.
We are set for the final stage of the bull market, for Bitcoin. For some projects the bull market starts now and will go for years on end. There will be strong variations. Allow for strong variations. I already adapted and this will be a great development because opportunities will be available always. This is the turning point. Mercury stations direct today.
Namaste.
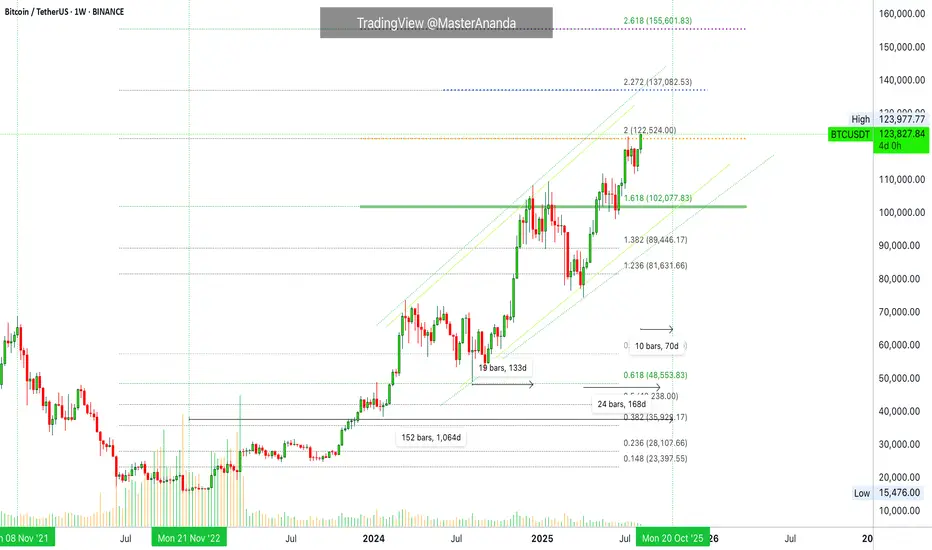
Bitcoin's New All-Time High, Corrections & Bear Market DurationFrom the low in December 2018 until the high in November 2021 there is a period of 1064 days. That's how long the last bull market lasted from bottom to top.
The current cycle started November 2022 with the previous bear market bottom. If we project 1064 days into the future this would put us at the week of 20-October 2025.
Bitcoin rose 65% in 98 days. Between 7-April and 14-July.
Mid-August 2025 through 20-October 2025 gives a total of 70 days.
Do you think Bitcoin will stop rising and produce a long-term bear market after 70 days?
The rise between August 2024 and January 2025 lasted 168 days. 133 days with the December 2024 peak.
168 days starting 7-April 2025 would give us a date around 22-September 2025.
The main question is this: How strong is Bitcoin likely to drop after major growth?
The new all-time high and final peak for this cycle can be $180,000 to $200,000, but strong resistance will be faced around $155,000. Seeing for how long Bitcoin has been moving, do you think a strong correction can happen at 155k? Absolutely.
Think of August 2024. Something like this.
Bitcoin keeps on growing and once this level is reached a flash crash, 30% off or maybe even 35% in a flash. Then a long-term recovery and bullish resumption toward 200K and beyond. And it keeps on going, bear markets being nothing more than a correction. No more bear market but mild, strong or weak corrections.
The next target is $137,000 and this is an easy level. Watch out for $155,000. It is a mixed bag, the market will not behave in expected ways. It will be unpredictable on the short-term. You can predict the bigger picture though, it is going up. When in doubt, hold strong (and follow).
Namaste.
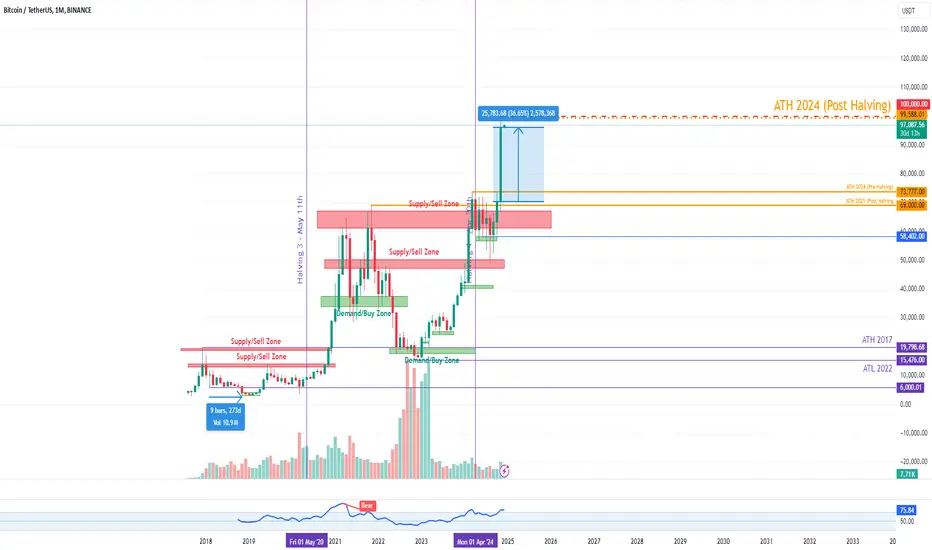
BTCUSDT_M_011 Post Halving BreakoutThe recent U.S. presidential election, won by the Trump/Vince camp, has sparked a wave of optimism in the digital asset space, signaling a promising future for cryptocurrencies. The election results triggered a strong market reaction, with Bitcoin experiencing a significant price surge, breaking out of a multi-month accumulation phase. November was particularly remarkable, with Bitcoin closing the month with a massive $25,000 green candle—the largest monthly gain in its history.
Currently, Bitcoin’s circulating supply stands at approximately 94%, or around 19.8 million coins, translating to a market capitalization of roughly $1.9 trillion. Looking ahead, market sentiment is overwhelmingly bullish, with key expectations including a breakthrough of the $100,000 barrier. This milestone could prompt long-term holders to realize profits, while fresh retail capital is likely to flood the market, driven by the psychological impact of six-figure pricing. As a result, the bullish momentum is anticipated to continue, reinforcing Bitcoin's dominance in the broader financial landscape.
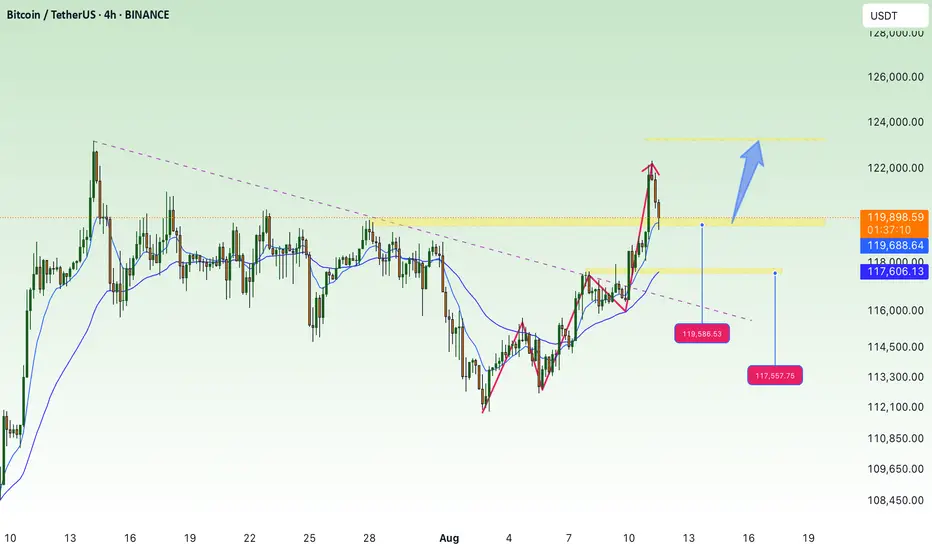
BTC Tries To Start Another Upward MoveBTC Tries To Start Another Upward Move
Bitcoin is making another push to start a bullish trend.
This setup was shared earlier, but now BTC has expanded into a larger bullish pattern.
BTC is trying to rise again. If the current breakout holds, we could see further upside, as shown in the chart.
The first key target is around 122,650, a crucial level.
If BTC breaks through this zone, the upward move could continue toward 126,200 and then 130,000.
You may find more details in the chart!
Thank you and Good Luck!
PS: Please support with a like or comment if you find this analysis useful for your trading day

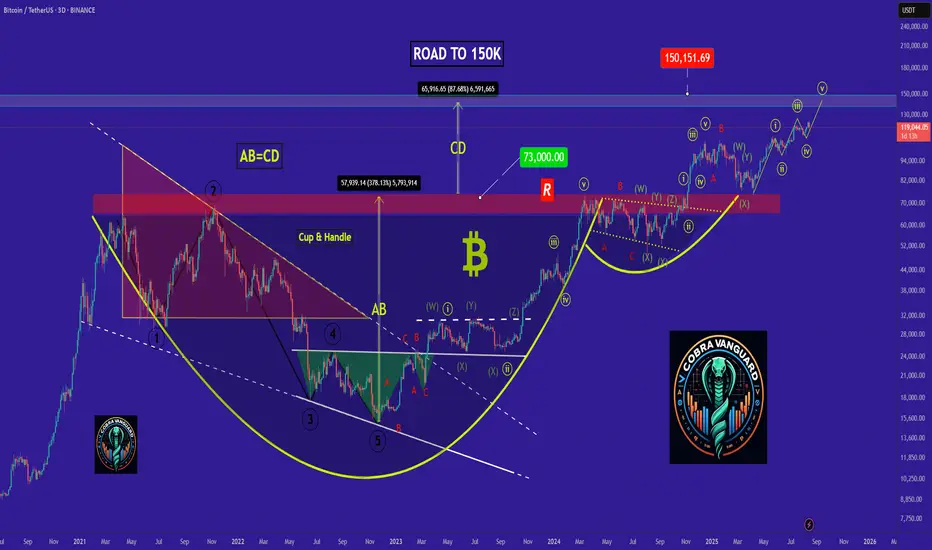
bitcoin - Time to buy again!The price seems to have completed the fourth corrective wave, and from now on, it's time for a price increase, which will continue up to around $150k .
previous analysis
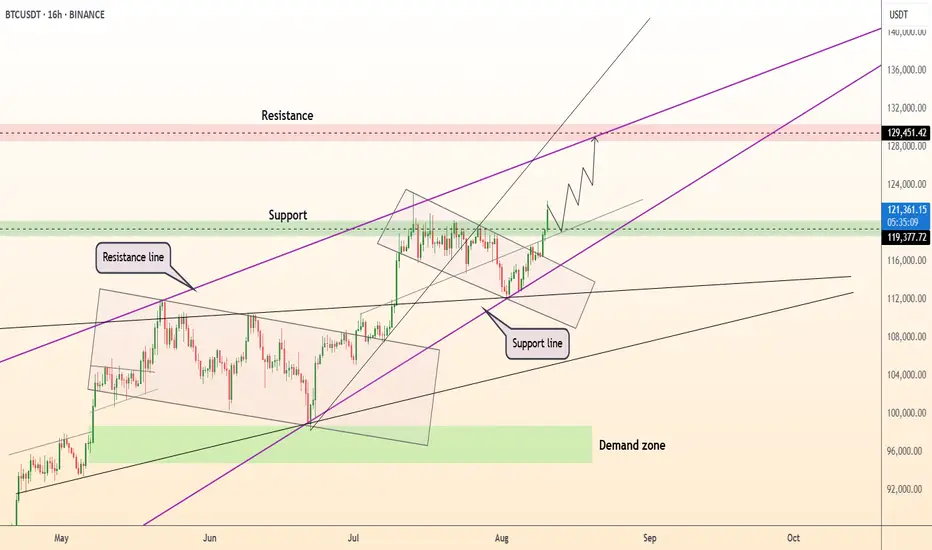
DeGRAM | BTCUSD exceeded $120k📊 Technical Analysis
● BTCUSD has broken above the 119.4k–119.9k support-turned-resistance zone, confirming a bullish channel breakout.
● Structure favors a climb toward the 129.4k resistance, with short-term pullbacks expected to retest the green support band before continuation.
💡 Fundamental Analysis
● ETF inflows hit a 3-month high as institutional interest in BTC strengthens amid rising inflation-hedge demand.
● On-chain metrics show increased miner accumulation, signaling confidence in higher future prices.
✨ Summary
Long above 119.4k. Targets 125k → 129.4k. Setup holds if price remains above 118.5k.
-------------------
Share your opinion in the comments and support the idea with a like. Thanks for your support!
Bitcoin Update · Rejection Nullified · $135,000 Short-TermBitcoin's lower high and rejection at resistance has been nullified already after just one day. This means that the market is bullish and confirmed to continue rising. The bearish signal previously mentioned has been fully nullified.
Bitcoin is likely to continue to challenge resistance though or grow only slowly, more consolidation, while the altcoins market bullish cycle unravels. It is a long process.
While the action looks good above resistance, black line on the chart, it can move back down and continue to fluctuate for days, weeks or months. In this case, months is not a possibility so we are left with only weeks or days.
Bitcoin can continue with its consolidation at resistance for a few days or some weeks at max and then we are at the next high. Market conditions will be very different when Bitcoin trades at $135,000 vs $120,000. Things will be even harder to manage when Bitcoin trades at $155,000 vs $135,000, but this is where we are headed. The bulls own the game.
The altcoins market will look so much different and everything will be up 200-300%. This timeline is expected to develop in the coming 60 days.
The bull market will continue to unravel and prices will continue to grow all across Crypto.
Thank you for reading.
Namaste.
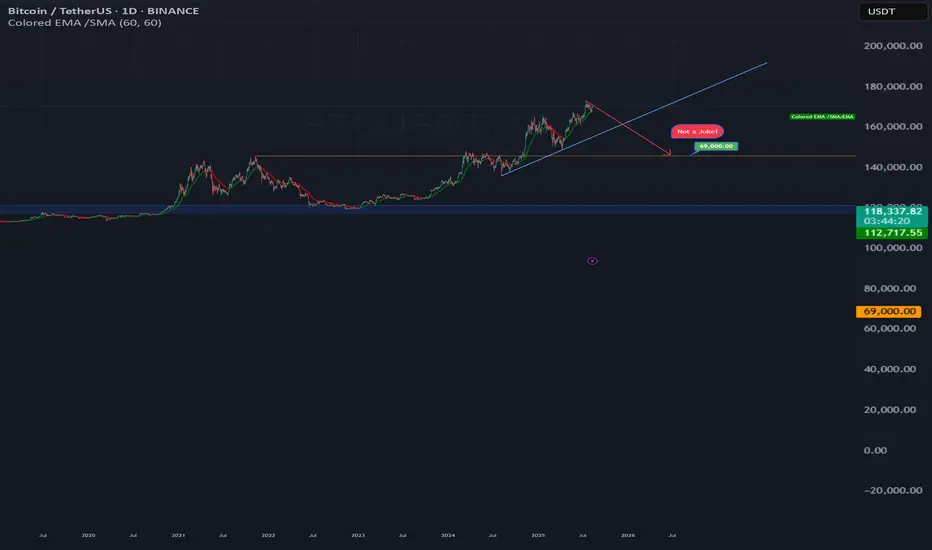
Warning : BTC 69000 Soon!!!! The current Bitcoin price will not hold!!!!
I’m calling for a sharp and decisive fall toward 69K. This is not based on standard TA patterns — it’s from a broader view of market cycles, sentiment extremes, and the unsustainable nature of the current rally.
Too much leverage, overconfidence, and speculative positioning have built up. The conditions are set for a cascade that will catch most traders off guard. When it starts, it will move faster than most expect, and the narrative will shift from euphoria to panic.
My target is clear: 69K. This is not a warning of a small dip — this is a call for a major reversal.
Not financial advice. This is my forecast.
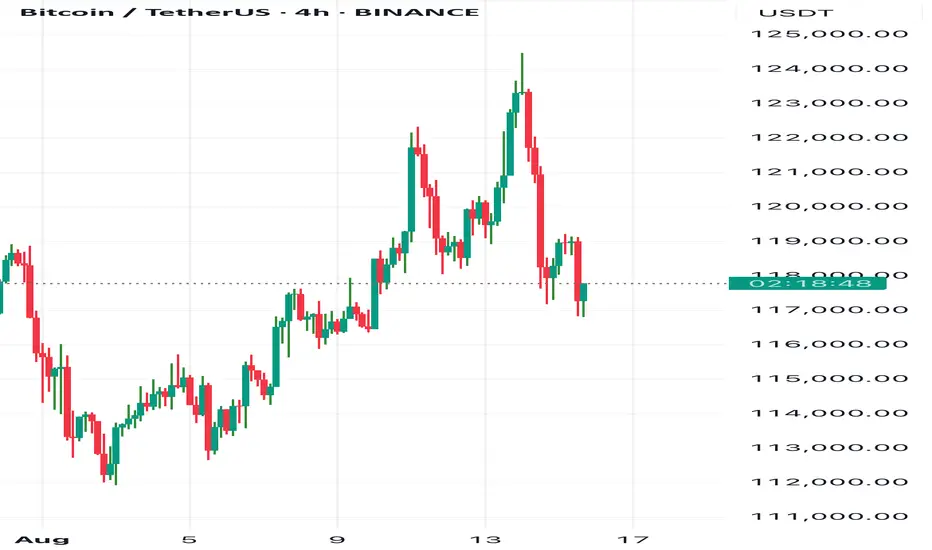
continue to increase in price, towards old ATH💎 BTC WEEKLY PLAN UPDATE (11/08)
1. Overall Trend:
BTC has completed a 5-wave Elliott impulse and is currently in a corrective phase after wave (5).
The main trend remains bullish, as the wave structure has not broken and price is still above key EMA lines.
2. Fibonacci Levels:
The current correction may retrace to the following Fibonacci support levels:
• 0.382 Fibo: ~118,800 USD (aligns with strong support)
• 0.5 Fibo: ~117,800 USD (close to EMA and trendline)
These are potential price zones where the market may rebound.
3. Support & Resistance Zones:
• Near-term Support: 118,000 – 117,500 USD (combination of Fibo + EMA + broken trendline).
• Near-term Resistance: 120,000 USD (previous high).
• Next Resistance: 122,000 – 123,000 USD (Fibo extension target 2.618).
4. Main Scenario:
BTC retraces to 118K – 117.5K → rebounds → breaks 120K → moves towards 122K – 123K.
5. Trading Notes:
• Prioritize entries when price reacts well at 118K – 117.5K support zone.
• Stop loss if H4 closes below 117K.
• Stay patient, as corrections are normal before the next upward move.
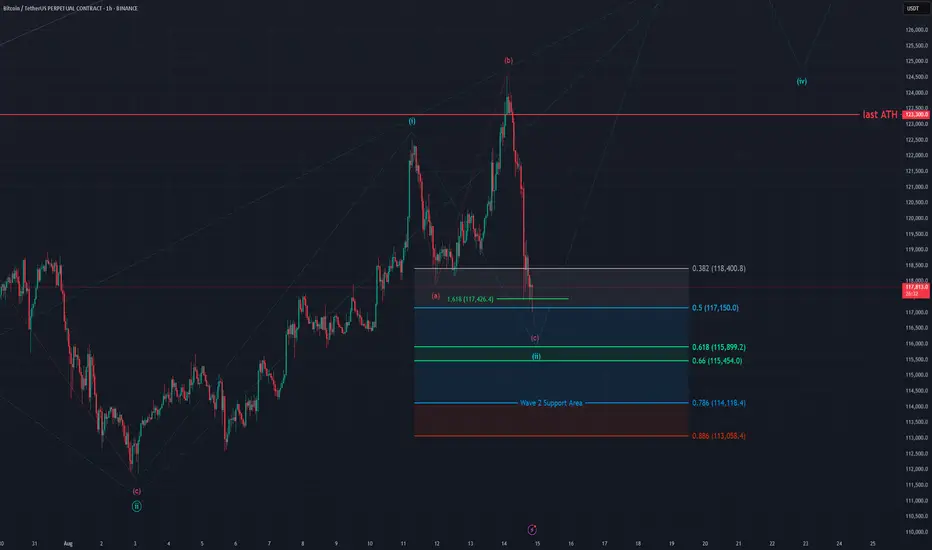
BTC - 1H Elliott Wave Analysis- 14.08.25Welcome!
We got our move down in the red Wave C that we were talking about after we briefly took out the ATH which we warned about in our last Analysis. :)
The Wave C hit the 1.618 FIB at 117426 USD which is a common target in an expanding Flat as ABC. We did also touch the 0.5 FIB of the Wave 2 support area at 117150 USD. The price still could climb down a few more dollars into our Wave 2 support area but we expect a bounce soon. The blue Wave 2 support area lies between the 0.382 FIB at 118400 USD and the 0.786 FIB at 114118 USD.
Thanks for reading.
NO FINANCIAL ADVICE.
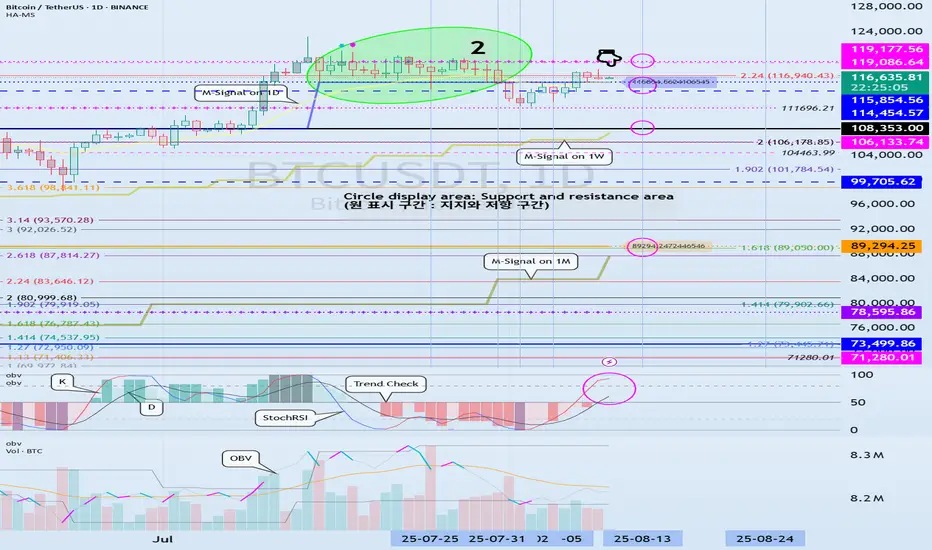
Support and Resistance Areas: 114454.57-115854.56
Hello, traders!
Follow us to get the latest information quickly.
Have a great day!
-------------------------------------
(BTCUSDT 1D Chart)
The K indicator on the StochRSI indicator appears to have entered the overbought zone, leading to a change in slope.
Therefore, the upward trend appears likely to be constrained.
-
We need to confirm whether the price falls within the range indicated by the index finger.
The key question is whether there is support around 114454.57-115854.56.
If it declines, it is likely to continue until it meets the M-Signal indicator on the 1W chart.
At this point, we need to check for support around 108353.0.
This period of volatility is expected to occur around August 13th (August 12th-14th).
The start of a stepwise uptrend is likely to occur only after it rises above 119177.56.
-
Thank you for reading to the end.
We wish you successful trading.
--------------------------------------------------
- This is an explanation of the big picture.
(3-year bull market, 1-year bear market pattern)
I will explain in more detail when the bear market begins.
------------------------------------------------------
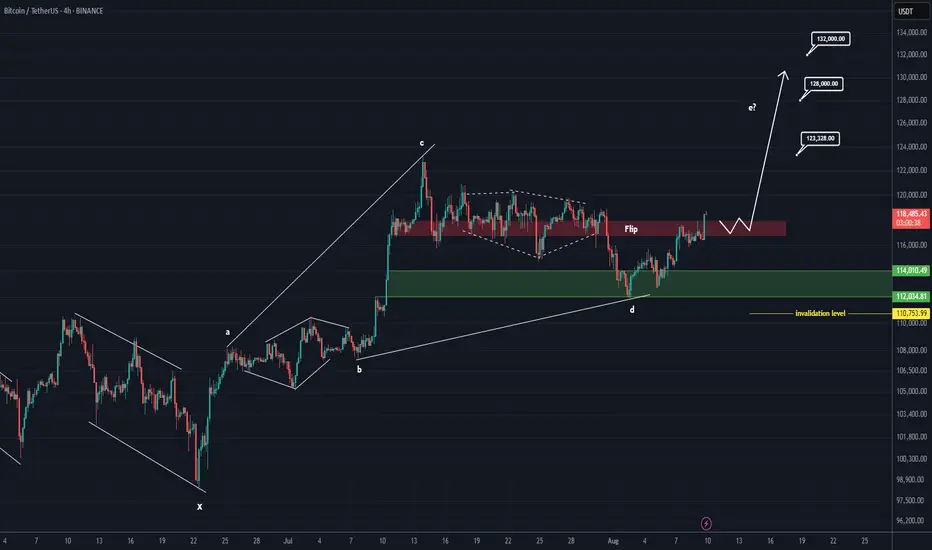
Bitcoin is super bullish (4H)This analysis is an update of the analysis you see in the "Related publications" section
If you’ve been following our previous analyses, we had a bullish outlook on Bitcoin from the lower green zone.
An important level on the Bitcoin chart has been reclaimed, and it is expected to move toward the next targets if it consolidates above the red box.
The targets are marked on the chart.
A daily candle closing below the invalidation level will nullify this analysis.
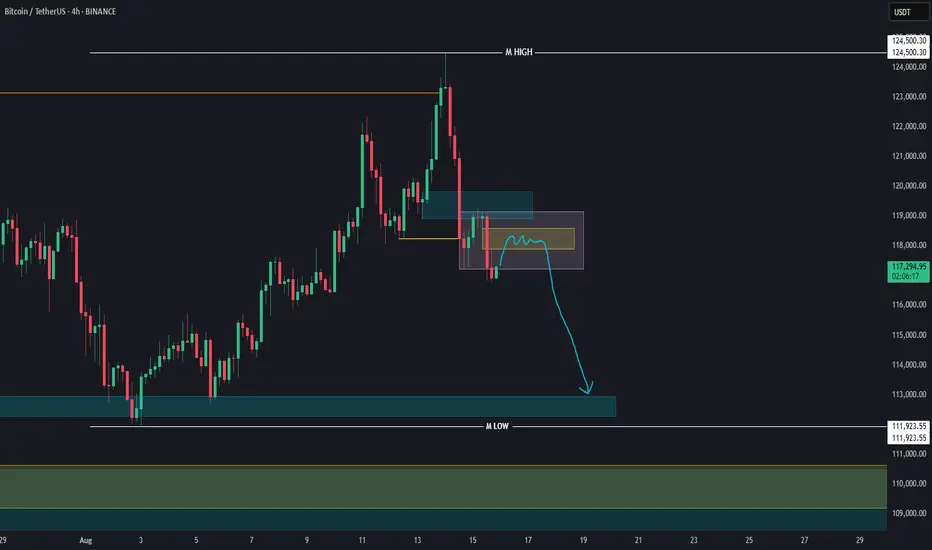
BTC Selling Pressure After sweeping high level of liquidity and showing a clear market structure shift, we might see strong selling pressure coming days targeting 112K – 114K.
BTC - 1H Elliott Wave Analysis - 13.08.25Welcome back! ^^
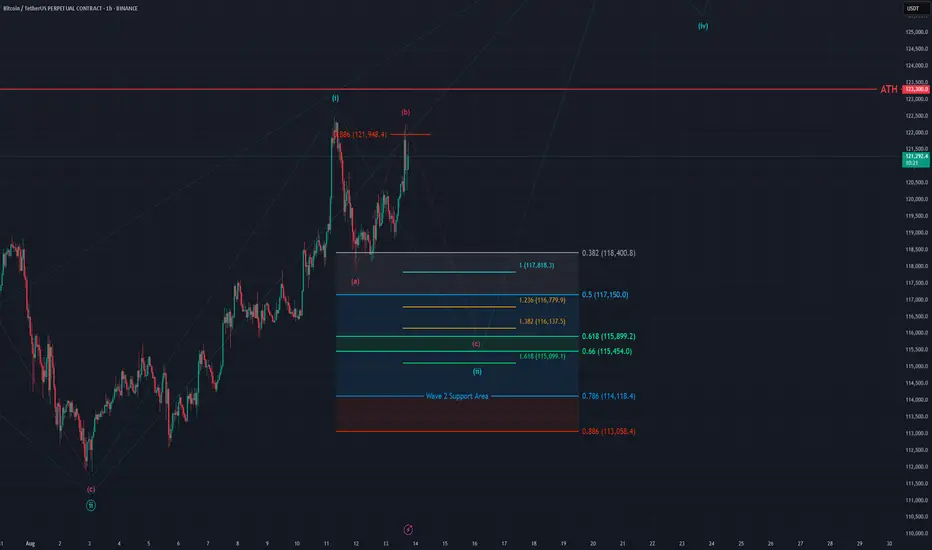
Since yesterday we saw a bit more momentum towards to the upside but the case still stays the same. We assume that the recent top could be a Wave 1 and we are looking for a retracement in Wave 2 as a red ABC of which we already finished the Wave A and potentially Wave B in today's move up.
The Wave 2 support area lies between the 0.382 FIB at 1184000 USD and the 0.786 FIB at 114118 USD.
The Wave C targets are the 1 to 1 FIB at 117818 USD which is the most common target and it is right below the low of Wave A. Further targets are the 1.236 FIB at 116779 USD, the 1.382 FIB at 116137 USD which is right above the golden pocket and additionally at the same price level as the price action of the 8th to 10th August which could function as further support and as last the 1.618 FIB at 115099 USD.
Be aware that the Wave B could extend to the upside and turn into an overshooting B Wave. It can even take the ATH briefly but if we break above the 125k price level this count get's less probable and we are either in a more complex bigger correction or the red Wave A was already the whole Wave 2 correction which would be valid as it touched the 0.382 FIB of the support area at 118400 USD.
Thanks for reading.
NO FINANCIAL ADVICE.