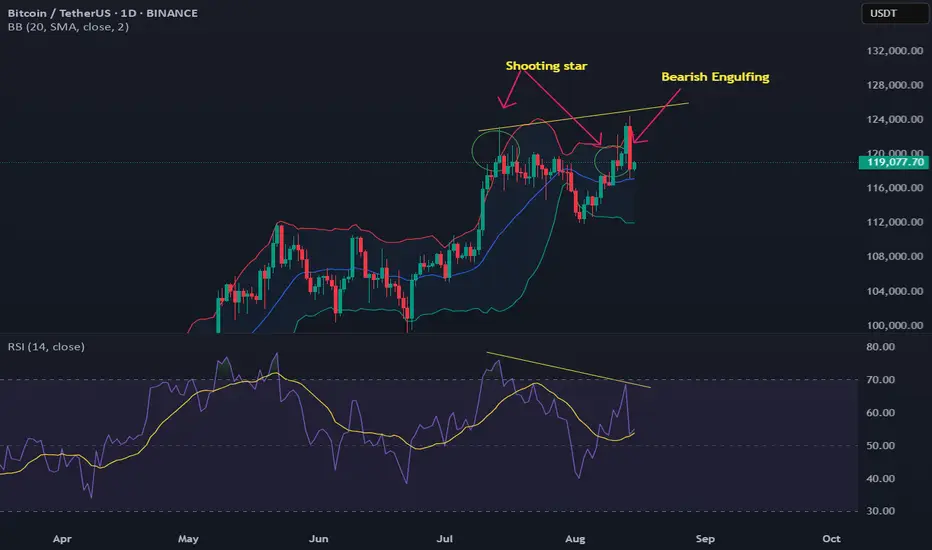
High-Probability Bearish Case for Bitcoin (BTC)Bitcoin Bearish Technical Setup (Daily Chart):
📉 Upper Bollinger Band Touched
→ Signals potential overbought conditions and resistance near current price levels.
🌑 Two Consecutive Shooting Star Candlesticks
→ Indicates strong rejection from the highs and potential exhaustion of bullish momentum.
🔻 Bearish Engulfing Candle
→ Confirms sellers are gaining control; often marks the start of a downtrend.
📉 RSI Bearish Divergence
→ Price made higher highs while RSI made lower highs — a classic signal of weakening bullish momentum and possible reversal.
USDTBTC trade ideas
Ouch… Let’s Talk About ItAfter that heavy rejection, a lot of traders are stuck wondering what’s next.
In this short analysis, I’ll break down the situation in plain language and share the exact long & short triggers I’m watching — with stop levels that actually make sense in this volatility.
Clear, simple, and straight to the point.

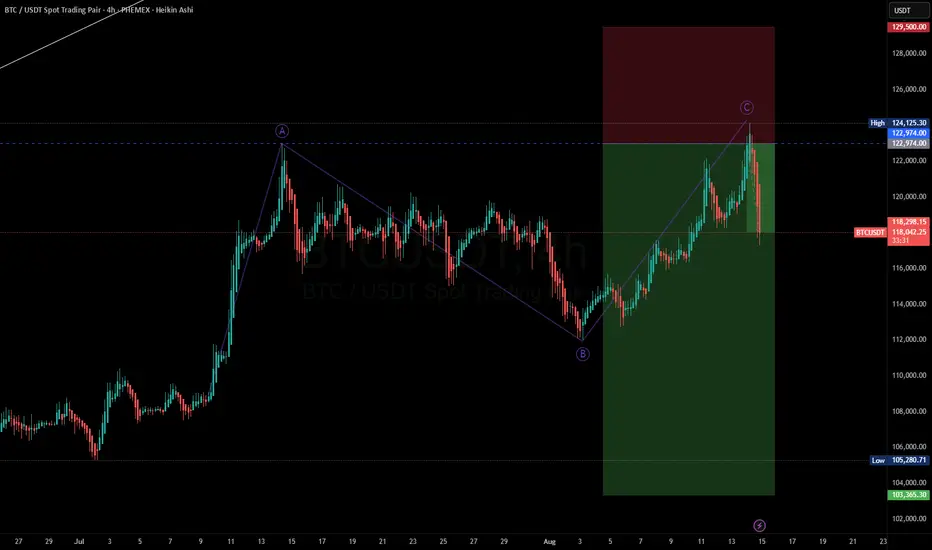
BTC ShortABC short formation, entry right above A by $1 in price. Sizable stop to reduce potential stop outs. 2-5% portfolio max loss per stop. Take profit ran with stop orders, so no set price.
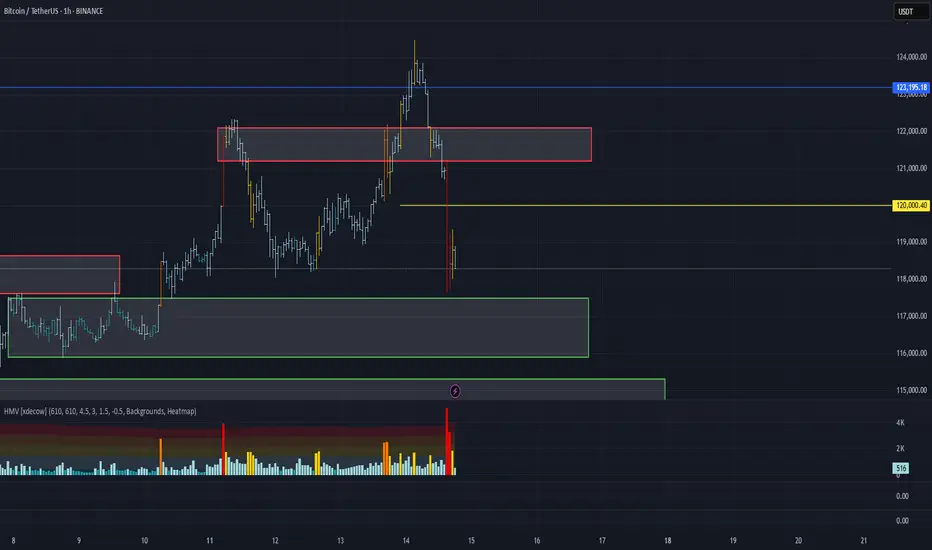
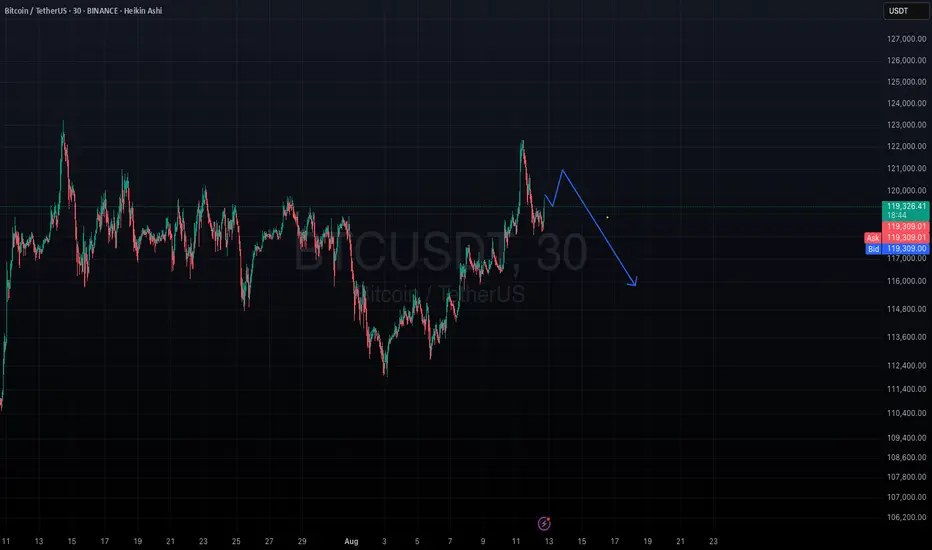
BTC/USDT – $124k ATH swept, sharp rejectionSummary: BTC tagged the 123.6–124.6k supply and reversed hard. Price is parked around 118k (prior base/equilibrium). Intraday structure = lower highs; 4H momentum neutral→bearish unless 120.6k is reclaimed.
Market check (now): Trading near 118k after a $124k spike and fast selloff.
News drivers (condensed): Fresh ATH headlines triggered profit-taking; macro tone supportive on rate-cut hopes; ETF/institutional demand remains a tailwind but near-term stretched conditions invited a fade.
Key levels
Resistance: 119.6–120.2k, 120.8–121.4k, 123.6–124.6k
Support: 117.6–118.0k, 116.2–116.8k, 114.5–115.2k, 112.0–112.8k
Bias & triggers
Bearish below 119.6–120.2k. Failure there keeps pressure toward 116s → 115s → 112s.
Bullish only on strong reclaim of 120.6k+. Acceptance above opens 121.4k → 122.4k → 123.6–124.6k.
Plan (idea)
Short setup: Look for rejection at 119.6–120.2k or a clean break/close <117.6k → targets 116.8k, 115.2k, 112.5k.
Long counter-trend: Only if price reclaims and holds >120.6k with momentum → 121.4k / 122.4k; stretch to 123.6–124.6k if demand persists.
Invalidation: Shorts invalid if price sustains >121.4k; longs invalid on a 4H close <117.6k.
Read: After the $124k sweep, the local uptrend line broke; 4H EMAs flatten and 30m prints lower highs. 118k is the pivot—acceptance below favors 116s–115s; swift reclaim of 120.6k signals bears losing grip.
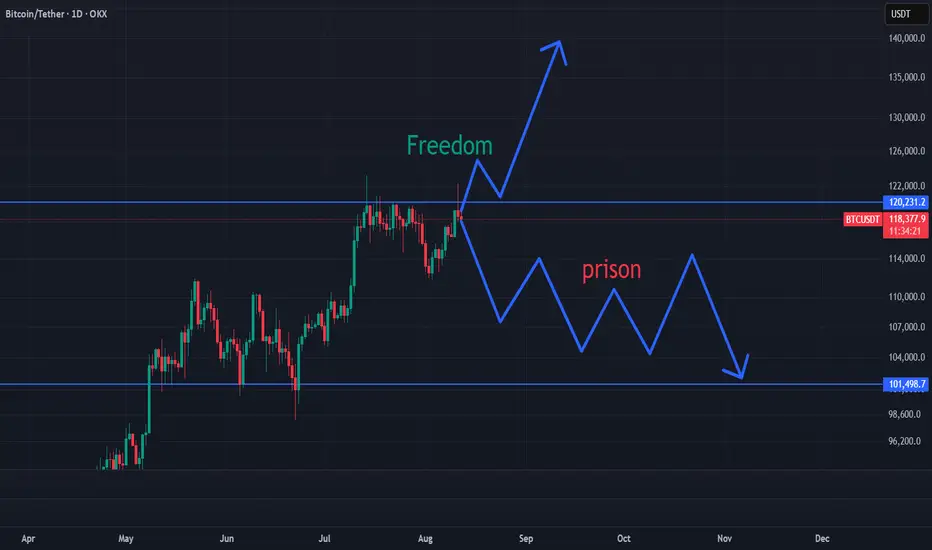
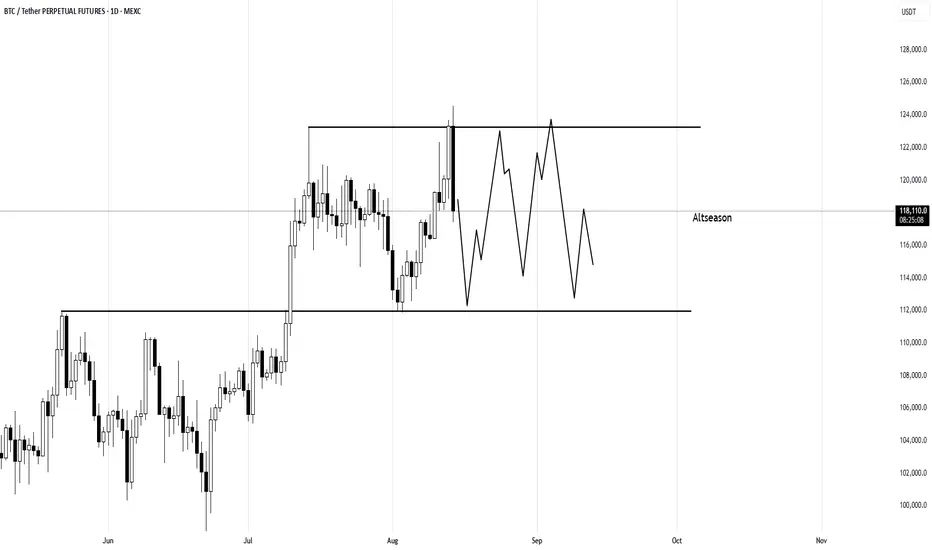
This is what Altseason looks like on BTC chart
- Bitcoin tops out
- Then consolidates in a range
- Meanwhile Alts wake up, go parabolic after each bounce from the support
Last cycle, Ethereum doubled while BTC was just ranging sideways
Altcoins went full degen mode
Right now, BTC looks like it's entering that same top chop zone again.
So we may now see a pull back across the board - Then the real fun begins
Scenario i'm closely watching rn:
- BTC ranges or does a fakeout
- Alts Bleed → Base → Bounce
- September-October Altcoin madness
The quiet phase is when positions are built
🔥Follow for updates if this plays out🚀
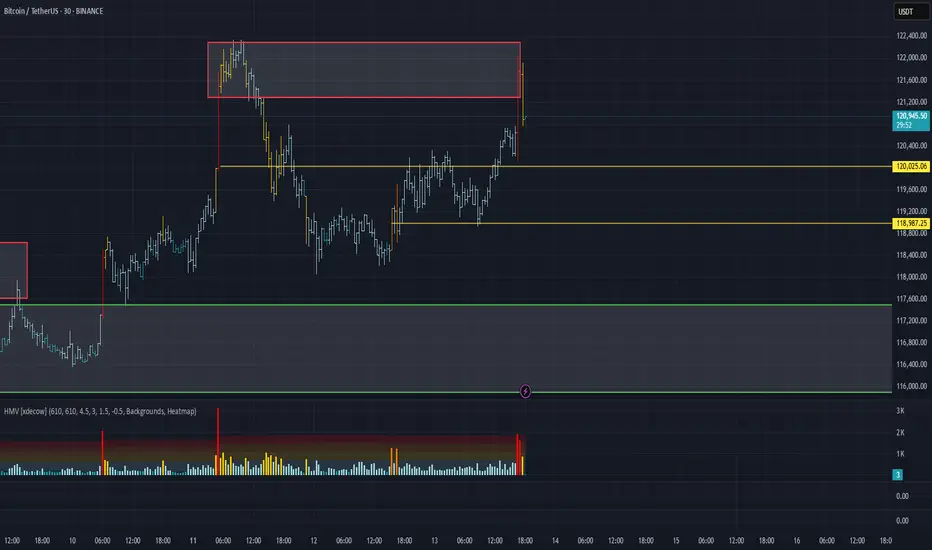
BTC/USDT Analysis. Negative News
Hello everyone! This is the CryptoRobotics trader-analyst, and here’s your daily analysis.
Yesterday evening, Bitcoin tested its all-time high. At the time, no major profit-taking was observed; however, starting from midday today, the price sharply moved downward. The drop was triggered by weak U.S. Producer Price Index (PPI) data and a statement from the U.S. Treasury Secretary indicating that there are no plans to replenish the country’s Bitcoin reserves through purchases.
As a result, the price tested a local low, stopping just short of the $117,500–$116,000 buy zone (accumulated volumes). For now, it’s important to watch the buyer’s reaction. In any case, based on the current structure, we could see another wave of selling from around $120,000 — where a strong imbalance in both volumes and delta has been recorded — or from the $121,000–$122,200 area (buy absorption).
Entering positions at the moment is not recommended, as the current structure partially conflicts with the volume distribution.
Buy zones:
$117,500–$116,000 (accumulated volumes)
$115,300–$114,000 (accumulated volumes)
Sell zone:
$121,200–$122,200 (buy absorption)
This publication is not financial advice.
What the Heck is Happening? Core PPI Spike & Fed’s Tough ChoiceCrazy market moves, weird data spikes… and everyone’s confused.
In under 2 minutes, I’ll break down what’s going on — and why it matters for your trades.
If it helped, smash that boost—it fuels my mission!

BITCOINSHOULD price comes into 117k-117,300-118k look for buy opportunity and a break below this level will be out of the may ascending trendline .we will be looking for sell opening.

bitcoin bitcoin gets rejected at the supply roof of the ascending channel acting as dynamic resistance to upswing.
if we come down to 117,900k and 118k am looking for buy opportunity.
trading is 100% probability.

BTCUSDT Analysis: Key Drivers beyond Technical Insights Bitcoin is near new all-time highs, and there are three big reasons why. Let's break them down.
1. 📜 Favorable Regulation s
New, more open regulations in the U.S. are boosting investor confidence and creating a stable environment for crypto.
2. 💰 Crypto in 401(k)s
An executive order now allows cryptocurrencies in 401(k)s, integrating crypto into mainstream retirement planning.
3. 📉 Potential Interest Rate Cuts
Anticipation of future interest rate cuts is making riskier assets like Bitcoin more attractive to investors.
All these factors have contributed to sustained confidence among long-term holders.
Technical Insights
1. 1st Retracement: Towards the recent breakout area 118K$ to 120K$
2. 2nd support: Order Block, which is near 113K$ to 115K$
3. For medium-term support, Fibonacci Golden level around 108K$.
Disclaimer:
The information provided in this chart is for educational and informational purposes only and should not be considered as investment advice. Trading and investing involve substantial risk and are not suitable for every investor. You should carefully consider your financial situation and consult with a financial advisor before making any investment decisions. The creator of this chart does not guarantee any specific outcome or profit and is not responsible for any losses incurred as a result of using this information. Past performance is not indicative of future results. Use this information at your own risk. This chart has been created for my own improvement in Trading and Investment Analysis. Please do your own analysis before any investments.

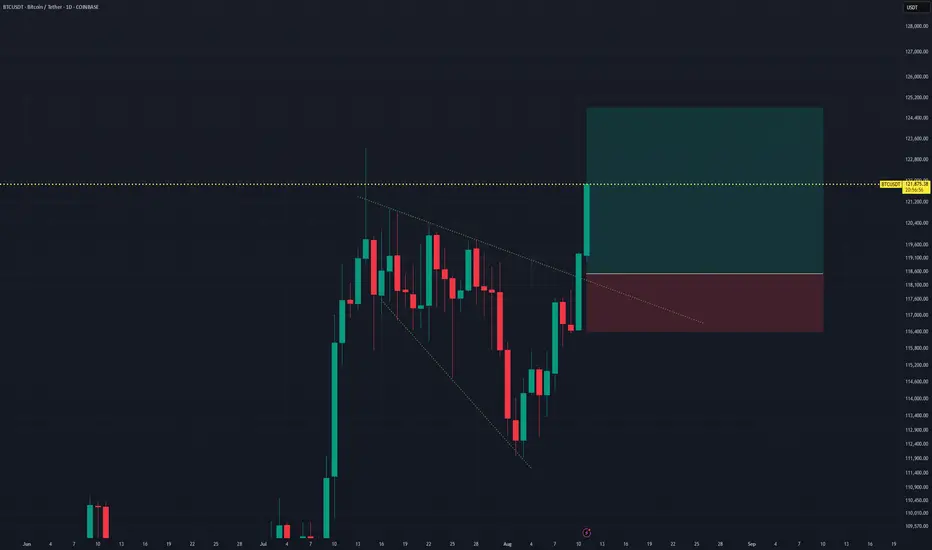
Bitcoin Btc usdt daily analysis
Time frame daily
Btc reached my target
It reached new high price last night about 125.000 $
I think btc will play in yellow box that you can watch in the chart and let other assets to grow up
Alt party has started
BTCUSDT Bullish Breakout Setup From Descending TriangleTrade Setup Analysis
- Timeframe: Daily (D1)
- Position Type: Long (Buy)
Entry Point: 118,530.49
Positioned immediately after a breakout from a descending triangle pattern, aiming to catch early bullish momentum.
Stop Loss (SL): 116,429.15
Placed below recent swing lows and under the lower trendline of the triangle. A break below this level would invalidate the bullish breakout thesis. Risk exposure is approximately -1.77% from entry.
Take Profit (TP): 124,868.05
Target set at a key resistance zone, offering a potential upside of around +5.30% from entry.
Risk/Reward Ratio: 2.99
A strong setup with nearly three times the reward compared to the risk, suitable for short-term swing trading.
Technical Outlook:
BTCUSDT has broken out of a descending triangle formation with a strong bullish candle, indicating possible continuation. The entry at 118,530 positions the trade close to the breakout point, maximizing profit potential if momentum holds.
Bullish Scenario: Sustained price action above 118,530 could lead to a rally toward the 124,868 target.
Bearish Invalidation: A breakdown below 116,429 would invalidate the bullish setup, potentially resuming the prior downtrend.
Summary:
This trade captures a breakout confirmation with a well-placed stop below structural support and a target aligned with the next resistance level. Monitoring for follow-through buying pressure is key to validating the trade.
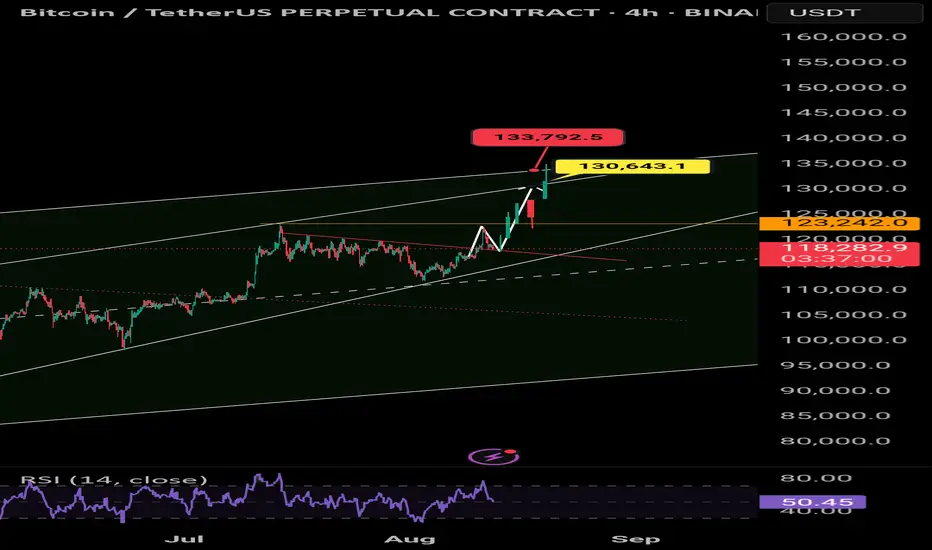
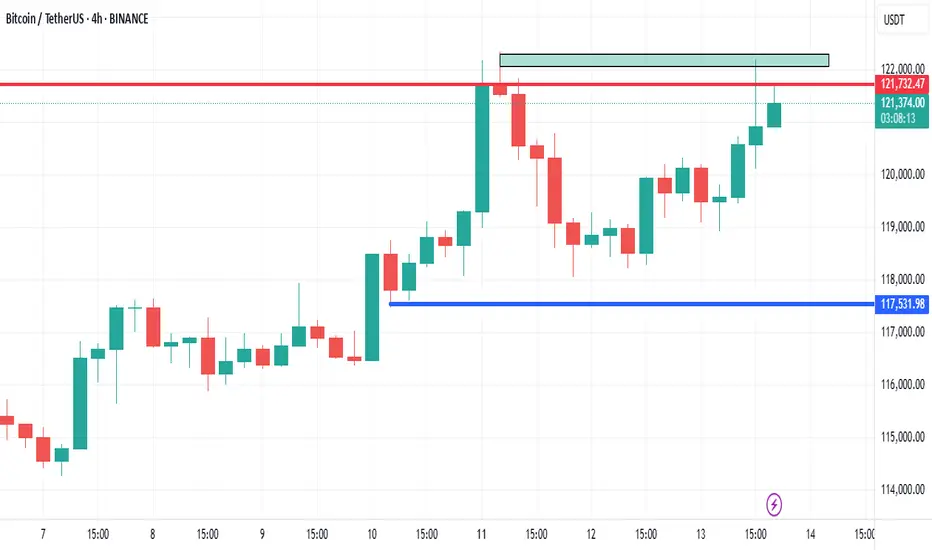
BTC with 121732 actionI have a feeling that if we can close above the resistance at 121732
with a 4-hour candle,
the price will break through the green rectangle like a spear."
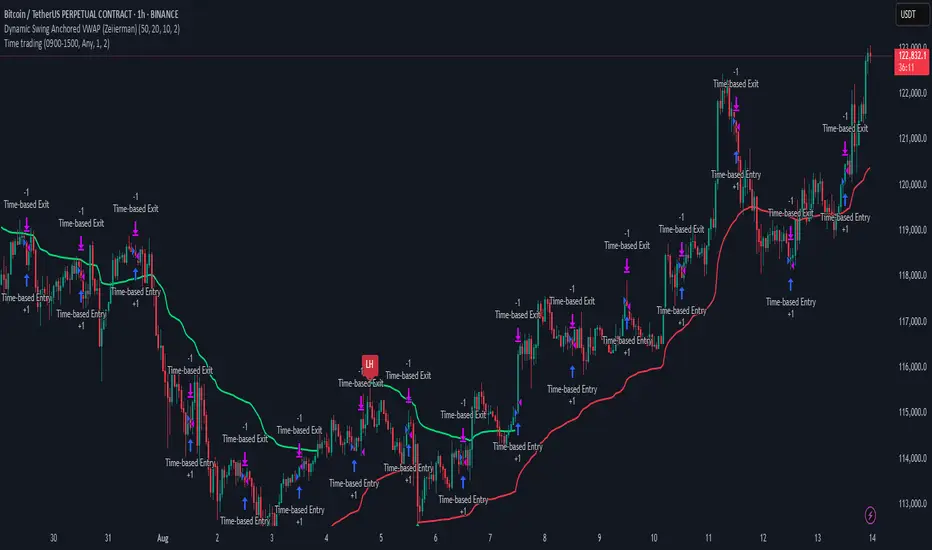
BTC/USDT Analysis — Turning Point
Hello everyone! This is the trader-analyst from CryptoRobotics with your daily market analysis.
Yesterday, Bitcoin tested the mirror resistance at $120,000, showing only a minimal reaction, and then retested $119,000 — the zone where we first saw signs of buying. From there, buying resumed with double the strength.
At the moment, we have tested the sell zone at $121,500–$122,300 (volume zone). Now it’s important to monitor the seller’s reaction, as well as how strongly buyers will re-enter the market. If buying momentum remains weak, the potential downside move could target the local low at $118,000.
Buy Zones:
$117,500–$116,000 (accumulated volumes)
$115,300–$114,000 (accumulated volumes)
Sell Zone:
$121,500–$122,300 (volume zone)
This publication is not financial advice.
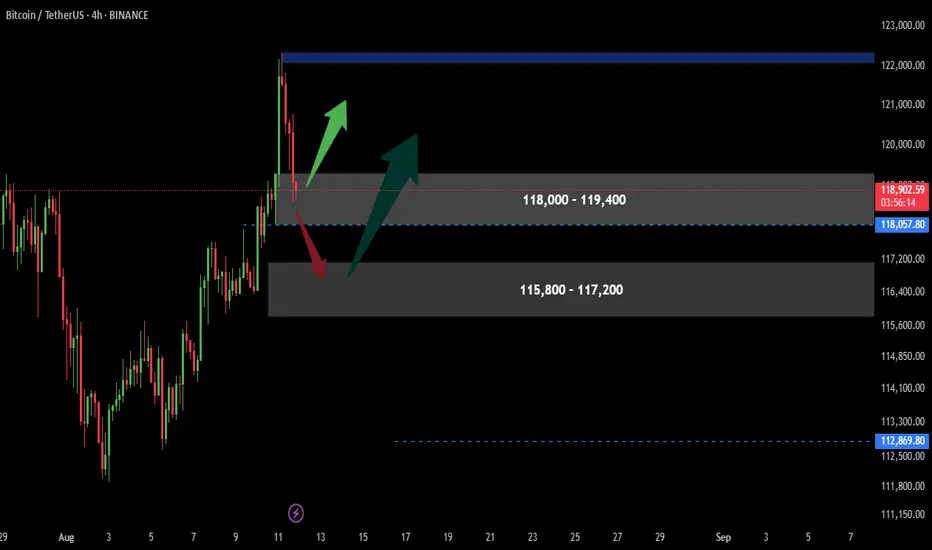
Bitcoin 2 Buy OffersThere are two possibilities for bitcoin .
First is (118,000 - 119,400) area which is in it right now.
If price breaks this zone next step would be (115,800 - 117,200).
The reason that I have little doubt about the first area is that price has been reached near it once and had a re act. So it has less chance for another rise.
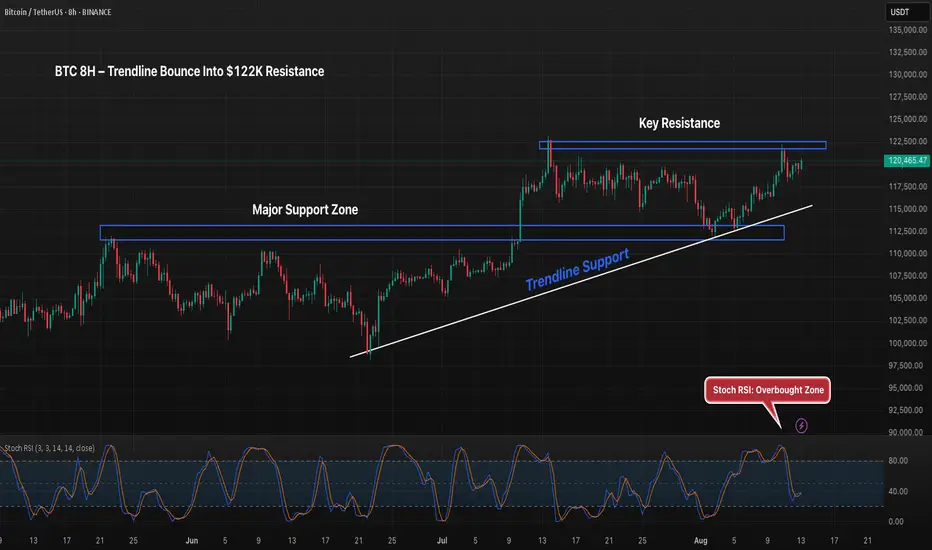
BTC 8H – Support Bounce Targets $122K, Will Bulls Break Through?Bitcoin has rebounded strongly from the $112K support zone, aligned with the ascending trendline from late June. Price is now approaching the $122K resistance area, which previously capped upside moves. The Stoch RSI is entering overbought territory, suggesting a potential pause or minor pullback before any breakout attempt. A confirmed close above $122K could open the door toward $125K–$127K, while losing $116K risks a return to the $112K support region.
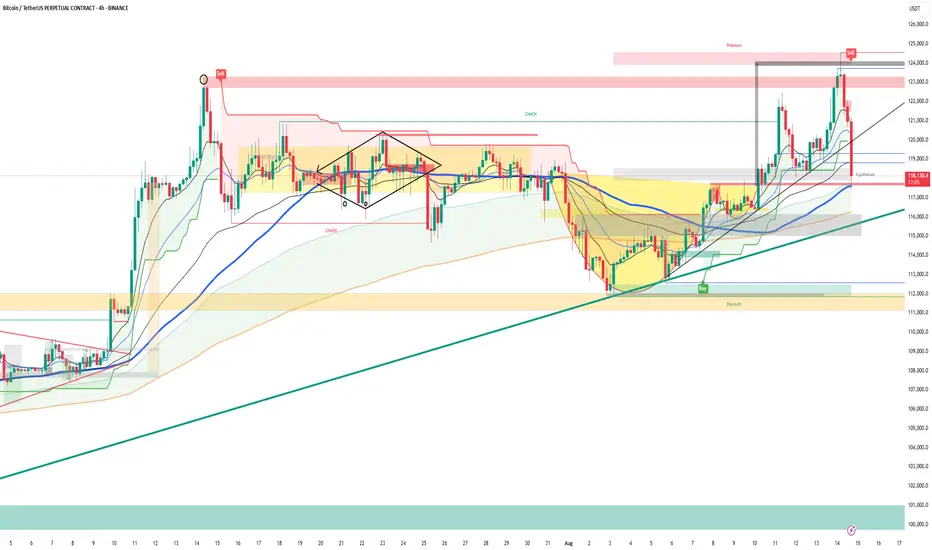
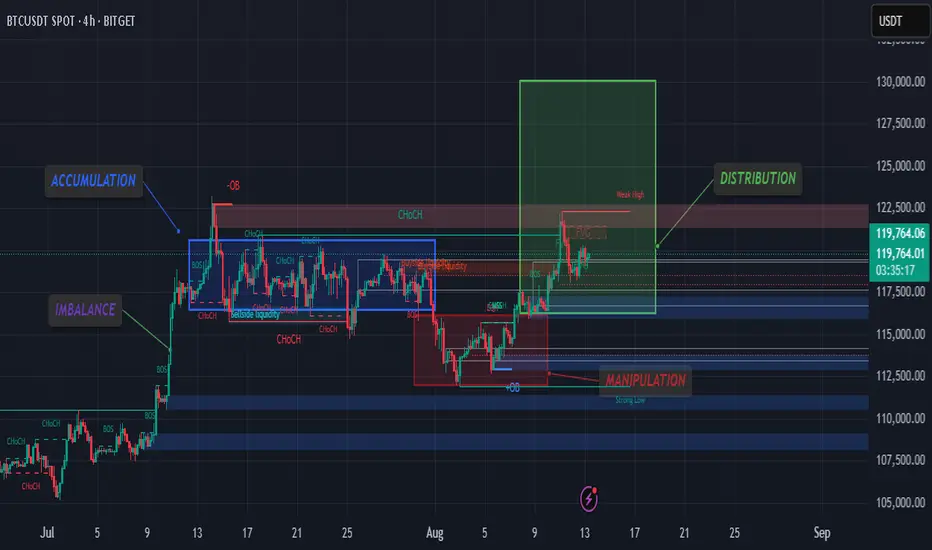
BTCUSDT -4H- AMD STRUCTURE
Accumulation (Blue Box): Market makers building long positions after sweeping prior liquidity. Price ranges sideways with multiple CHoCH (Change of Character) signals.
Manipulation (Red Box): Stop-hunt below the range (Strong Low taken) to trigger sell orders and fill big buy orders.
Distribution (Green Box): Price breaks structure to the upside, heading toward the weak high (liquidity target) before possible redistribution.
Imbalance (Blue Zone): Gaps left by aggressive buying; could be retested before continuation.
Current View:
Price is in the markup phase after manipulation, aiming for 122K–124K weak high liquidity. If filled, distribution could start, leading to a retrace toward 116K before the next leg up.
🎯 Short-Term Target: 122K–124K
🛡️ Invalidation: Below 114K
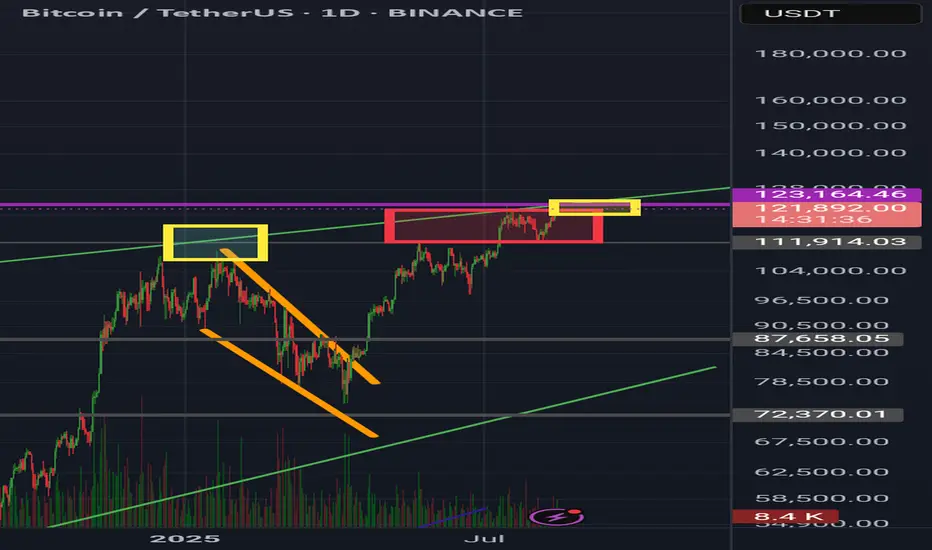
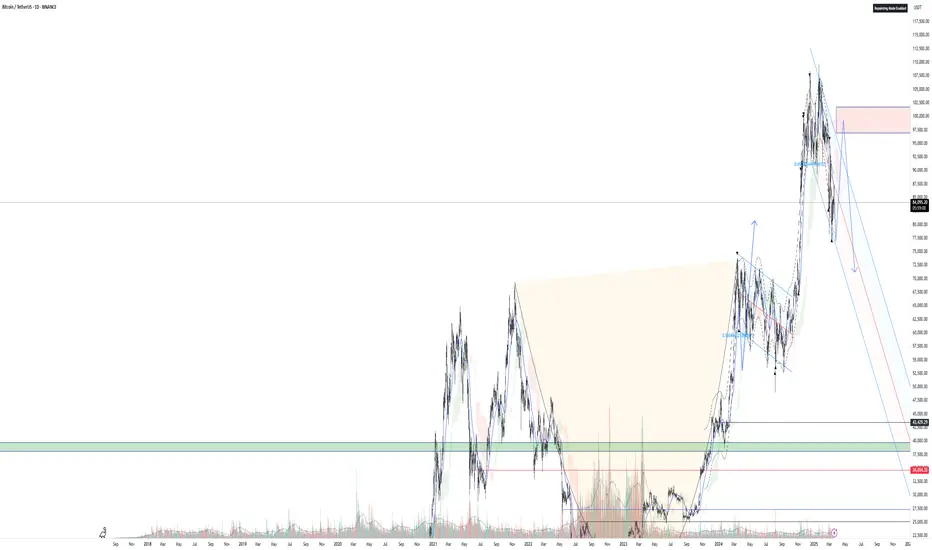
BTC at a Crossroads: Bull Trap or Moon Mission?A possible bearish scenario is playing out on BTC, but hey—just one of many possibilities before the real bloodbath begins. 👀 This could just be a classic trap to lure people in before shaking them out. The key resistance zone is between GETTEX:97K and $101K, a big range to clear. If we flip it and close above $102K on the weekly, that would be amazing—but let’s be real, we’ll need a strong catalyst for that. If we do, then we’re likely talking about the $120K range.
On the flip side, if we drop lower from here, the most obvious support sits at $72K. Below that… well, let’s just say we don’t wanna go there—next real support isn’t until $50K. For everyone’s sake, let’s hope we don’t see those levels. Big decision point ahead—let’s see who wins this battle! ⚔️🚀
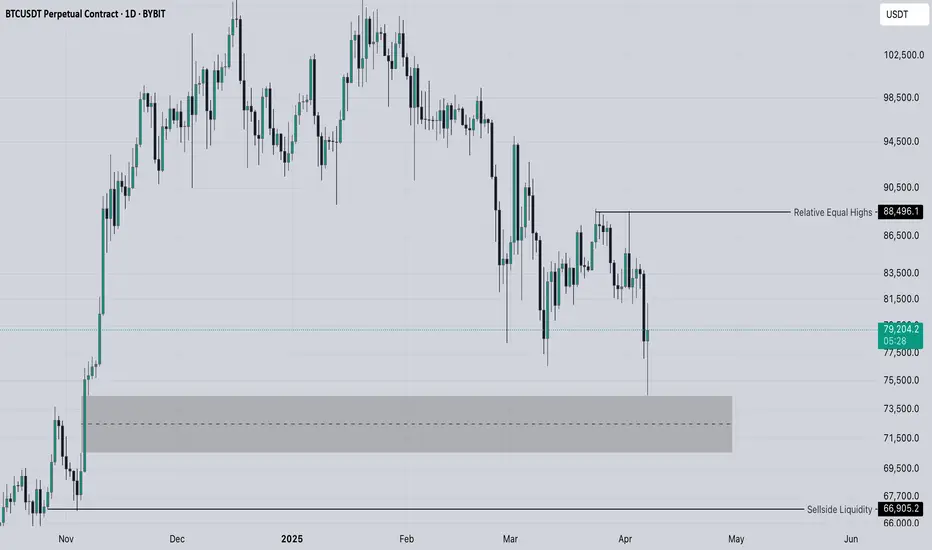
btc local 1DPotentially interesting zones we have touched, if we dont renew the current low I would favor the bullish scenario on 1D timeframe to try and reach for the relative equal highs within the distribution range we have as long as we only wick through the marked imbalance. Probably retest of 50% of the daily 1D candle tail in the area of 76.5k or test of C.E. of the highlighted BISI and then some kind of bounceback to reach out for buyside is the scenario I favor
Bitcoin’s Coiled Spring — Direction Unknown
Today’s CPI Will Decide Which Way Bitcoin’s Coiled Spring Will Launch .
Just a Slightly Lower CPI Than Expected Could Be Enough to Unleash Bitcoin’s Coiled Spring, Sending It Exploding Upwards .
If CPI Comes in as Expected, the Market Is Unlikely to Show Any Surprises and Will Probably Repeat Its Usual Pattern . However , We Shouldn’t Expect an Early and Clean Break of the $123,000 Resistance Level .
If Inflation Prints Higher Than Expected, We May Need to Shift Our Medium-Term Outlook, as the Multi-Month Bull Run Could Come to a Halt
Suggestion: Given the Drop in Bitcoin Dominance Alongside Its Price Increase, If Any Altcoin Fits Your Strategy for Entry, Consider Opening a Position With a Proper Stop Before the CPI Announcement.
Disclaimer: The information provided reflects my personal analysis and opinion only. It should not be considered financial advice. Always conduct your own research before making any investment decisions.
#Bitcoin #BTC #Crypto #Altcoins #CPI #Inflation #Trading #MarketAnalysis #PriceAction #TechnicalAnalysis #BullRun #Resistance #Breakout #CryptoNews #Investing