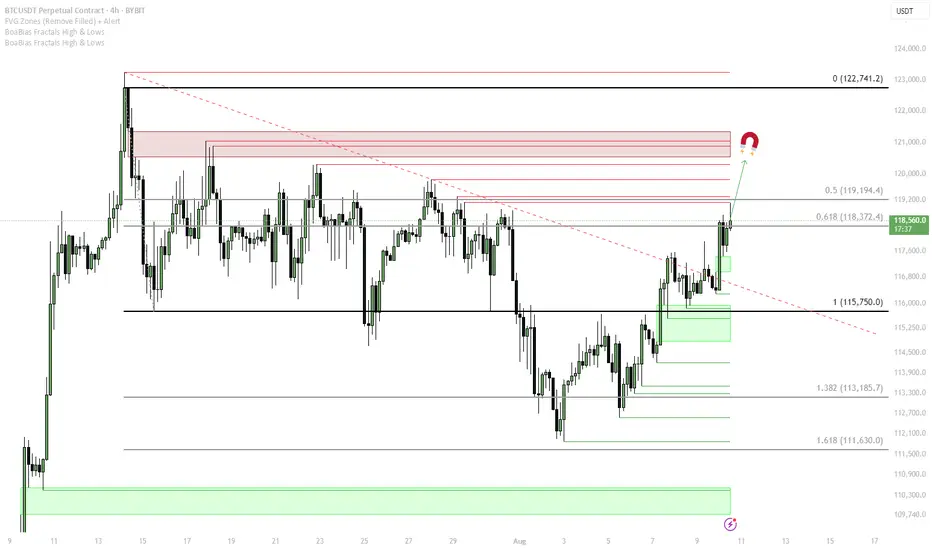
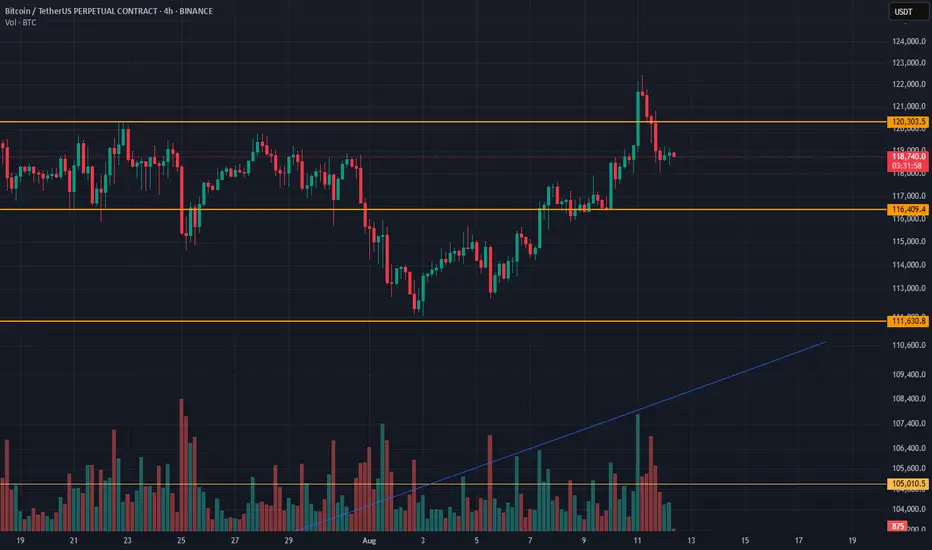
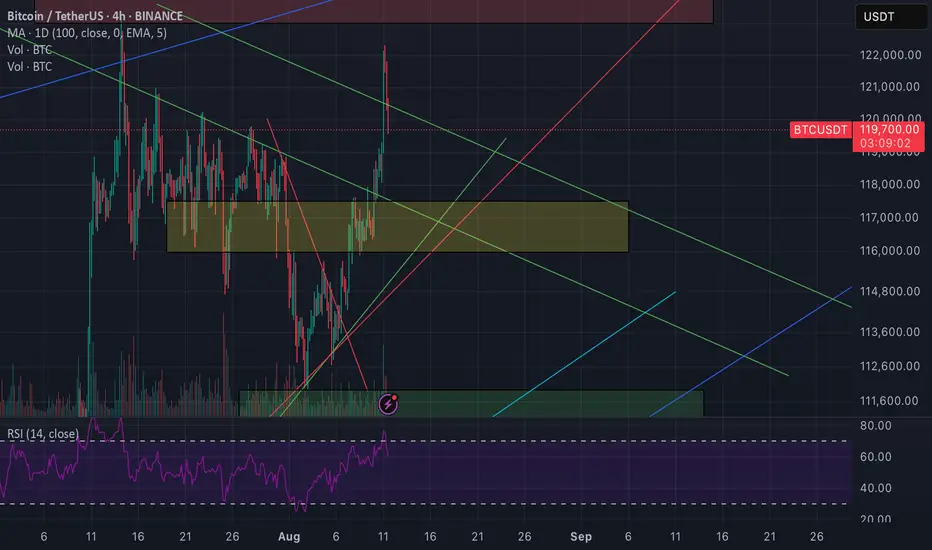
BTC Broke the downtrendCRYPTOCAP:BTC has broken a descending trendline and is pushing toward the mid-range resistance at 119,500. Above that sits a liquidity pocket at 121,000, with the range high at 123,250.
Momentum signals on higher timeframes remain bullish, with accumulation patterns in place, but lower timeframes show bearish RSI divergences, suggesting the potential for a pullback before continuation.
Bullish scenario:
Hold above 117,000 – 117,454 (4H Bull FVG) keeps bullish momentum intact.
Break and close above 119,500 sets up a liquidity sweep at 121,000.
If momentum sustains, an extension toward 123,250 (Range High) becomes possible.
Bearish / Invalidation scenario:
Rejection from 119,500 followed by a break below 117,000 could pull price back toward 115,750 (Range Low).
Loss of 115,750 exposes deeper retrace into 1W Bull FVG 110,655 – 115,900.
Trading plan:
Watch for breakout + retest of 119,500 to target 121k.
Take partial profits into 121,000; leave runner toward 123,250.
Protect downside if price loses 117,000.
USDTBTC trade ideas
$BTChold this lots support below
NY should be fun with dominace breaking 60.55% close 2 candles on the h4 below it
bitty back at vwap
lets see what we get long here imo
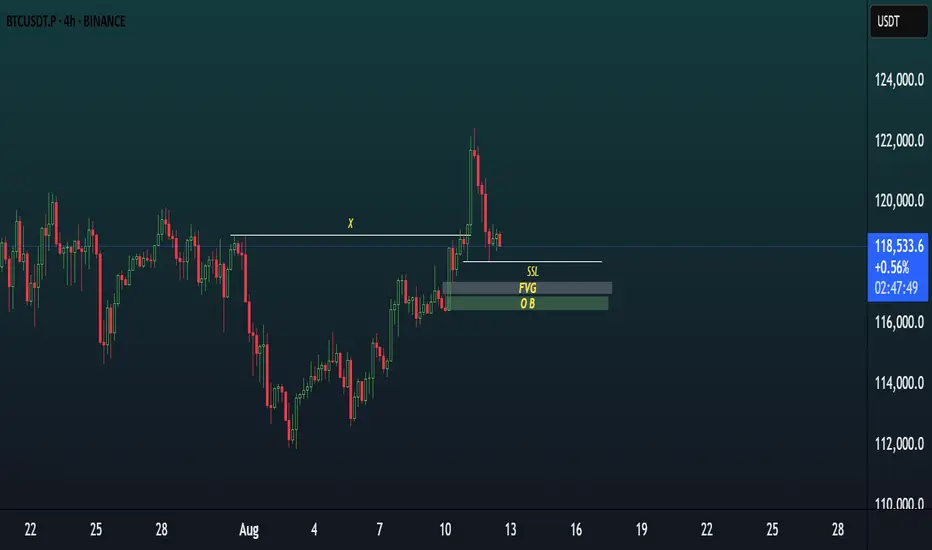
BTCUSDT 4H BULLISH SETUP.BTCUSDT | 4H Bullish Setup
✅ Price broke above key structure and formed a clean FVG + Bullish Order Block below current price.
✅ SSL liquidity resting just above the demand zone.
🔍 Price is pulling back; possible mitigation expected in 117,000 – 116,500 zone.
📌 Trade Idea: Wait for price to tap into demand zone & confirm bullish signals before entry.
🎯 Potential continuation to the upside after liquidity sweep.
Today we have cpi news so be patient and look for opportunity HI everyone
I hope u all be well and sharp
Today we have CPI news and if its in favor of Risky markets we will all be having good days ahead so prepare and be ready i suggest to enter ur positions before the news come out.
i,m only focusing on Long and don't even think on Short its my strategy so i,m waiting for USDT.D and BTC.D to confirm my entrance.
I look for Alt coins which are strong against Bitcoin.
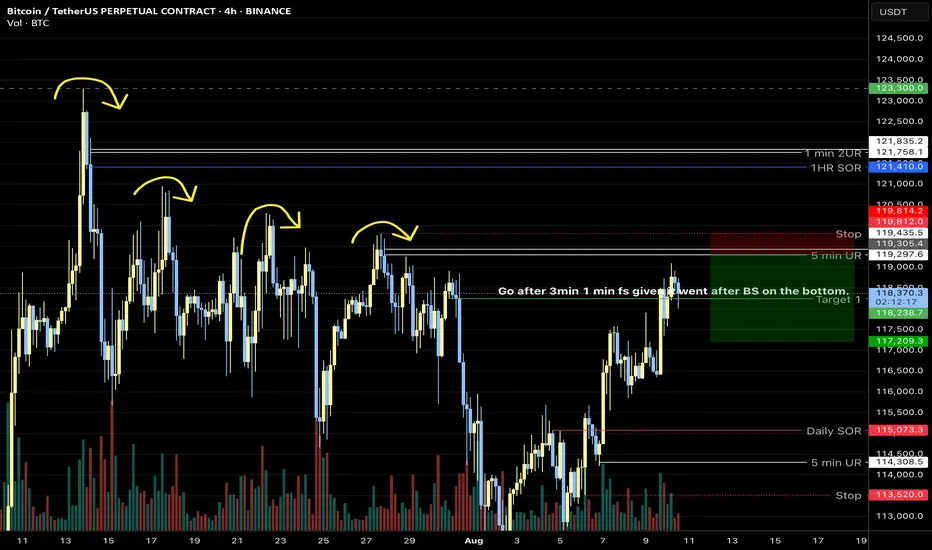
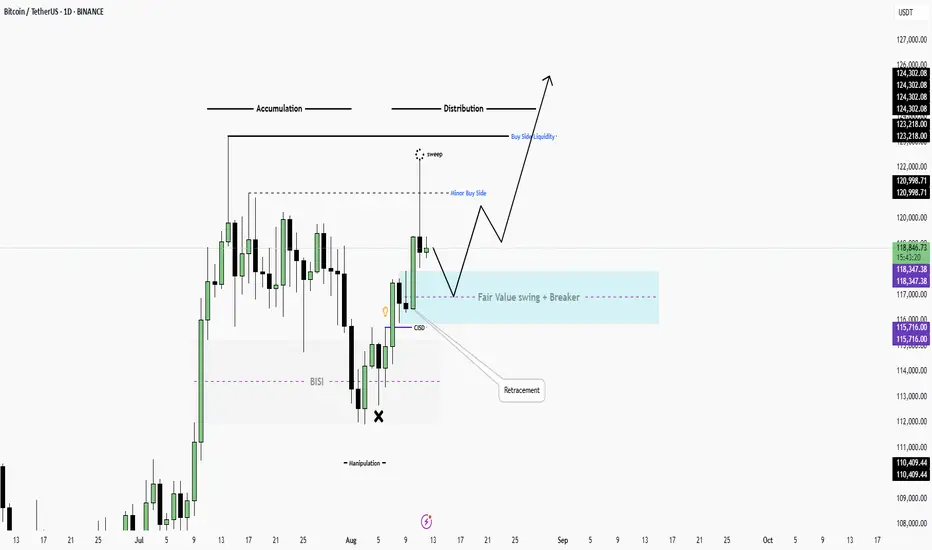
ICT BTC (2025\8\12)Accumulation Phase – Price consolidates, building liquidity on both sides.
Manipulation (Sweep) – A buy-side liquidity grab occurs, clearing stops above prior highs (Minor Buy Side sweep).
Retracement to Fair Value Gap + Breaker – After the sweep, price is expected to retrace into a confluence zone:
Fair Value Gap (FVG) from previous bullish swing
Breaker block formed from a prior failed high
Distribution to Expansion – After the retracement, bullish continuation toward major buy-side liquidity above 123K–126K.
Key Levels:
FVG + Breaker Zone: ~115,716 – 118,347
Buy-side liquidity targets: 120,998 → 123,218 → 124,302 → 126,000
Bias: Bullish after retracement — targeting liquidity above prior highs.
Notes:
This setup relies on the idea that market makers engineer liquidity grabs before delivering price to higher targets.
Confirmation can come from lower-timeframe structure shifts inside the breaker zone.
BTC ~ are you very bullish?BTC looks so dead, ideal buys goes to the range, means any good buys to hold, else its same you will get trapped anyways
possible BTC longBeen a minute since I posted, but this is the potential trade. I’m looking at at target equal high after the sweep of the Asia low. We’ll see what happens in these next few hours.
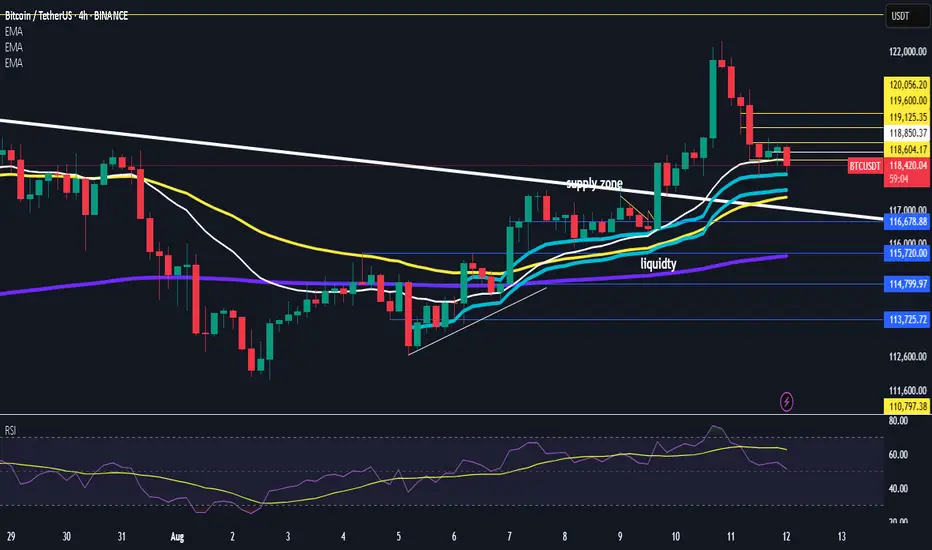
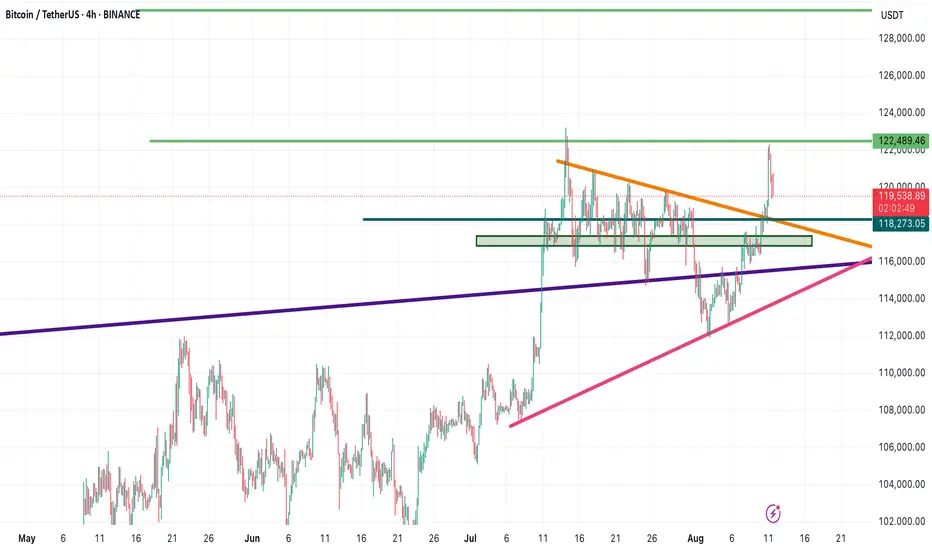
Bitcoin (BTCUSDT) Technical Analysis – August 11, 2025📊 Bitcoin (BTCUSDT) Technical Analysis – August 11, 2025
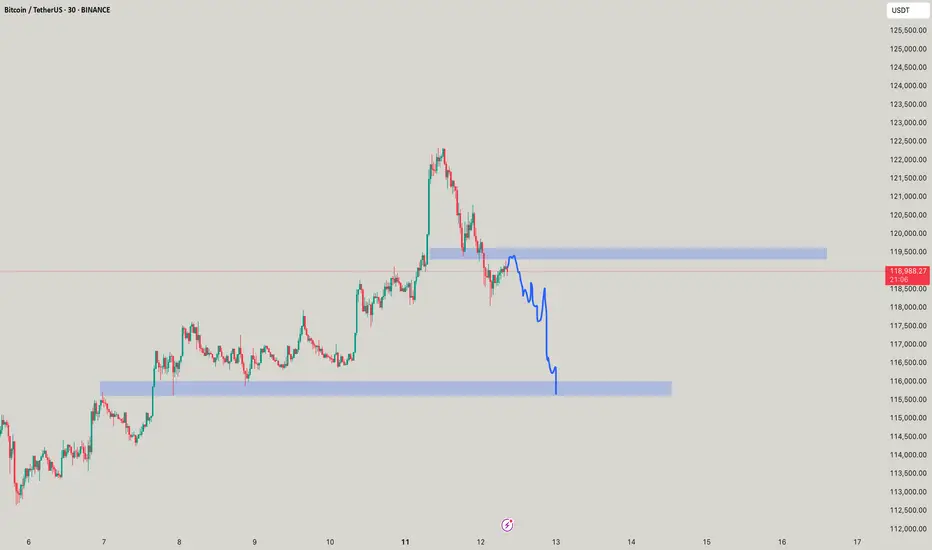
🔹 After breaking the downtrend line, Bitcoin rallied to the key resistance zone at $122,000 before starting a pullback.
📉 Bearish Scenario:
First support: $118,273 (confluence with the broken trendline)
Second support: $117,000
📈 Bullish Scenario:
If BTC bounces from these supports, the first target is $122,000
A strong breakout above this level opens the way to the next target at $129,000
⚠️ Note: Always wait for strong candlestick confirmation before entering any position.
#BitcoinAnalysis #BTCUSDT #Crypto #Bitcoin #TechnicalAnalysis #Cryptocurrency #Trading #PriceAction #CryptoTrading #BTC
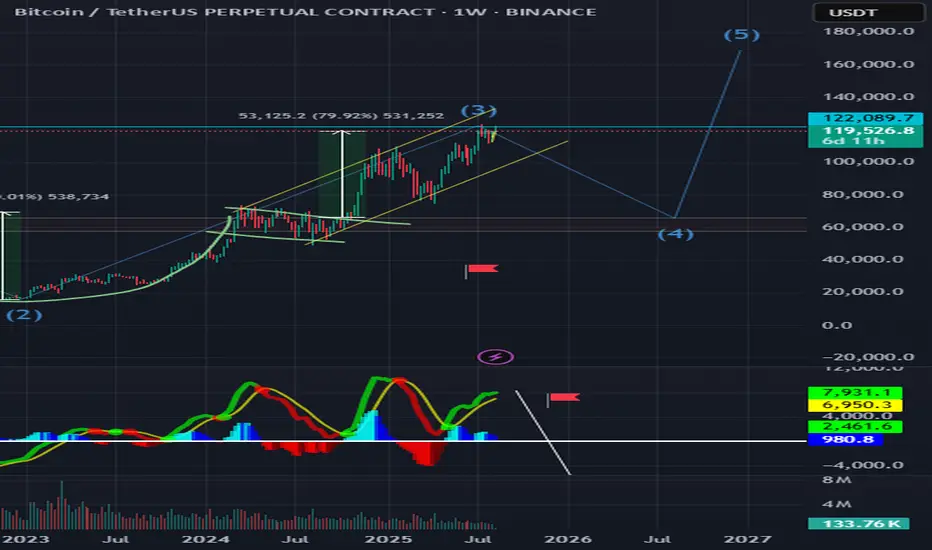
BTC - Cup & Handle Completed, Wave 4 is Coming...The long-term cup & handle pattern has played out, completing wave (3) around the $122K zone. According to Elliott Wave structure, BTC is now likely to enter wave (4), which could mean a deeper correction toward the $60K–$70K range before the final wave (5) push.
Wave 5 could target new all-time highs later, but for now, caution is key — this phase may shake out weak hands before the next rally.
Key Points:
Cup & handle breakout already done.
Wave 3 peak in place.
Wave 4 correction expected before Wave 5 to ATH.
Not financial advice.
BTC is bullish but correcting itself to balance the risk/rewardWe see here the chart, i dont recommed to short btc, but still i think we can expect a short down swing where we could buy some spot positions or call options to sizen up our position.
My data and chartbased analytics about this week:
110-112k - lower support
115-118k - medium support
I'm not lookout for new ATH this month such as 124-126k but its possible. I do look more for longterm ATH in oct. / nov. 2025 by around 145-180k
Feel free to share your opinion in the comments below!
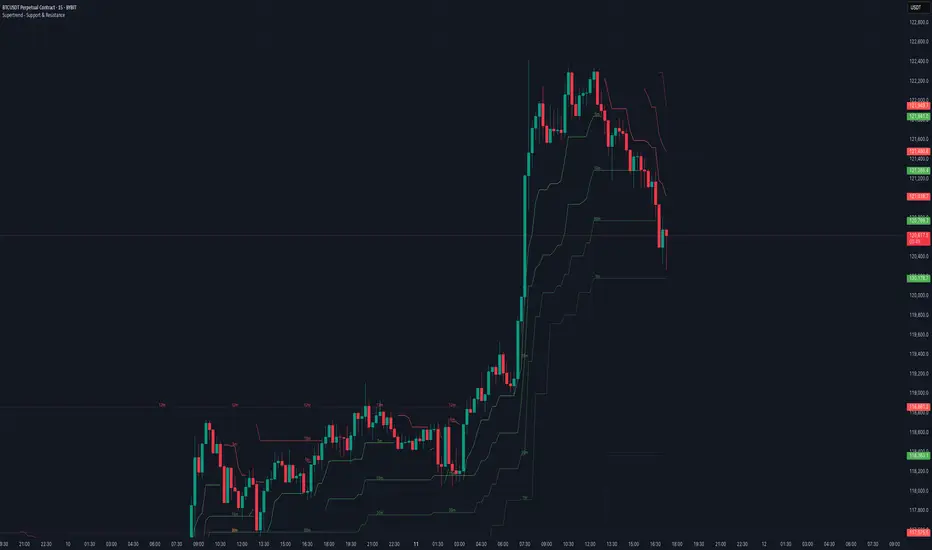
Supertrend – Multi-Timeframe Support & ResistanceSupertrend – Multi-Timeframe Support & Resistance
This script overlays multiple Supertrend bands from higher timeframes on a single chart and treats them as dynamic support and resistance. The goal is simple: see the bigger picture without leaving your current timeframe.
What it does
• Calculates Supertrend using the same ATR Length and Factor across 5m, 15m, 30m, 1h, 4h, 8h, 12h, and 1D.
• Pulls each timeframe via request.security(..., lookahead_off) so values only update on candle close. No look-ahead, no “teleporting” lines.
• Plots each timeframe’s Supertrend as an on-chart band with increasing transparency the higher you go, so you can visually separate short-term vs higher-timeframe structure.
• Colors indicate direction:
• Green = bearish band above price (acting as resistance)
• Red = bullish band below price (acting as support)
• Drops compact labels (5m, 15m, 30m, etc.) every 20 bars right on the corresponding Supertrend level, so you can quickly identify which line belongs to which timeframe.
Why this helps
Supertrend is great for trend definition and trailing stops. But one timeframe alone can whipsaw you. By stacking multiple timeframes:
• Confluence stands out. When several higher-TF bands cluster, price often reacts.
• You see where intraday pullbacks are likely to pause (lower TF bands) and where trend reversals are more meaningful (higher TF bands).
• It’s easier to align entries with the dominant trend while still timing them on your working timeframe.
How it works (quick refresher)
Supertrend uses ATR to offset a median price with a multiplier (Factor). When price crosses the band, direction flips and the trailing line switches sides. This script exposes:
• ATR Length (default 10): sensitivity of the ATR. Smaller = tighter band, more flips. Larger = smoother, fewer flips.
• Factor (default 3.0): multiplier applied to ATR. Larger = wider band, more conservative.
The same settings are used for all timeframes for clean, apples-to-apples comparisons.
How to use it
• Trend alignment: Prefer longs when most higher-TF lines are below price (red support). Prefer shorts when most are above price (green resistance).
• Pullback entries: In an uptrend, look for pullbacks into a lower-TF red band that lines up near a higher-TF red band. That overlap is your “zone.”
• Breakout confirmation: A strong break and close beyond a higher-TF band carries more weight than a lower-TF poke.
• Stops and targets: Use the nearest opposing band as a logic point. For example, in a long, if price loses the lower-TF red band and the next higher-TF band is close overhead, trim or tighten.
Signals you can read at a glance
• Stacking: Multiple red bands beneath price = strong bullish structure. Multiple green bands above price = strong bearish structure.
• Compression: Bands from different TFs squeezing together often precede expansion.
• Flip zones: When a higher-TF band flips side, treat that level as newly minted support/resistance.
Design choices in the code
• lookahead_off on all request.security calls avoids repainting from future data.
• Increasing transparency as the timeframe rises makes lower-TF context visible without drowning the chart.
• Labels every 20 bars keep the chart readable while still giving you frequent anchors.
Good to know (limits and tips)
• This is an overlay of closed-bar Supertrend values from higher TFs. Intrabar moves can still exceed a band before close; final signal prints at candle close of that timeframe.
• Using the same ATR/factor across TFs makes confluence easier to judge. If you need independent tuning per TF, you can clone the security calls and add separate inputs.
• On very low timeframes with many symbols, multiple request.security calls can be heavy. If performance drops, hide one or two higher TFs or increase the label spacing.
Risk note
This is a context tool, not an auto-trader. Combine it with structure (HH/HL vs LH/LL), volume, and your execution rules. Always test on your market and timeframe before committing real capital.
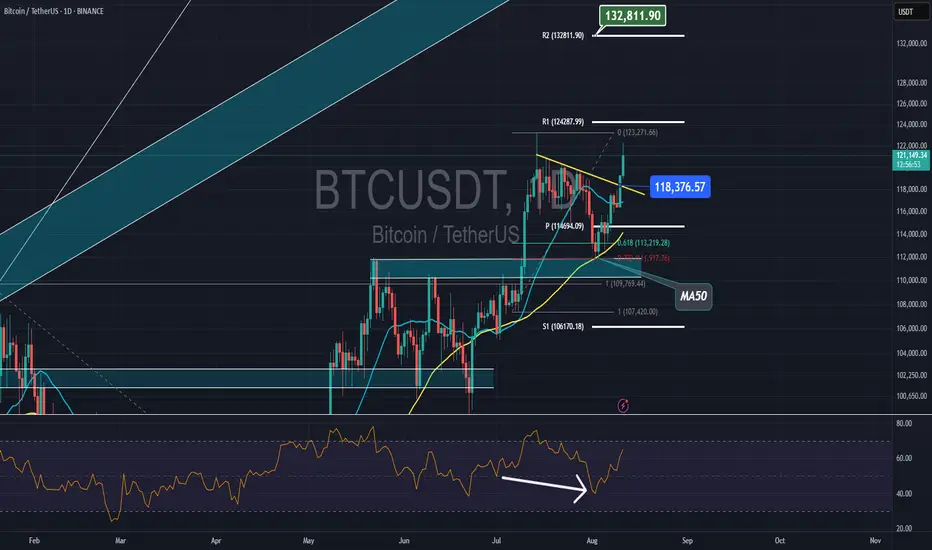
Bitcoin & $132,800Bitcoin broke above the resistance at $118,300 and, with no further resistance, is approaching the 2nd resistance of August's pivot at $132,800.
Analytics: market outlook and forecasts
📈 WHAT HAPPENED?
At the beginning of last week, Bitcoin reached the resistance level of $115,000-$116,300 (a mirror volume zone) and experienced a quick correction. However, at this level, there was a strong absorption of sales, as the volumes clearly indicated active buys, and by Wednesday, the focus shifted towards long positions.
The only surprise was a slight stop in the $117,600-$118,600 zone (accumulated volumes). In general, we passed it with almost no resistance, which is a sign of buyer strength.
An additional catalyst for growth was President Donald Trump's executive order on August 7, which allows Americans to invest in cryptocurrency through their retirement accounts. This decision could pave the way for a multibillion-dollar influx of new funds into the cryptocurrency market.
💼 WHAT WILL HAPPEN: OR NOT?
Now we’re almost close to the ATH, but at the moment there is a small resistance in the range of $121,500-$122,300. It’s not yet clear in which direction the volume will move, but in case of a breakout of the ATH, this zone can become the nearest support in the case of a correction.
If sells are activated at the current levels, it’s worth paying attention to the level of ~$120,000 (pushing volumes). In this case, a local sideways movement is possible between the level of ~$120,000 and the zone of $122,300-$121,500.
Buy Zones:
~$120,000 (pushing volumes)
$117,500–$116,000 (accumulated volumes)
$115,300–$114,000 (accumulated volumes)
📰 IMPORTANT DATES
On macroeconomic events this week:
• August 12, Tuesday, 12:30 (UTC) - publication of the basic consumer price index (CPI) of the United States for July, as well as in comparison with July 2024;
• August 13, Wednesday, 6:00 (UTC) - publication of the consumer price index (CPI) of Germany for July;
• August 14, Thursday, 6:00 (UTC) — publication of the UK's GDP for the second quarter and for June;
• August 14, Thursday, 12:30 (UTC) — publication of the number of initial unemployment claims and the US producer price index (PPI) for July;
• August 14, Thursday, 23:50 (UTC) — publication of Japan's GDP for the second quarter;
• August 15, Friday, 12:30 (UTC) — publication of the volume and base index of US retail sales for July.
*This post is not a financial recommendation. Make decisions based on your own experience.
#analytics
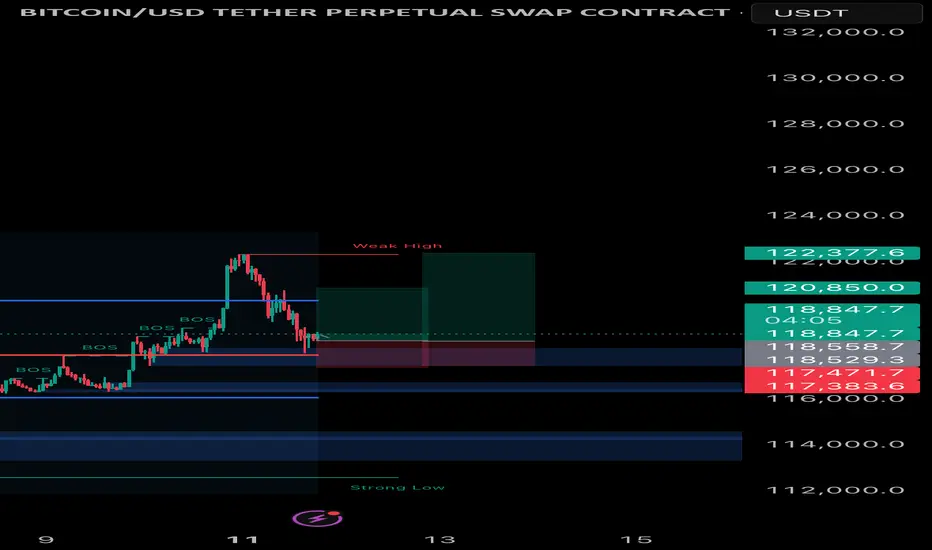
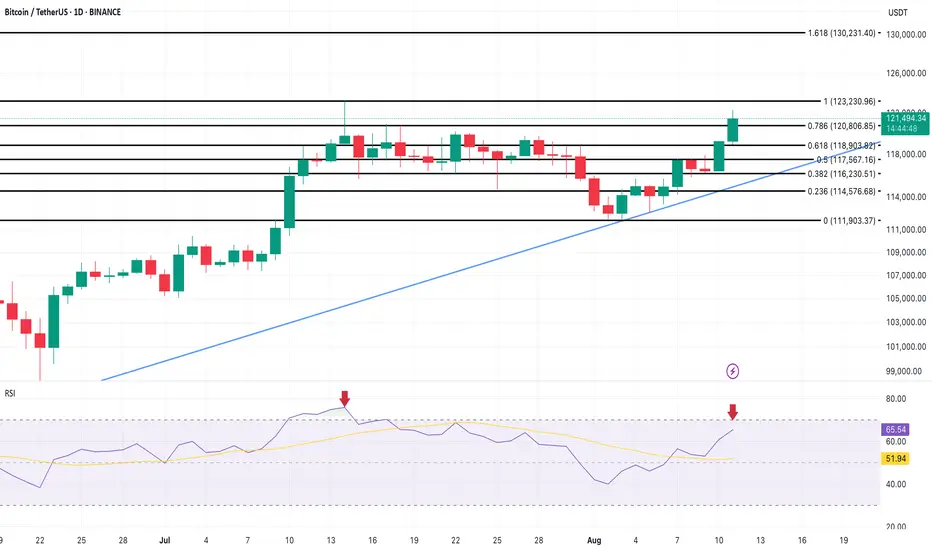
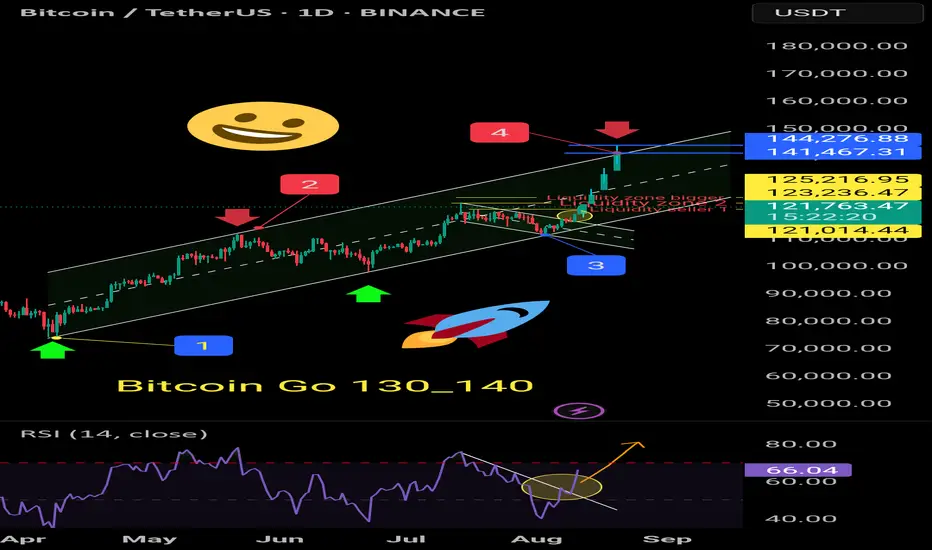
Bitcoin Price Near ATH, More Upside LikelyBINANCE:BTCUSDT is still trading inside its ascending channel on the daily chart, pressing against the $123,230 Fibonacci 1.0 extension: the same level that capped the July 14 rally. This zone remains the immediate breakout target, with $130,200 as the next upside marker if bulls clear it with strong volume.
Key supports to watch are $120,806 (Fib 0.786) and $118,903 (Fib 0.618). Holding above these levels keeps the BINANCE:BTCUSDT bullish structure intact; a close below could stall momentum.
The RSI sits near 66, well below July’s overbought 75+, suggesting there’s still room for upside before technical exhaustion kicks in. Supporting metrics like SOPR at 1.00 (versus overheated 1.03–1.05 in July) and Taker Buy/Sell Ratio at 1.14 confirm that profit-taking is limited and spot buying remains strong.
Overall, if $123,200 gives way, Bitcoin could see a faster, stronger push to new all-time highs than its last attempt. And for BINANCE:BTCUSDT , $123,200 would first mean that a new all-time high is in.
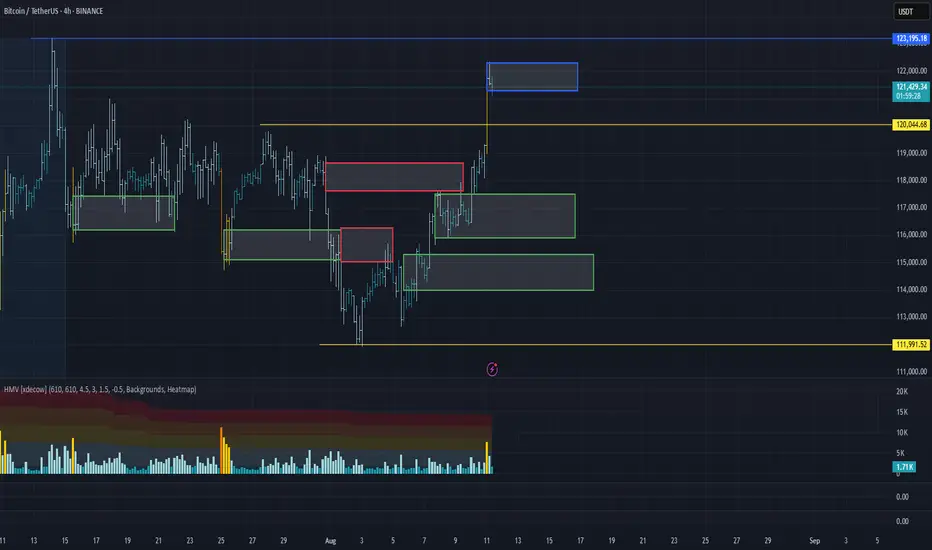
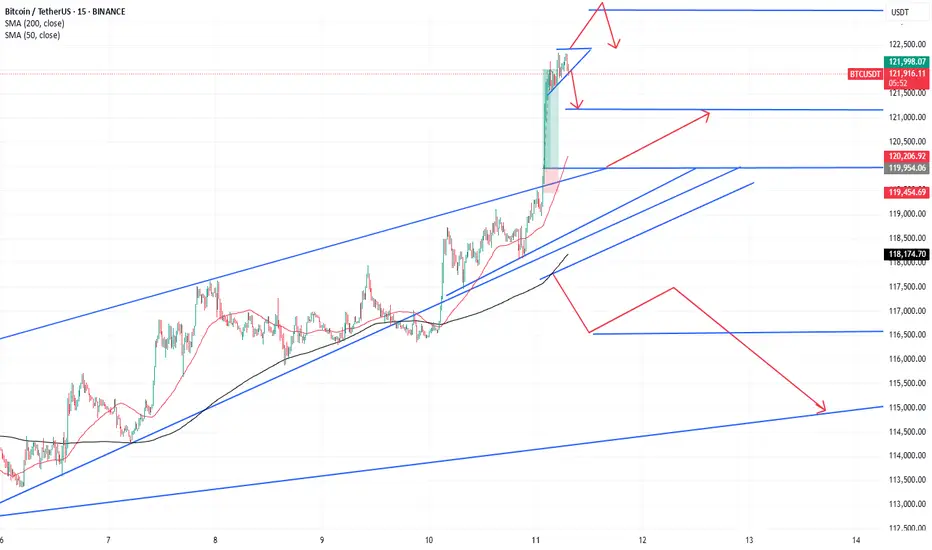
Bitcoin 4H Imbalance to Hold PriceConfirmation: 4H imbalance to hold and push price high
Opportunity: When I get a sharp turn on 15min I will execute my entry.
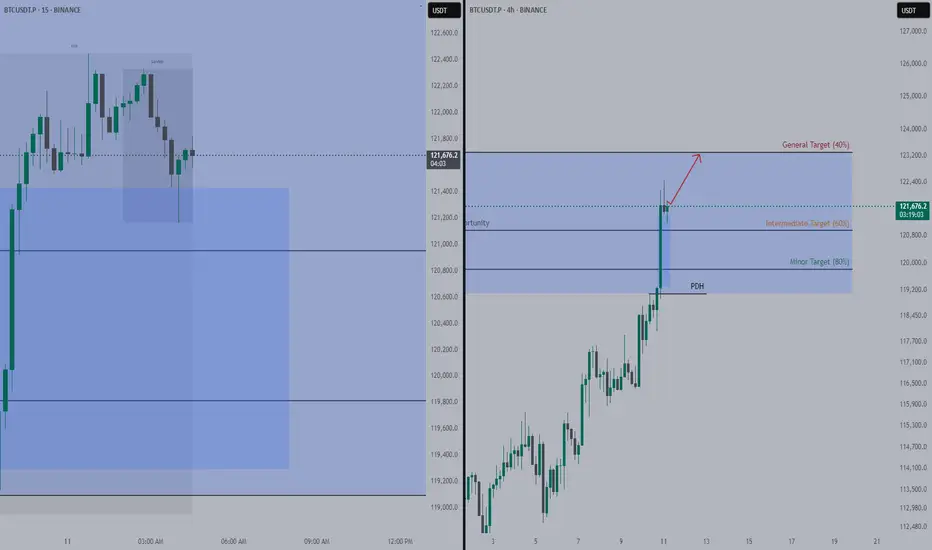
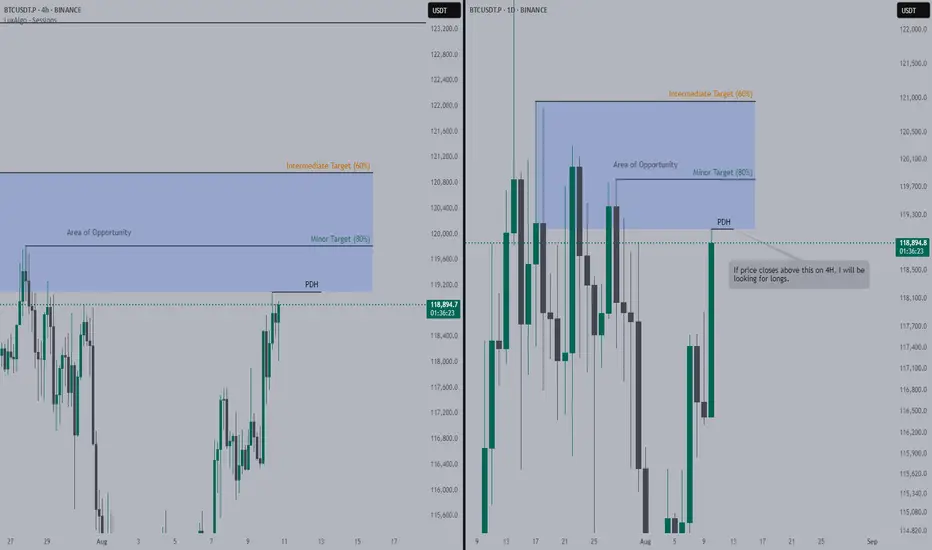
Bitcoin is Pumping, Looking to Fly with itConfirmation: Price closes above PDH (Previous Day High).
Opportunity: Price trades within Area of Opportunity (AoO), we will be looking for longs.
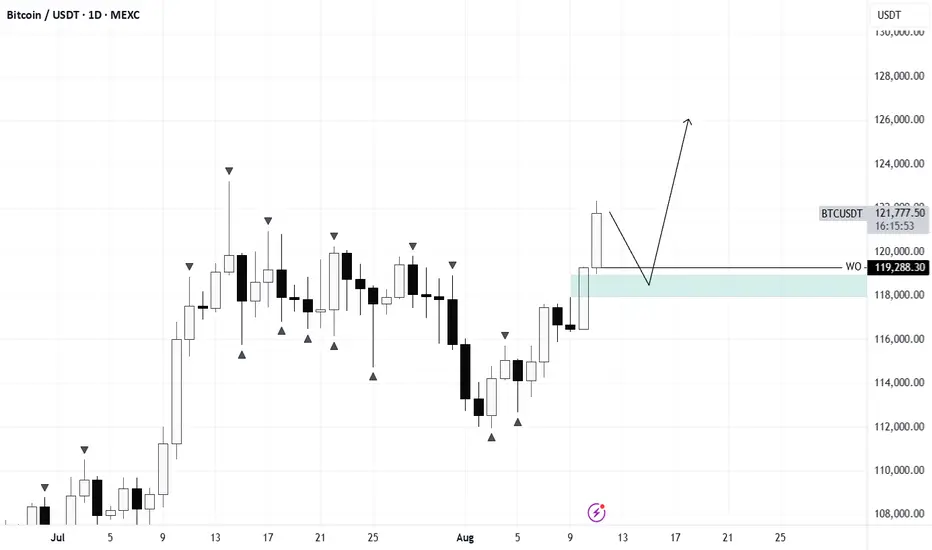
BTC/USDTFor continued upside, a pullback toward the weekly open would be healthy.
A move below the $114K–$115K zone could open the door for a deeper correction.
Current upside target sits at $130K.
BTC - Irrational Exuberance or breakout continuation Consolidation occurring in the shape of a rising wedge, a traditionally bearish pattern, as traders assess the recent series of volume assisted breakouts.
A natural tendency is to test support before breaking out a third time so be prepared for some pullbacks to previous pivot high support levels.
BTC Breaks 116k!We did break the 116k level. But it is not clear yet whether the breakout is bullish or not.
Plotted range extremes let's see
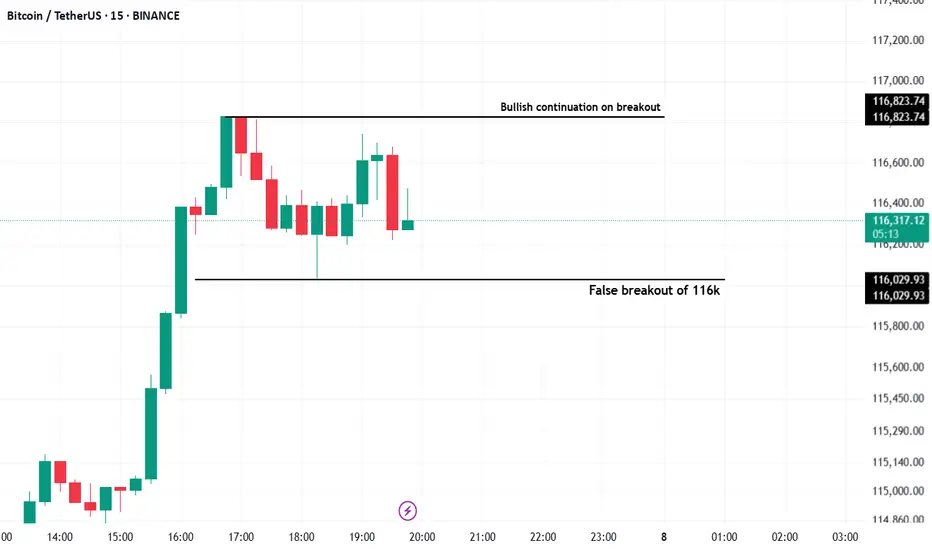
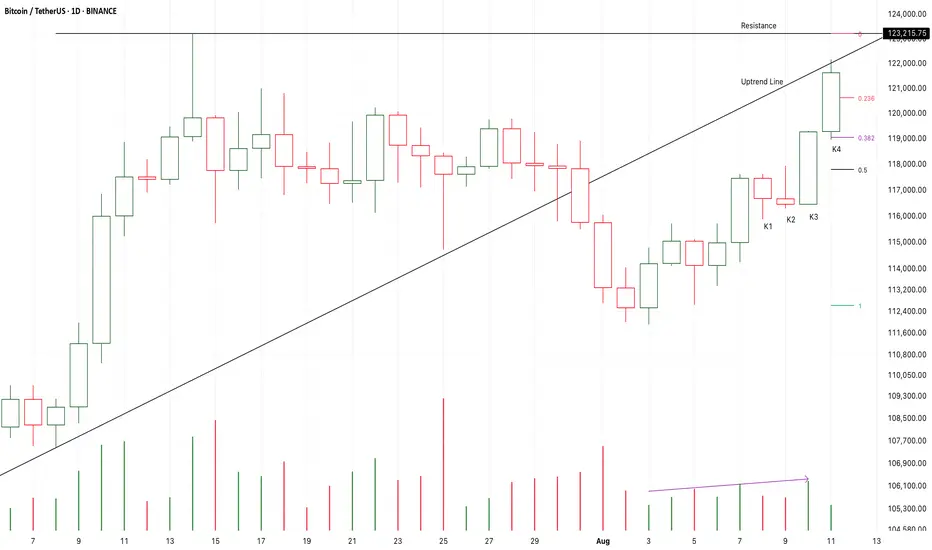
Chart Pattern Analysis Of Bitcoin.
K3 and K4 verified an accelerating motive wave of a short-term uptrend.
I am leaving from 119K to 123K.
I am expecting a consolidation around the resistance.
If the following candles fall to test 0.5fib area,
I will try to buy it there.
Long-118K/Target-125K/Stop-116.5K
BTC Overall: Grinding higherBTC continues to grind higher, however, another (at least smaller) corrective phase should occur soon. We may hit the important supports below after all or we may hold the local low. After this process completes we should see new ATH. Corrective phases are difficult to predict unfortunately!
4RR (short)This is a risky trade, it is based on a continuation of the previous laddering down. We are approaching the Real leg of the move. If there’s going to be a reversal, it should happen quite soon. It has a good risk reward, so only take it for a small amount risk. Theoretically price should move below the indicated take profit as well in three waves..