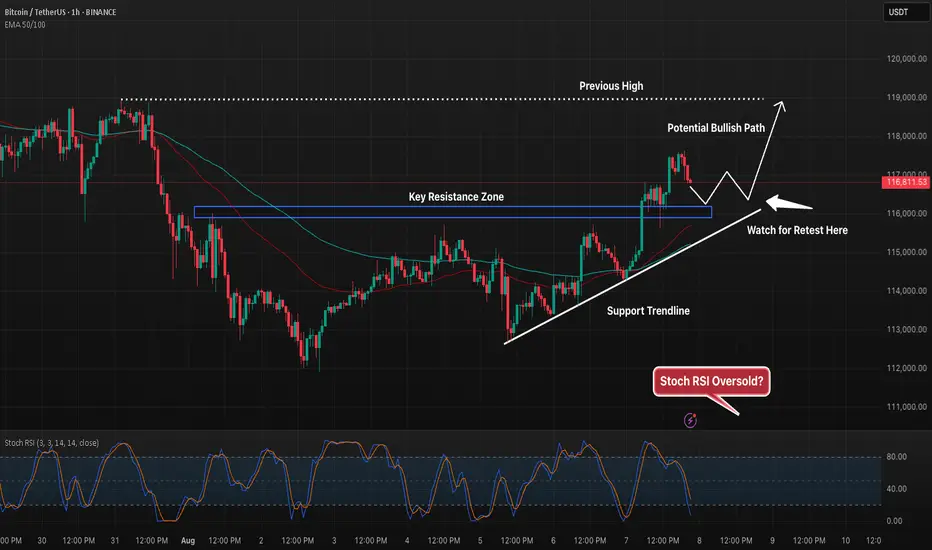
BTC 1H – Ascending Support Holding, Will Retest Launch Bulls?Bitcoin continues to respect its ascending trendline while pushing against the 116.8k–117k resistance zone. Price recently pulled back after a local high, setting up a potential retest of the prior breakout level near the blue support box.
A successful hold here could fuel another leg up toward the 119k target, while failure to hold may bring the trendline into play. Stoch RSI is approaching oversold territory, hinting at possible bullish momentum if buyers step in.
This setup offers a clean structure:
– Clear ascending support
– Defined resistance zone to break
– Stoch RSI nearing reset for potential upside
Traders will be watching the retest area closely for confirmation before committing to the next move.
USDTBTC trade ideas
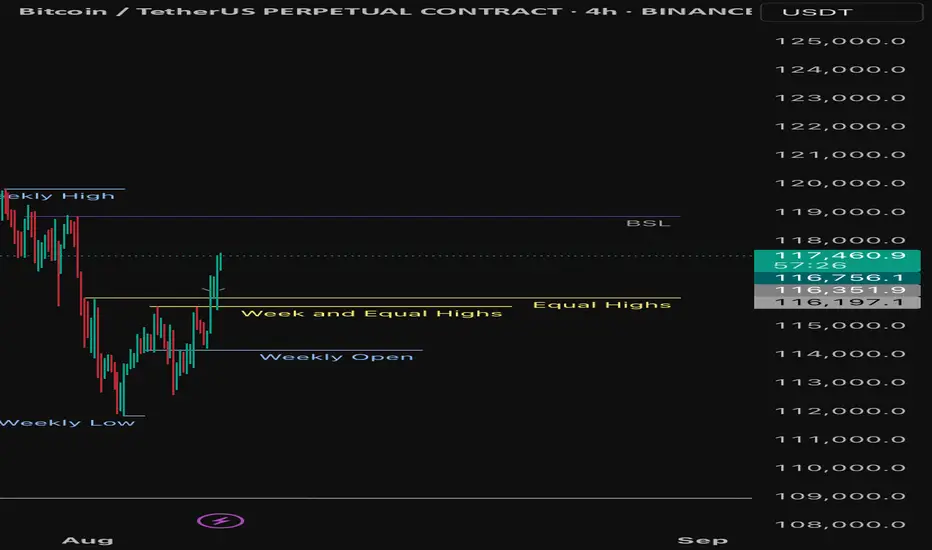
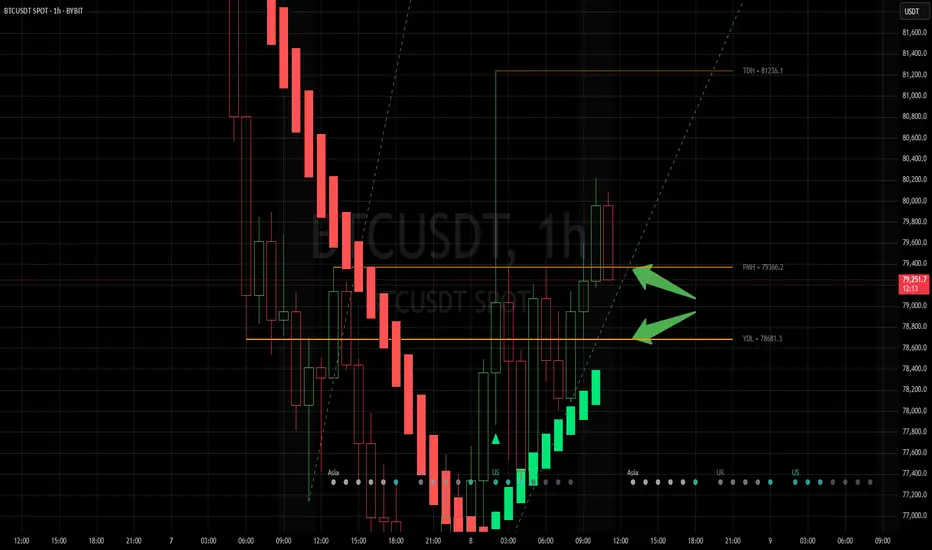
8 Aug — BTCUSDT.PI usually (haha) trade on the basis of what is market doing right now and what is it likely to do next. Right now it looks like reaching for at least the BSL marked. In any case, as traders, we are trading probabilities, so let’s see.
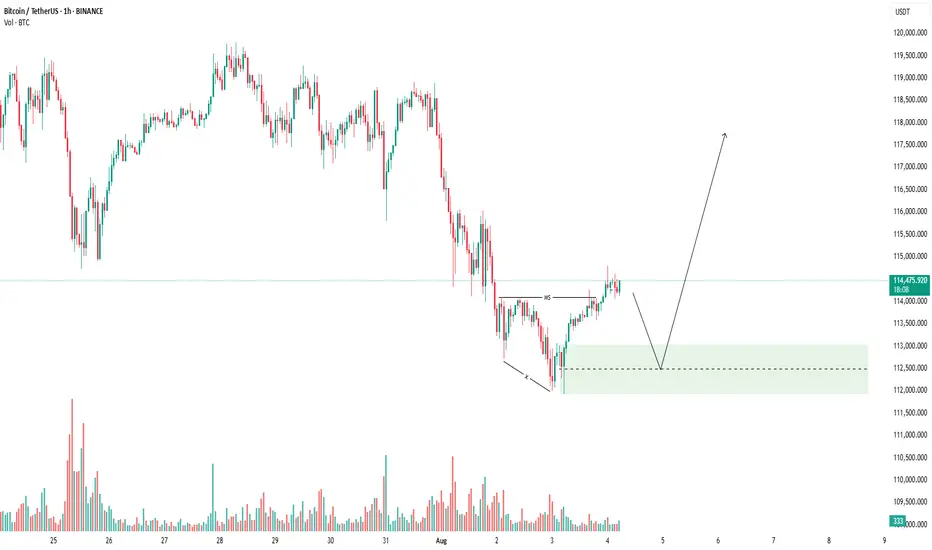
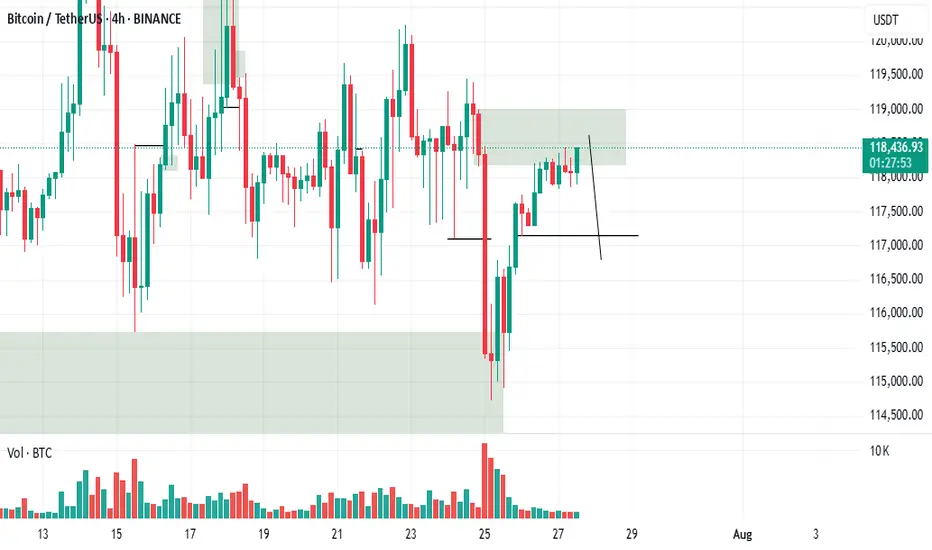
BITCOIN BTCUSDT BUYING SETUPBitcoin is currently showing bullish momentum after a clear market structure (MS) shift. The price has formed a bullish reversal and is now retracing after a short-term rally.
We expect BTCUSDT to pull back into the highlighted demand zone (green area), which aligns with previous structure and volume support. If the price taps this zone and shows bullish confirmation, it could present a high-probability buy entry for the next upward leg.
📌 Trade Plan:
✅ Wait for price to enter the green zone
✅ Look for bullish price action or volume confirmation
✅ Target higher highs if support holds
Always manage your risk properly and wait for clear confirmation!
BTCUSDTPreferably suitable for scalping and accurate as long as you watch carefully the price action with the drawn areas.
With your likes and comments, you give me enough energy to provide the best analysis on an ongoing basis.
And if you needed any analysis that was not on the page, you can ask me with a comment or a personal message.
Enjoy Trading ;)

BTC-A weak bull flag is forming A weak bull flag is forming on the 15 M — but momentum is stalling.
📈 Breakout Confirmation: Close above $116,500
📉 Invalidation: Close below $116,100
🧪 RSI is fading, struggling to regain strength. Wait for confirmation
Stay Sharp. Eliminate the Noise.

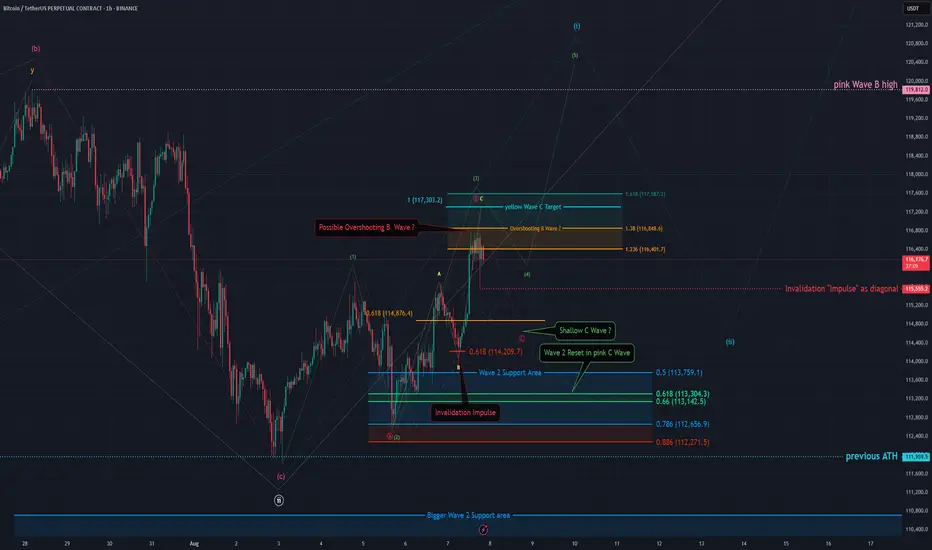
BTC - 1H Elliott Wave Analysis - 07.08.25Greetings and welcome back to another Bitcoin Elliott Wave Analysis!
This Analysis is a bit more complex due to recent price action.
The probabilities of the impulsive structure we discussed last time decrease as the price touched the 0.618 FIB at 114'209 USD of our supposed to be Wave 4 support area which is a warning sign.
It invalidated the impulse we looked into last time. That doesn't mean we turn bearish yet. We are still looking for higher prices to come!
We got two impulsive scenarios.
The first is that we still follow the green count just that it now is a leading diagonal which means every Wave is a three wave move as ABC. For our green Wave 3 in which we currently are this would be the yellow ABC which could be finished but preferably we get another high to hit the 1 to 1 FIB target at 117'303 USD before finishing the green Wave 3 and starting the green Wave 4.
Condition for this count is that we don't move below the last low at 155'555 USD which would shift probabilities to the other cases as the pullback would be too deep.
The other possibility is that we get a reset of the green Wave 2 meaning that the recent move up we saw from the 5th August low is part of the green Wave 2 correction. In this case the move up would be an overshooting Wave B displayed as part of the pink ABC here. Unlike the other count we would prefer to start the move down in pink Wave C now as it would look better.
This doesn't meant that we can't get another high in this count too.
We want to make aware that in this kind of correction which is called expanded flat it is common for Wave C to either undershoot or overshoot Wave A. This means that usually we could get a shallow Wave C to around +- 115'000 USD or a long C Wave.
The overshooting C Wave isn't possible here as it would go beyond the Wave 2 support area and invalidate the count unless we get another high first.
Sadly we can't really calculate the C targets yet due missing price action but we wanted to make you aware of the possibility of it being shallow. :)
Thanks for reading.
We would appreciate if you boost the idea if you enjoyed it as we put extra work into this one. :D
NO FINANCIAL ADVICE.
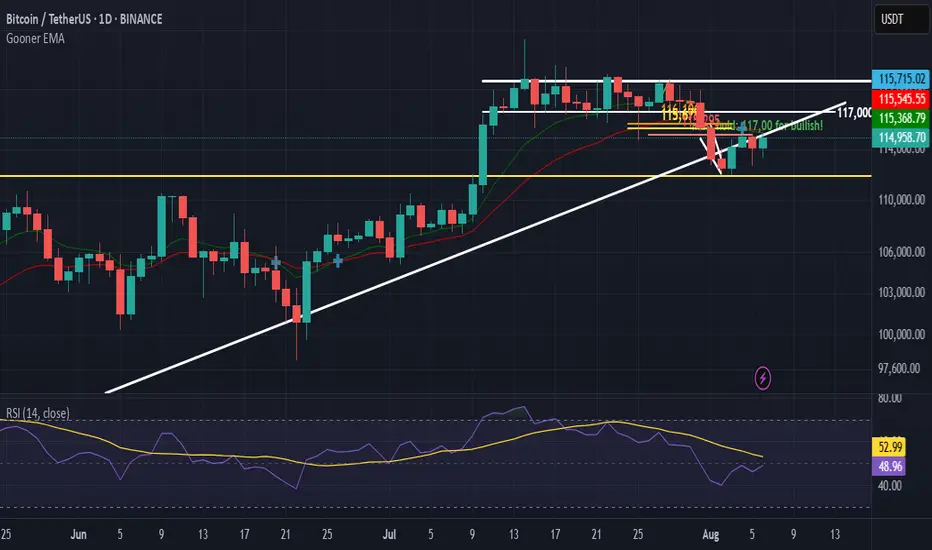
BTC Daily (August 7, 2025)Structure Detected
Ascending Parallel Channel
Bitcoin has been consistently respecting a broad ascending parallel channel (yellow lines) with three clean touches on both upper and lower bounds. The price is currently sitting near the midline of this channel — historically a pivot zone between continuation and pullbacks.
Trend: Strong uptrend with a clear sequence of higher highs and higher lows. Recent pullbacks have all respected the mid-channel and rallied afterward.
Heikin Ashi candles are used, which smooth price action — this makes trend strength visually clearer. A few red candles suggest temporary cooling, but not a structural breakdown.
Market Bias
Bullish — The macro structure remains strong, and price is riding the midline of a clean, long-term ascending channel. No signs of major distribution or topping yet.
If price maintains above the midline (~$115k), upside continuation is favored. A break and close below it could trigger a mid-term pullback to lower channel bounds.
Bullish Targets
If price continues upward from here:
$130,000 → Next horizontal confluence within the channel top zone.
$140,000–$150,000 → Upper channel resistance; could attract long-term profit-taking or final parabolic push.
$170,000 → Extreme target near the top extension of the outer parallel — would imply mania phase or major breakout extension.
Bearish Levels
If midline fails and Bitcoin pulls back:
$100,000–$105,000 → Prior support and lower mid-channel zone.
$90,000 → Bottom channel support — clean historical touchpoints.
$85,000–$80,000 → Strong psychological + structural support cluster; high-confidence long-term demand zone.
Timeframe-Based Targets
Daily Swing Targets
Upside: $130k → $140k → $150k
Downside: $105k → $90k → $80k
Weekly Structure: The weekly mirrors this bullish channel. As long as weekly candles close above ~$100k, the long-term trend is intact.
Summary:
Bitcoin remains in a well-respected bullish channel, currently riding the midline — a typical pivot zone. Holding this zone supports further upside toward $130k+. A breakdown below ~$115k could trigger a deeper pullback toward $100k–$90k support. Macro trend remains bullish unless the lower channel breaks.

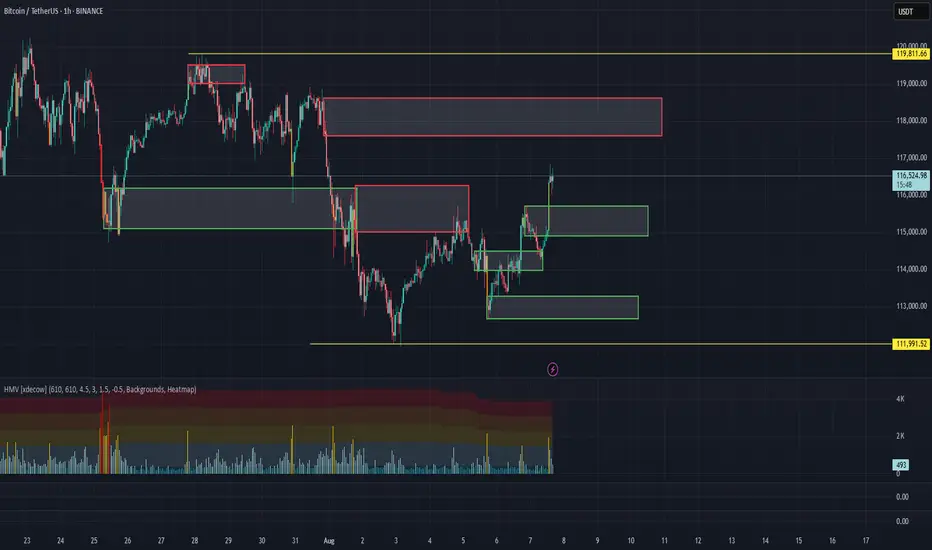
BTC/USDT Analysis – Full Trend Reversal
Hello everyone! This is the daily market update from a CryptoRobotics trader-analyst.
Yesterday, Bitcoin broke the local market structure to the upside and tested the previously highlighted zone at $114,500–$114,000 (a mirror volume area). A strong buying reaction followed immediately, pushing the price to a new local high.
At this point, we are witnessing a full shift in market direction toward an uptrend. Seller activity remains weak, so we expect the price to continue rising — at least toward the next selling zone at $117,600–$118,600 (volume accumulation).
Below, a new volume area has formed between $115,800 and $114,900. We are watching closely for buyer activity there. If confirmed, it could serve as a long entry. Without such confirmation, the current breakout could turn into a false move, in which case the market may return to sideways rotation.
Buy zones:
$115,800–$114,900 (volume cluster)
$113,300–$112,700 (local absorption of selling)
$110,000–$107,000 (accumulated volume)
Sell zone:
$117,600–$118,600 (accumulated volume)
This publication is not financial advice.
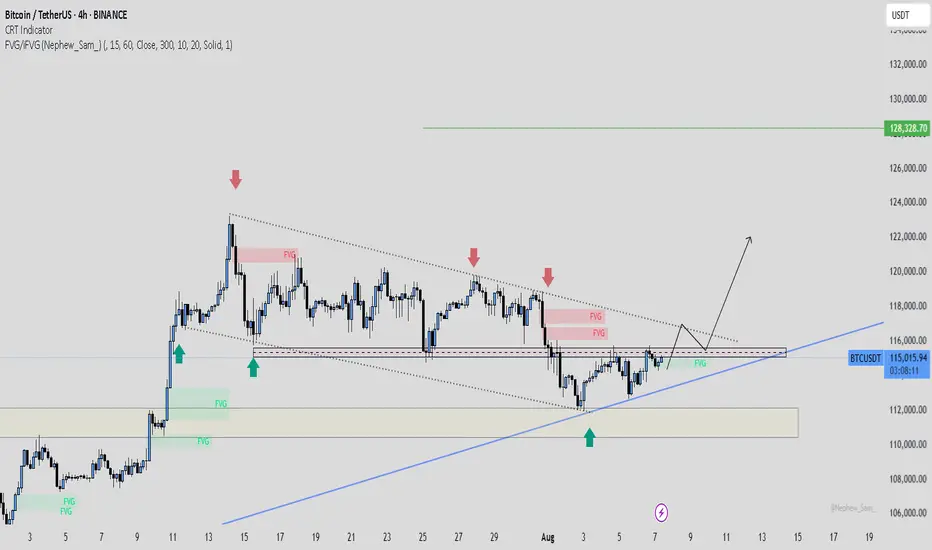
BTCUSDT: The Fuse is Lit | Wedge breakout LoadingThis chart is screaming breakout.
BTC has been coiling inside this falling wedge for weeks and every dip into the demand zone near 110K–112K has been aggressively defended (check those green arrows). Now? Price is pressing hard against wedge resistance right at the top.
This is compression before expansion.
⚡What I'm Watching:
Bullish structure forming: higher lows ✔️
Price reclaiming key levels ✔️
Major breakout zone at 115,800–116,000 coming into play
Break and retest = rocket fuel to 122K and beyond
🎯 My Bullish Targets:
TP1: 122,000 (magnet level)
TP2: 128,328 (next HTF target)
🚨 Invalidation:
A clean break below 112K? I step aside. Until then bullish bias stays on.
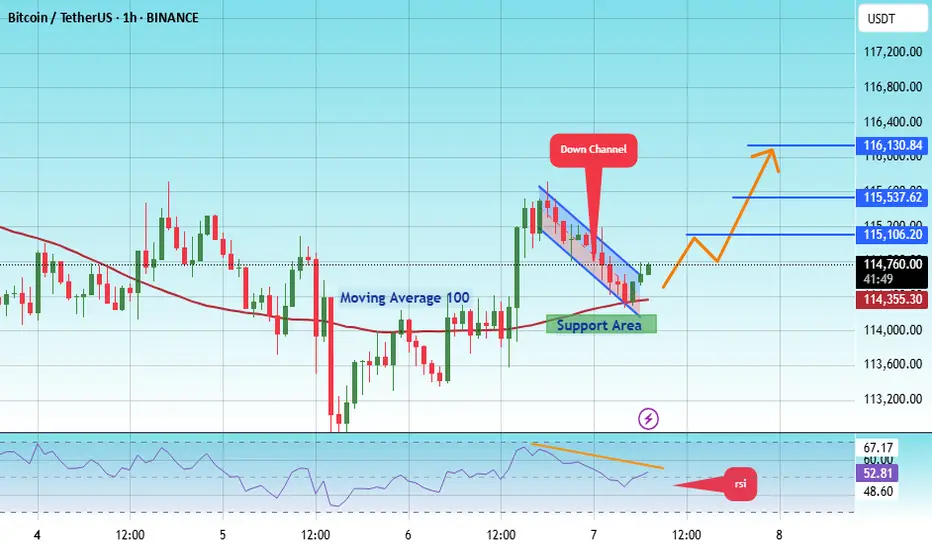
#BTC/USDT Breakout needed #BTC
The price is moving within an ascending channel on the 1-hour frame, adhering well to it, and is on track to break it strongly upwards and retest it.
We have support from the lower boundary of the ascending channel, at 114200.
We have a downtrend on the RSI indicator that is about to break and retest, supporting the upside.
There is a major support area in green at 114000, which represents a strong basis for the upside.
Don't forget a simple thing: ease and capital.
When you reach the first target, save some money and then change your stop-loss order to an entry order.
For inquiries, please leave a comment.
We have a trend to hold above the 100 Moving Average.
Entry price: 114700.
First target: 115106.
Second target: 115537.
Third target: 116130.
Don't forget a simple thing: ease and capital.
When you reach the first target, save some money and then change your stop-loss order to an entry order.
For inquiries, please leave a comment.
Thank you.
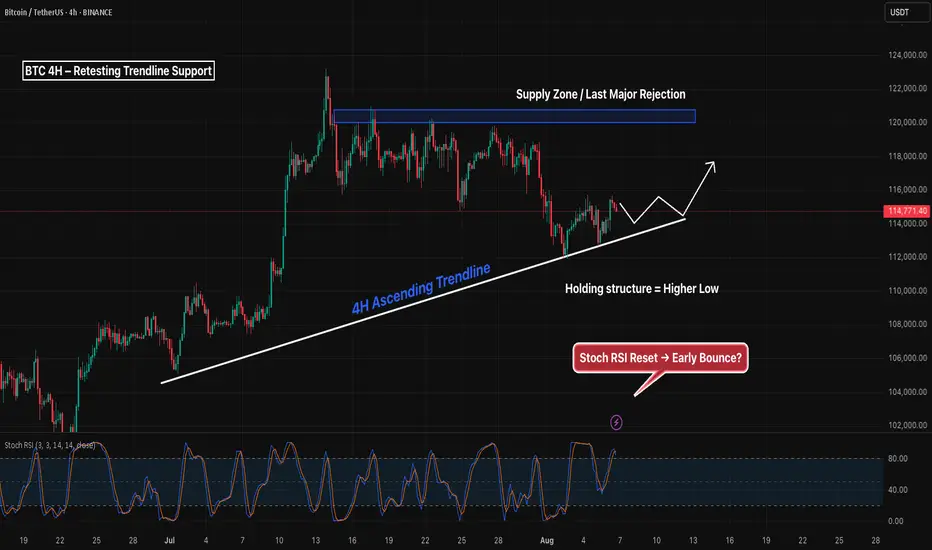
BTC 4H – Retesting Trendline Support, Will Supply Reject Again?Bitcoin is retesting a clean 4H ascending trendline after forming a local higher low — with Stoch RSI starting to turn upward from the bottom. This trendline has acted as reliable support since early July.
If price continues to hold and flip the mid-range ($116K), the next major test comes at the overhead supply zone ($119K–$121K), where price was previously rejected multiple times.
Key levels to watch:
– Trendline support (currently holding)
– Mid-range reclaim (~116K)
– Supply zone rejection or breakout (119K–121K)
– Stoch RSI bounce = potential early signal
Bullish continuation hinges on strength through supply — otherwise, this may form another lower high. Watching for confirmation from price action + momentum.
Short Probably!Hello all. before all I wanna tell you that I am not a crypto trader and it is unknown market to me but if it works as Forex market, market will go down from here. be happy(wink)
BEATRONXbtronx is the best btonx i hope she paldos oh my god i am jusy filling up thr word limit that it is requiring before i can publish ehheehe
BTCUSDT: Touch 124000$Hello everyone we see the second wave of 5th wave and start to uptrend and touch the 124k price. Good luck.

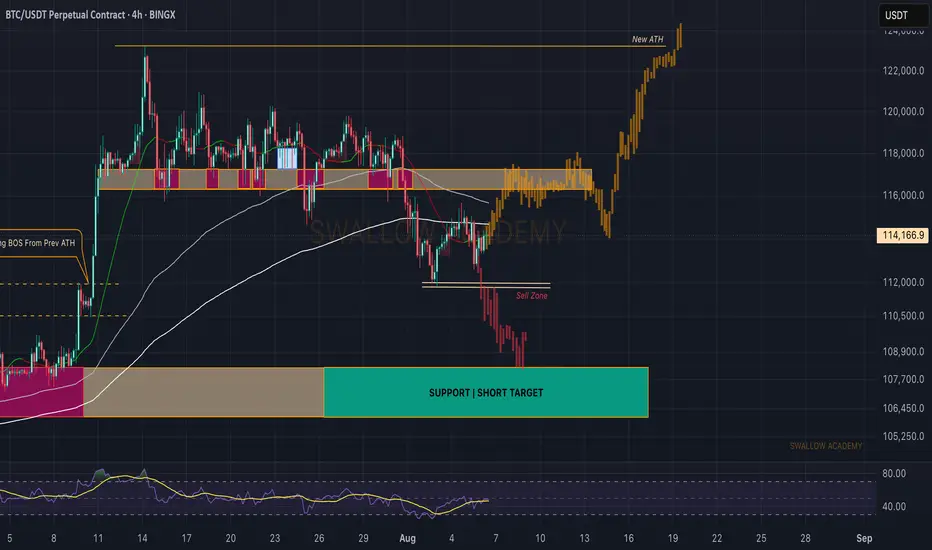
Bitcoin (BTC): Filled Bearish CME Gap | Still Bullish Bitcoin had a smaller correction, which filled the local CME gap; after that, we are seeing a good chance for upside movement to happen.
Now we are keeping the same bullish game plan as we had before, as we are still far from the sell zone and as long as we are above the sell we are l are looking for a re-tet of upper resistance zone and ATH area.
Swallow Academy
I just got filled for a long hereAs an alert I just got filled with a small limit order long and intend to add to it within this range with more frequency in the bottom half with (again) very small orders as I want to average down my entry price before we ideally pump up next if it works out that way. And if not (so in the case we gradually keep grinding down in price) I can continue to add longs until we get a bounce which may provide the opportunity to get out at break even or a small profit. But I am happy with the value of the areas I have focused on and not chasing pumps. Enjoy!
BTC(20250806) market analysis and operationAugust 6th BTC Contract Technical Analysis:
Today, the large-scale daily chart closed with a small bullish candlestick pattern, with consecutive bullish candlesticks. However, the price remains consolidating at a high level, with no signs of an upward breakout. The accompanying indicator forms a death cross. Therefore, based on the current trend, the price is still within the range, with rising and falling prices unlikely to continue or break out of the range. Therefore, trading should be considered within the range. The short-term hourly chart showed yesterday's intraday gains, followed by pressure and declines in the European session, with the US session continuing its correction. Prices rebounded after finding support in the Asian morning. The current candlestick pattern shows consecutive bullish candlesticks, with the accompanying indicator forming a golden cross. Therefore, an intraday rise is highly likely, but the overall trend is stuck in a range-bound market, so a one-sided trend should not be considered.
Today's BTC Short-Term Contract Trading Strategy:
Buy on a pullback to the 113,700 area, with a stop-loss at 113,200 and a target of 115,000. Sell on a touchdown to the 115,200 area, with a stop-loss at 115,700 and a target of 114,000. Focus on the short-term range.

Possible run to 130 in the cardsEasily invalidated.
We are using the patterns from the price action post threshold break (redline in bottom pane)
These breaks are unseen on this time frame
The volume instabilities are between the 15 minute and the 1 hour. I would look for breaks under 15 minutes, too much noise at that level. Go ahead and test it yourself. See my script posted on trading view for details.
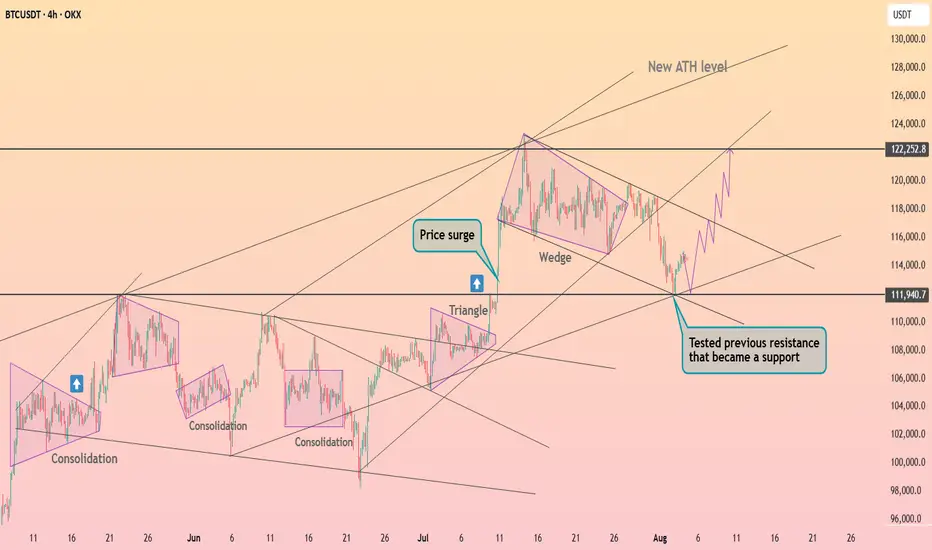
Bitcoin fixed above the $112k ┆ HolderStatOKX:BTCUSDT is recovering after touching the $111,940 zone, now confirmed as strong support. The price is reversing from the lower wedge boundary, suggesting renewed momentum. A clean push could retarget $122,250 in coming sessions.
BTC - 1H Elliott Wave Analysis - 05.08.25Greetings, this is an update of our Elliott Wave Count for Bitcoin.
Today we are going to look at the bullish and bearish scenarios so everybody is well prepared for the upcoming price action.
We have seen a pullback since yesterday's update.
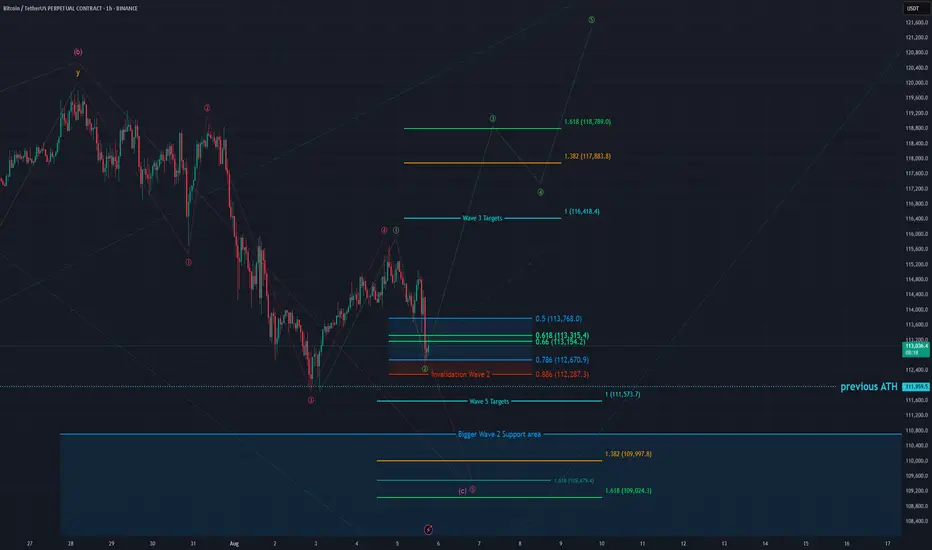
The pullback entered and is currently in our Wave 2 support area which is between the 0.5 FIB at 113'640 USD and the 0.786 FIB at 112'616 USD. The bulls would like to see a bounce now in green Wave 3 of which the targets are the 1 to 1 FIB at 116'418 USD, the 1.382 FIB at 117'883 USD and the 1.618 FIB at 118'789 USD which is also the optimal target for a Wave 3.
Due not invalidating the red Wave 4 we could form the red Wave 5.
Be aware that on the lower timeframes we did touch the 0.886 FIB of a smaller Wave 2 support area which does indicate weakness and usually is followed by another low. If we touch the 0.886 FIB of the Wave 2 support area at 112'287 USD it is also an invalidation of the green bullish count.
Red Wave 5 targets are the 1 to 1 FIB at 111'573 USD which is additionally right below the last low and the last all time high which could function as further support. Further targets would be the 1.382 FIB at 109'997 USD and the 1.618 FIB at 109'024 USD as well as another 1.618 FIB at 109'479 USD.
Be aware that the bigger Wave 2 support area goes down to 103'000 USD.
We think another low is more probable meaning the red count has the higher probability.
Yet we think the green count is a good opportunity as we have a clear set up and invalidation point.
Thanks for reading.
We would appreciate a follow and boost if you like the analysis! :)
NO FINANCIAL ADVICE.
btc usd short term down 50 to 70 pips btc usd short term down 50 to 70 pips
fell free contrect me if you have any question

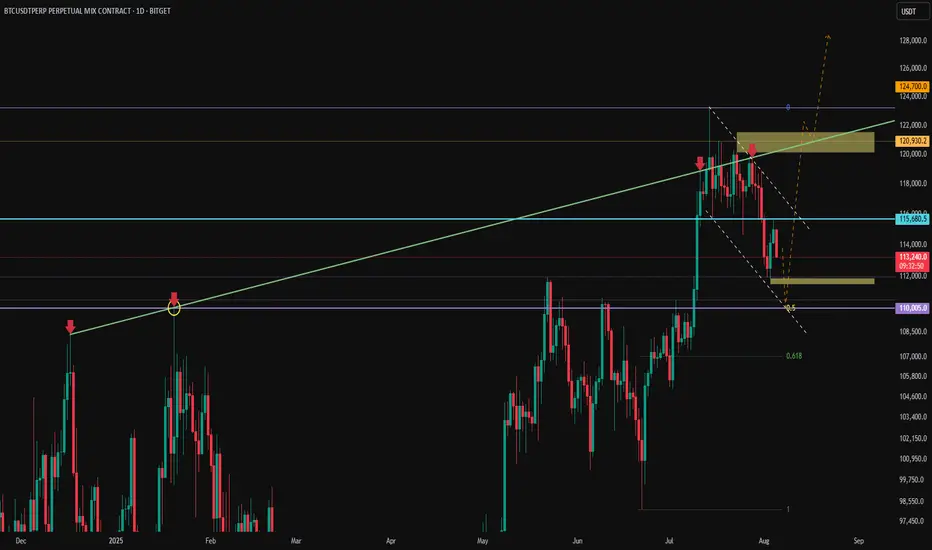
BTC - trend lines and liquidity zonesHere is a summary of what I'm looking at:
Price currently struggling to surpass the Weekly low @ 115,650 (Blue line)
The green line is acting as resistance, with a brief break-through mid-July.
Huge liquidity zone 120-121.5K which will be inevitably grabbed (Yellow box)
Liquidity sitting below @ 111K (Yellow box)
0.5 fib currently at @ 110K (which also acted as the Weekly high in Jan 25)
A descending channel formation
Analysis:
I believe that Bitcoin with visit the 110K - 111.5K zone which also coincide with the bottom of the channel, the Weekly high @ 110K and 0.5 fib (ish) and grab what liquidity is currently sat below.
Once done, move up to the higher liquidity zone, which would break once again above the Green line which would hopefully flip into support, and send BTC parabolic with a peak Nov-Dec.