HOW TO Spot Liquidity-Driven Reversals & Market TrapsAdaptive Liquidity Pulse
🎯 Spot Liquidity-Driven Reversals & Market Traps
The Adaptive Liquidity Pulse is designed to help traders detect high-volume rejections and absorptions, revealing where big players are likely defending or accumulating positions. This indicator is especially useful for spotting market traps, liquidity sweeps, and swing reversals.
⸻
🧠 How It Works
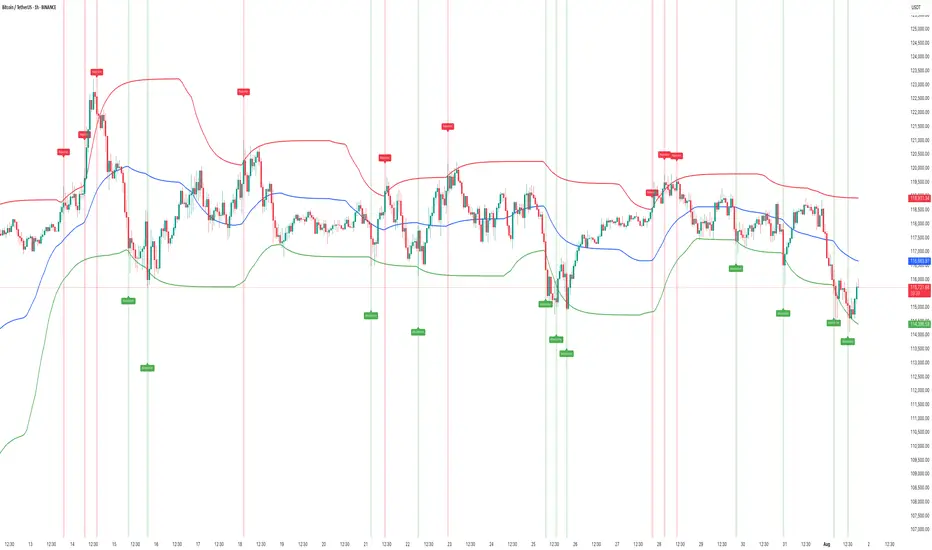
1. Dynamic Liquidity Zones
• Red Band (High EMA) → Potential supply/rejection zone
• Blue Band (Mid EMA) → Equilibrium / magnet zone
• Green Band (Low EMA) → Potential demand/absorption zone
2. Signal Labels
• 🔴 Rejection → Price spikes into high liquidity with volume → Bearish bias
• 🟢 Absorption → Price flushes into low liquidity with volume → Bullish bias
3. Volume-Weighted Detection
• Only triggers signals when volume exceeds a configurable threshold
• Filters out weak moves, highlighting true liquidity events
⸻
📊 Best Use Cases
• Scalping & Intraday Trading: Identify early reversal points
• Swing Trading: Track absorption/rejection cycles to time entries/exits
• Liquidity Sweep Detection: Spot where false breakouts occur with volume confirmation
⸻
⚡ Trading Tips
• Use Rejection (Red) for short entries or take-profits near highs
• Use Absorption (Green) for long entries or short exits near lows
• Combine with support/resistance zones or trend structure for higher accuracy
• Midline (Blue) often acts as a mean-reversion magnet in ranging markets
⸻
📢 Alerts
• 🔴 Rejection Alert → Strong selling pressure at liquidity zone
• 🟢 Absorption Alert → Heavy buying at demand zone
⸻
🧠 Why Traders Love It
• ✅ Visualizes hidden liquidity interactions
• ✅ Highlights trap zones before reversals occur
• ✅ Works across crypto, indices, forex, and commodities
• ✅ Designed for confluence with other strategies
⸻
This script gives you a real-time pulse of liquidity shifts, allowing you to trade like institutions and avoid falling into retail traps.
⸻
USDTBTC trade ideas
Bitcoin Go 89kBe prepared for a market correction. BIT has a negative divergence on the weekly timeframe.

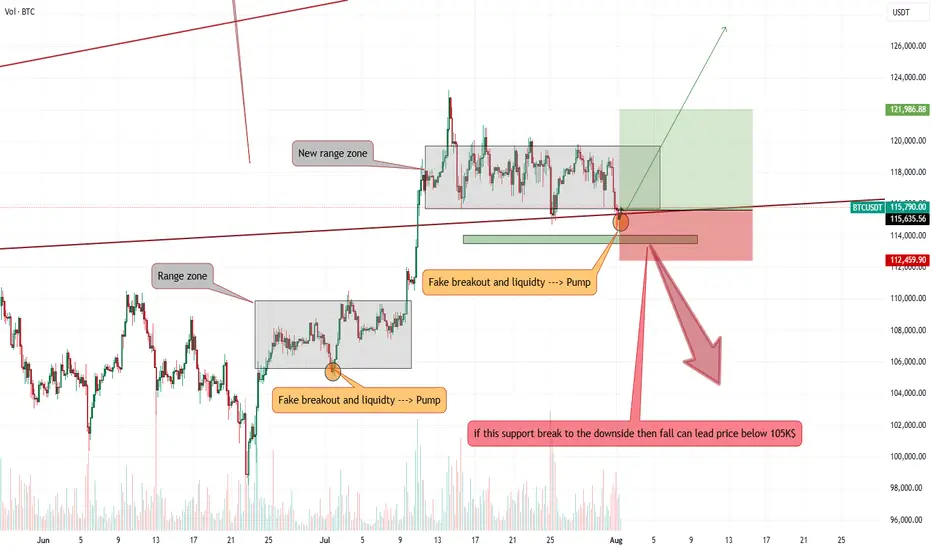
Bitcoin stop loss hunting end, entry for Long is now!!Hi on this chart that may happen with more than 70% possibility we have one of the easy setups and strategy which i call it FAKEOUT&LIQUIDTY this happen usually near trendline support or range zone support or even resistance and after a possible fakeout usually market kick sellers or Buyers and then with high volume market reverse.
I saw High volume and Fake breakout in my mind and i think it can be one of those times so we open long and lets now wait for this 1:2(Risk:Reward) signal to play.
DISCLAIMER: ((trade based on your own decision))
<<press like👍 if you enjoy💚
[SeoVereign] BITCOIN BULLISH Outlook – August 1, 2025We are the SeoVereign Trading Team.
With sharp insight and precise analysis, we regularly share trading ideas on Bitcoin and other major assets—always guided by structure, sentiment, and momentum.
🔔 Follow us to never miss a market update.
🚀 Boosts provide strong motivation and drive to the SeoVereign team.
--------------------------------------------------------------------------------------------------------
Hello.
This is SeoVereign.
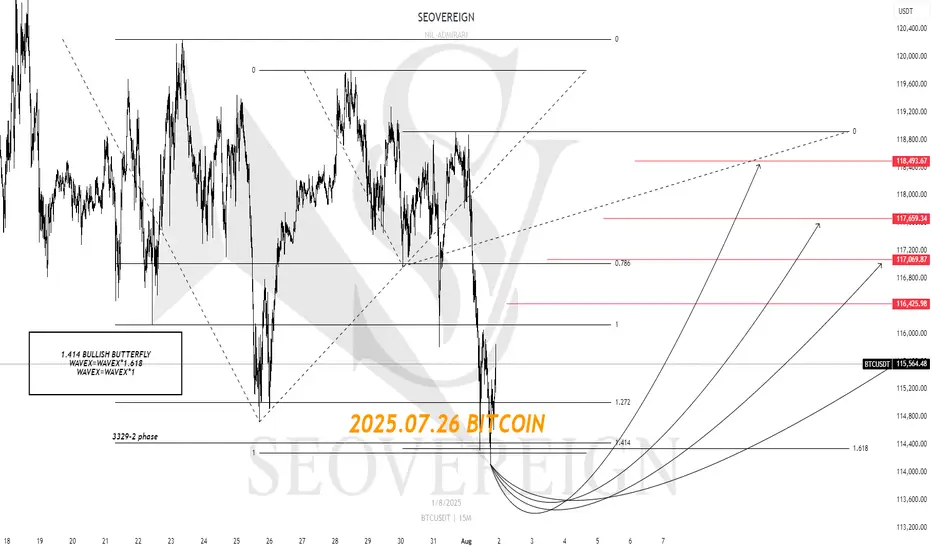
My fundamental view on Bitcoin, as mentioned in the previous idea, is that I am anticipating an overall downward trend. In the mid- to long-term, I believe the downward pressure will gradually increase, and this is partially confirmed by various indicators and the overall market sentiment.
However, before we fully enter this downward phase, I have been judging that one more upward wave is likely to remain. I have focused my strategy on capturing this upward segment, and I have recently reached a point where I can specifically predict the development of that particular wave.
If this upward move unfolds successfully, I plan to set my take-profit range conservatively. The reason is simple: I still believe there is a high possibility that the market will shift back into a downtrend afterward. The core of this strategy is to minimize risk while realizing profits as efficiently as possible toward the tail end of the wave.
The relevant pattern and structure have been marked in detail on the chart, so please refer to it for a clearer understanding.
In summary, I view this rise as a limited rebound that could represent the last opportunity before a downturn, and I believe this idea marks the beginning of that move.
I will continue to monitor the movement and update this idea with additional evidence. Thank you.
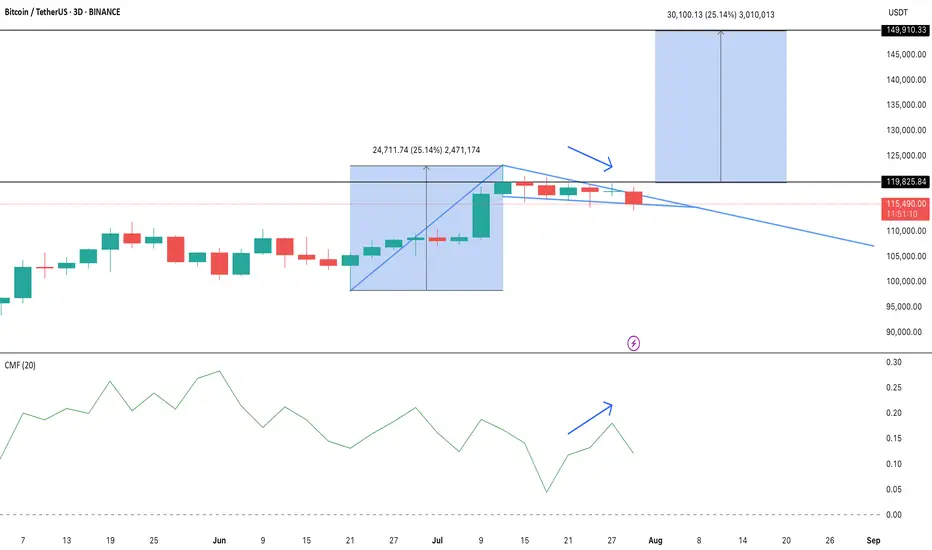
BTC/USDT Analysis – Bullish Pennant Holds Key to $150,000 TargetBINANCE:BTCUSDT is holding just above $115,000, recovering from a 2.4% dip in the last 24 hours, with one technical setup dominating the conversation: a bullish pennant on the 3-day chart.
The pattern formed after a sharp 25% rally earlier this month, creating a classic pole-and-pennant structure. Multiple breakout attempts have failed so far, with long wicks signaling heavy volatility, but the pattern remains valid as long as the BINANCE:BTCUSDT price stays above the $114,000 support zone.
A confirmed 3-day candle close above $119,700—the top of recent failed breakouts—would likely trigger the next leg higher. A measured move from the pole projects an upside target near $150,000, aligning with long-term bullish expectations.
Supporting this setup, the Fund Flow Ratio has been making lower highs, suggesting fewer coins are heading to exchanges and potential sell pressure is easing. At the same time, Chaikin Money Flow (CMF) on the 3-day chart is forming higher highs, signaling quiet accumulation despite recent price dips.
Until either level breaks, BINANCE:BTCUSDT trades in a pivotal range. Bulls want a clean breakout above $119,700, while a drop below $114,000 would invalidate the pattern and open the door to further downside.
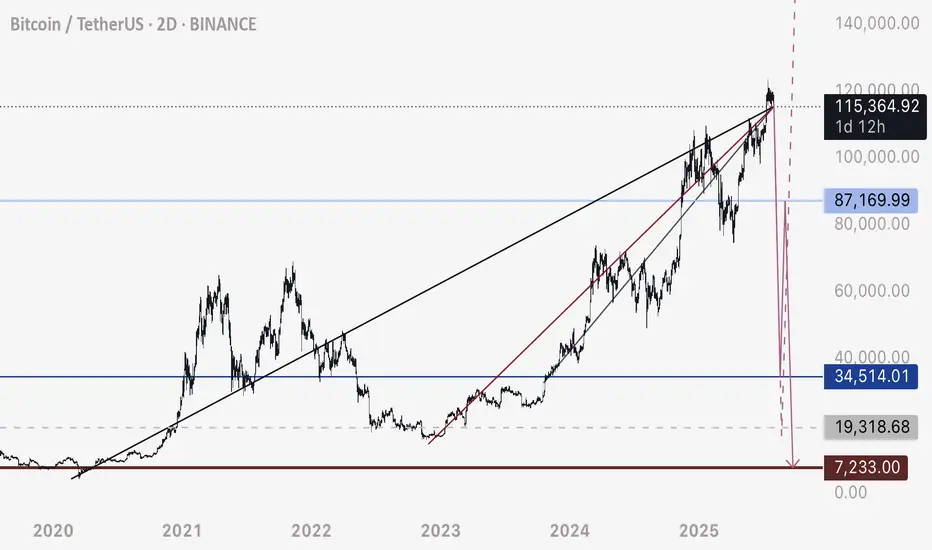
BTC - Not the End of the DropRather the beginning. Bitcoin has fallen below this bearish intersection. Anticipating price to fall rapidly on one of these two pathways to the Uber low liquidity levels.
DXY is retesting a major bearish breakdown - this is the conduit that will justify a flash crash of this magnitude prior to a 3-5 year bull run.
Happy trading.
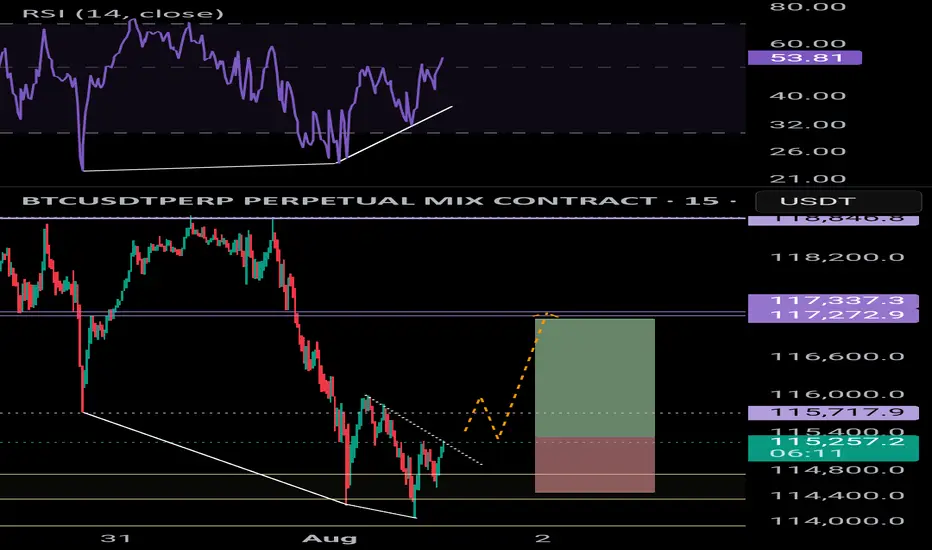
BTC bullish div.Bullish divergence on the 15m and 1H chart 📈
Liquidity grabbed 📈
Expecting a small move up = 1.6%
Long scalp trade if youre interested
TradeCityPro | Bitcoin Daily Analysis #141👋 Welcome to TradeCity Pro!
Let’s dive into Bitcoin analysis. Yesterday, the exact bearish scenario I told you about happened. Let’s see what opportunities the market is offering us today.
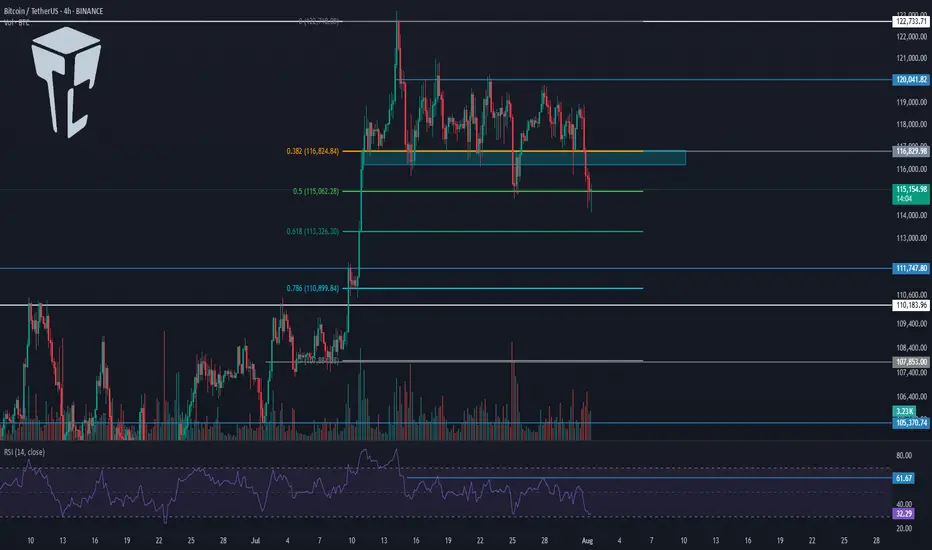
⏳ 4-Hour Timeframe
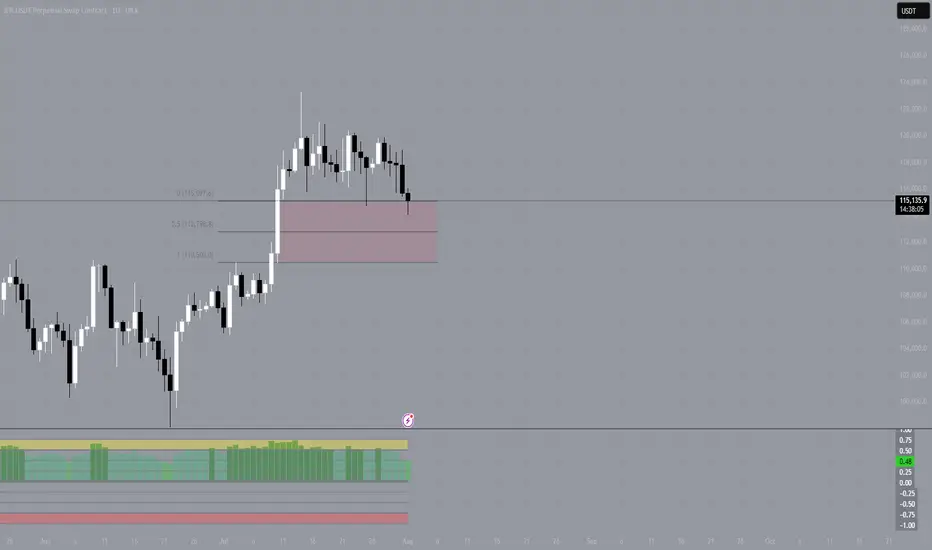
Yesterday, I mentioned that the price had tested the 116829 zone too many times and that this area had become very weak. I also said that if the price made a lower high than 120041, deeper corrections would be likely.
✔️ Another perspective I have on the market is that sometimes certain support and resistance levels simply aren’t strong enough to continue the trend.
🔑 For example, in this case — despite Bitcoin being in an uptrend across all cycles — the 116829 support couldn’t hold, and the price broke it to reach a stronger support zone, one that might be capable of continuing the trend.
📊 Right now, this is what might be happening again. Support levels like 0.5, 0.618, and 0.786 Fibonacci retracement zones could be where the next bullish leg begins.
✅ At the moment, price has reached the 0.5 Fibonacci level, and the previous strong bearish momentum has slightly weakened. If you look at the volume, momentum is still in favor of sellers, but based on the long lower wicks on the candles, we can say the bearish trend is showing signs of weakness.
💥 On the other hand, RSI is approaching 30, and in an uptrend, when RSI nears the Oversold zone, it can often be a good entry point for a long. However, we’re not acting on this yet — we’ll wait for more confirmations before opening any positions.
⭐ For now, there’s no trigger for a long position on this timeframe. A break below 115000 could act as a short trigger, but given the trend Bitcoin is in, I’m not opening any short positions at the moment.
⏳ 1-Hour Timeframe
The price has dropped down to 114560, and I believe today we might enter a corrective phase. However, if the price stabilizes below 114560, the correction could continue. The next targets would be the Fibonacci levels from the 4-hour timeframe.
🔽 I won’t open a short position with the break of 114560, and I suggest you don’t take that short either.
📈 If this move turns out to be a fakeout, the first trigger we have now is at 118736, which is quite far from the current price. For this trigger to activate, we’d need to see a V-pattern form.
🔍 There are no other triggers right now. But if more range structure forms, we might consider opening a risky long on the breakout of the range top.
❌ Disclaimer ❌
Trading futures is highly risky and dangerous. If you're not an expert, these triggers may not be suitable for you. You should first learn risk and capital management. You can also use the educational content from this channel.
Finally, these triggers reflect my personal opinions on price action, and the market may move completely against this analysis. So, do your own research before opening any position.
BTCUSDT – Key Support Holding! Next Targets if 115,827 BreaksBitcoin is currently holding above a crucial support zone around 115,220. After a recent drop to the 114,979 area, buyers stepped in strongly, preventing further downside.
📊 If price stabilizes above 115,220 and successfully breaks through the resistance at 115,827, I expect bullish continuation towards the following targets:
🎯 Target 1: 117,900
🎯 Target 2: 119,076
These zones acted as strong resistances previously, and breaking through them could open the path to further upside.
⚠️ However, if BTC closes below 114,500, we may see a bearish breakdown with potential downside towards 108,000 – 106,000 range.
📌 Personally, I hope Bitcoin holds this support as it’s a key level to maintain bullish momentum.
Let’s see how the market reacts in the next few candles! BINANCE:BTCUSDT

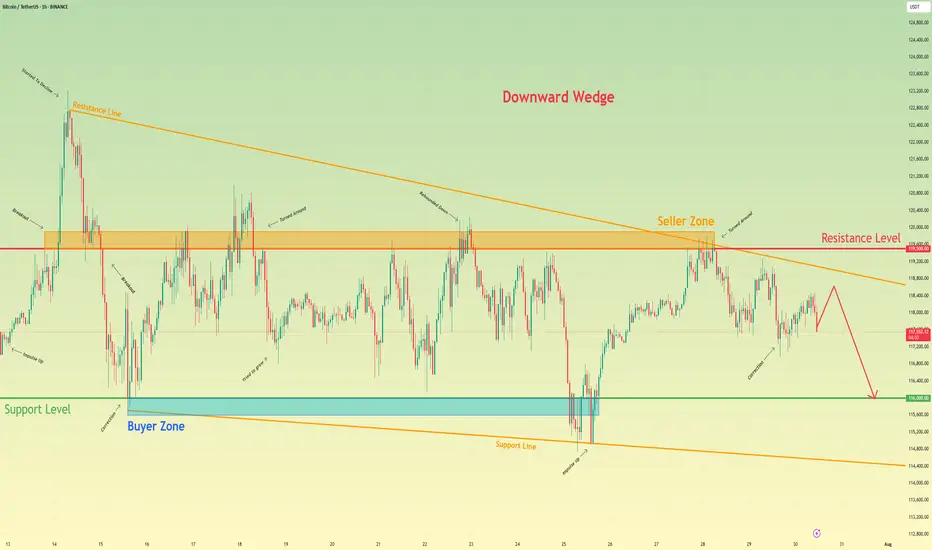
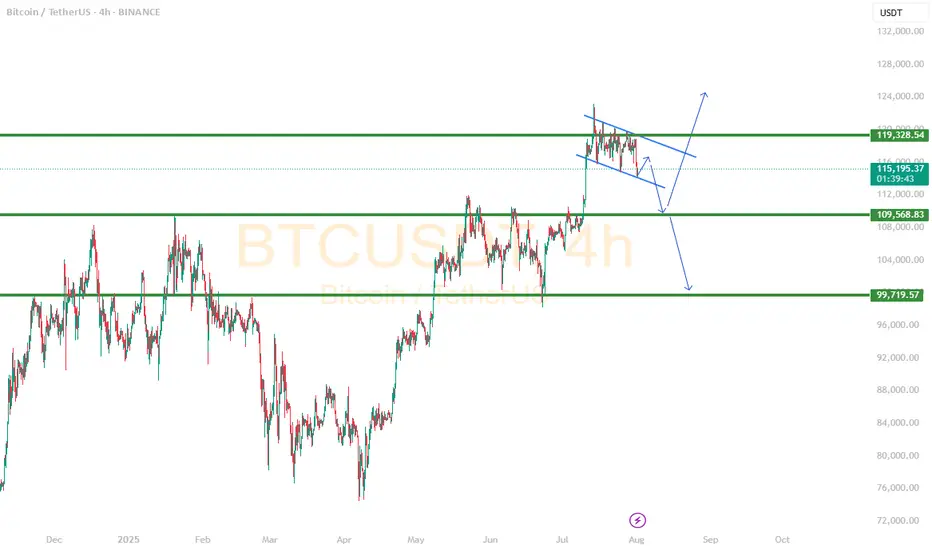
Bitcoin will continue to decline to support levelHello traders, I want share with you my opinion about Bitcoin. Following a period of a broad downward trend, bitcoin's price action has been channeled into a large downward wedge, a pattern that signifies converging volatility and a period of consolidation before an eventual decisive move. This market action is taking place between two critical, well-established zones: a major seller zone capping rallies around the 119500 resistance level and a significant buyer zone providing support near 116000. Recently, an upward rebound attempted to test the upper boundary of this wedge but was met with strong selling pressure from the seller zone, confirming its validity as a formidable barrier. The price is now correcting downwards after this rejection. The primary working hypothesis is a short scenario, anticipating that the bearish momentum from this recent failure will continue to drive the price lower. While a minor bounce or retest of local resistance is possible, the path of least resistance within the pattern's structure is now towards its lower boundary. Therefore, the TP is strategically set at the 116000 level. Please share this idea with your friends and click Boost 🚀
Disclaimer: As part of ThinkMarkets’ Influencer Program, I am sponsored to share and publish their charts in my analysis.
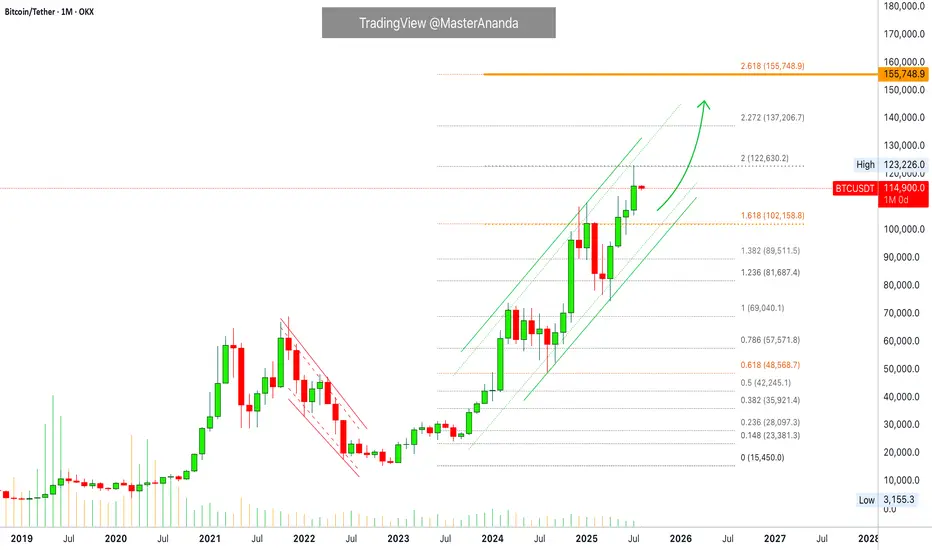
Bitcoin Monthly · Parabolic Rise ContinuesLast month Bitcoin produced its best numbers ever. The highest wick and close, a new all-time high at $123,226.
Bitcoin is not exhausted on the monthly timeframe but there is room for a retrace before the month ends. Think of the first part of the month being mixed, neutral or even bearish while the second half becomes full time bullish.
The levels that are relevant are $122,000 on the bullish side and $102,000 on the low. Right now the action is happening close to the middle so anything goes.
In 2020 Bitcoin produced 7 monthly candles growing and this was repeated again in 2023. In 2025 we have so far four green candles which means that Bitcoin can easily continue to grow. It has been known to produce more than four months green many times but there can be exhaustion at some point.
Bitcoin has been moving within a strong uptrend and is likely to continue rising. Bullish until the chart says otherwise. We are going up. Short-, mid- and long-term.
As Bitcoin consolidates near resistance, the altcoins will continue to build strength in order to grow. Remember, we are still looking at bottom prices across thousands of altcoins. Only a few moved ahead and are trading at all-time highs, the rest will catch up. The time is now, late 2025. The best is yet to come.
Namaste.
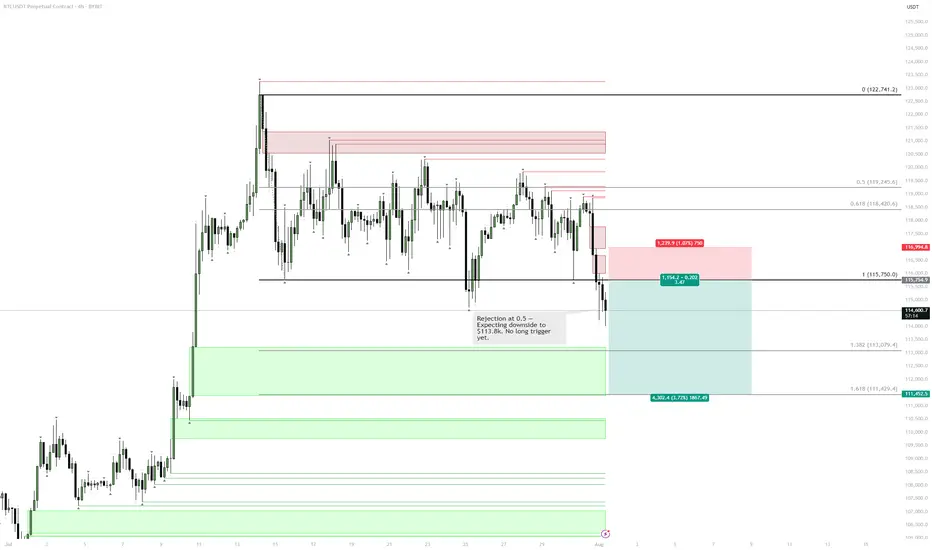
BTC | Short Bias — Targeting $113kPrice rejected perfectly off the 0.5 retracement and is now filling the previous imbalance.
Yesterday's daily close was decisively bearish, confirming downside momentum.
There’s a lack of convincing reversal signals at current levels.
Plan:
Main expectation is continued downside toward the $113k support.
Not interested in longs until price stabilizes at or below that level.
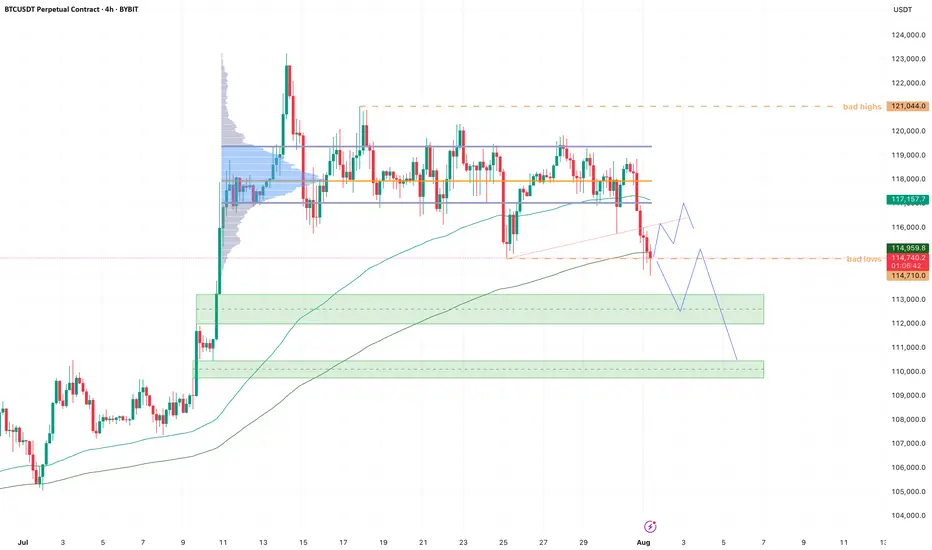
BTC - Cleaned up the lows!Bearish momentum is starting to stall here at the lows.
New month, and we started it by cleaning up the previous month's bad lows.
If we can hold here I'm looking for a trendline retest and VAL retest soon. Maybe we get one more sweep of the low, giving us a three drive pattern.
Reclaim VAL then it's back to VAH, maybe take out all the bad highs.
If we start bleeding into the lower demand zone (green box), I will start paying attention for a potential bearish retest into 110k, which we be our last area of imbalance to fill.
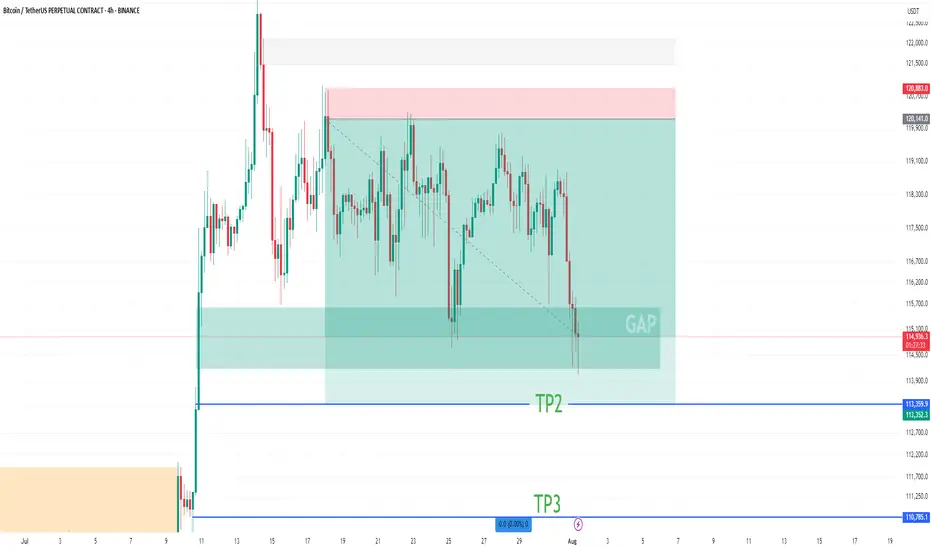
BTC Short Update Hello ❤️
Bitcoin
Let's have an update on Bitcoin analysis
💁♂️ First Target 🔥
Near Second Target
According to the analysis I posted on the page, Bitcoin touched the first target and is now near the second target
It is a good place to save profits. The price gap is filled
Please don't forget to like, share, and boost so that I can analyze it for you with more enthusiasm. Thank you. 💖😍
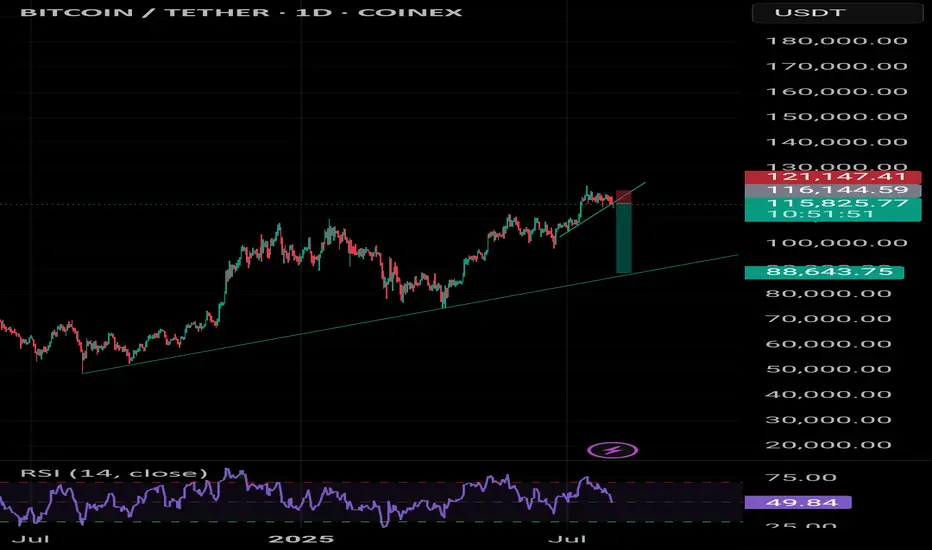
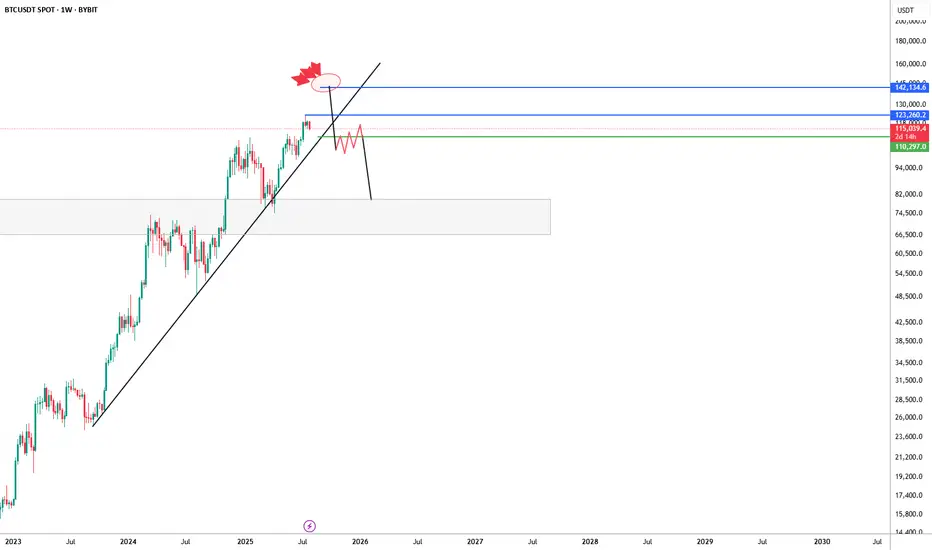
BTC/USDT Weekly – Bearish Rejection Brewing?Bitcoin has been riding a strong uptrend supported by a long-term ascending trendline, but recent price action is showing signs of exhaustion near the $123K–$142K supply zone.
The chart suggests a potential deviation above resistance, marked by a fakeout wick and aggressive rejection (highlighted with red blast icon). If price fails to reclaim and hold above $123K, the structure risks breaking down below trendline support — opening the door to a larger correction.
🔹 Key Resistance Zone: $123,260–$142,134
🔹 Critical Trendline Support: Recently broken — watch for retest/failure
🔹 Bearish Confirmation: Clean break & lower high formation under $109K
🔹 Next Major Demand Zone: $75K–$85K region
This setup leans bearish unless bulls can reclaim the upper blue range and re-establish control. If not, we could be looking at a significant macro retest of previous breakout levels.
#Bitcoin #BTC #BTCUSDT #CryptoChart #TrendReversal #BearishScenario
Two simple scenarios could playing out The buying pressure has been slightly less over the last week, I see a small improvement today but later this weekend, it is still likely to head downward towards the 110k area.
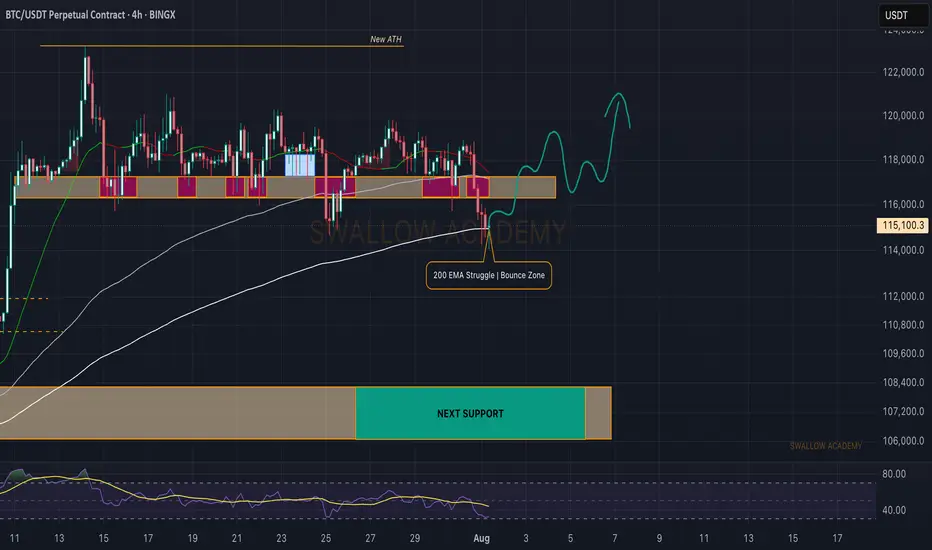
Bitcoin (BTC): 200EMA is Key Are Currently | Red Monthly OpeningBTC had a really sharp start to the month, and we are back near $115K, which was a key zone for us last time (due to huge orders sitting there).
Now, we see a similar struggle like last time but not quite the same, as the 200EMA has aligned with the $115K area. We are now looking for any signs of MSB, as we think we might get a recovery from here.
Now if we do not recover right now (by the end of today), we are going to see a really deep downside movement during the weekend most likely!
Swallow Academy
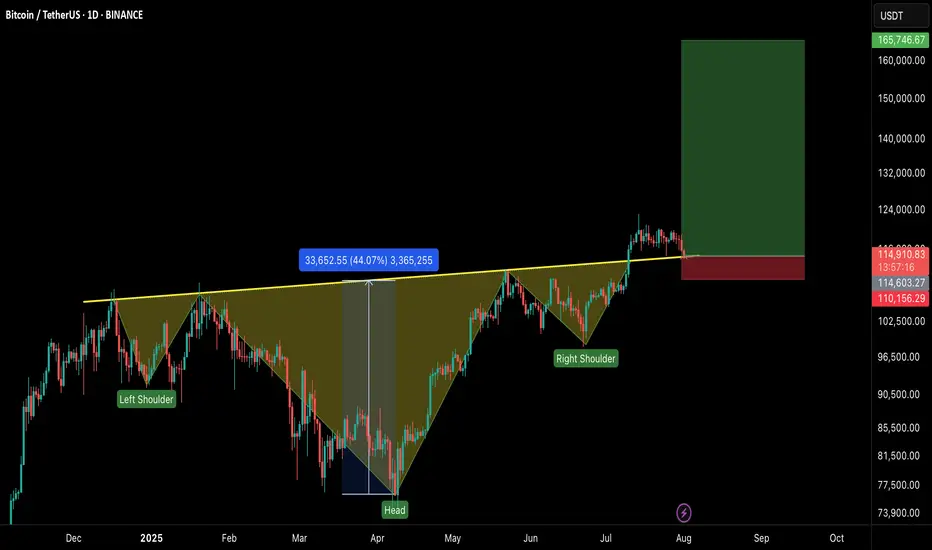
#BTCUSDT – Healthy Correction, Not the End!Bitcoin is currently experiencing a healthy pullback after an impressive run, testing the neckline of the Inverse Head & Shoulders breakout on the 1D timeframe.
🔹 Current Market View:
BTC is retesting the neckline of the IHS pattern, which now acts as a strong support zone.
Price is holding near $113K–$115K, which is crucial for maintaining bullish momentum.
This dip is a healthy correction, flushing out over-leveraged positions and preparing for the next leg up.
🔹 Key Levels:
Support Zone: $113,000 – $115,000
Immediate Resistance: $120,000 – $122,500
Breakout Target: $165,000+ on the next bullish wave
🔹 Market Sentiment:
Holding above the neckline keeps the bullish structure intact.
If the support holds, we can expect continuation to new highs once buying pressure returns.
A daily close below $112K would signal caution and delay the next rally.
💡 Tip: Don’t panic on these red candles. Healthy corrections are part of a sustainable uptrend.
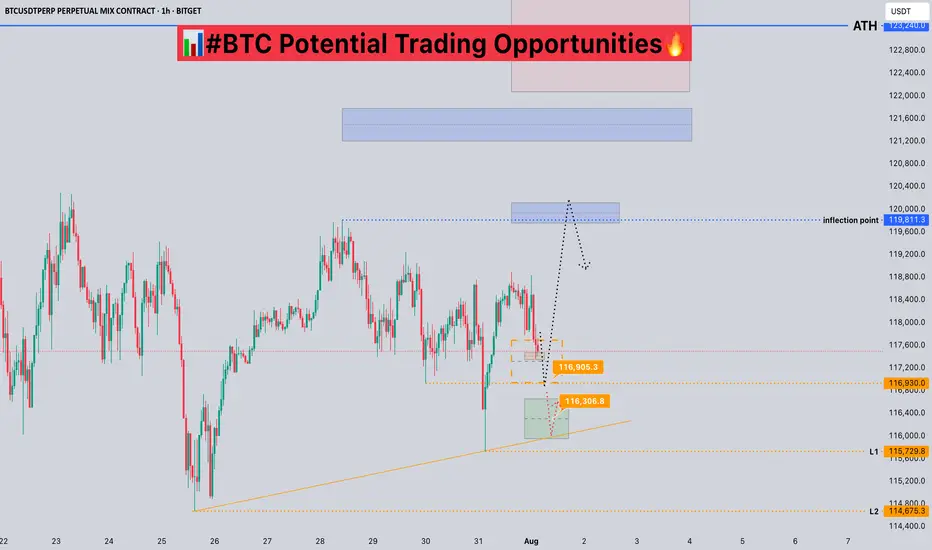
#BTC Potential Trading Opportunities📊#BTC Potential Trading Opportunities🔥
🧠We've been trading sideways for quite some time, and selling pressure has largely been exhausted, so we need to find support to enter a long trade.
➡️From a structural perspective, there's a chance for a bullish head-and-shoulders pattern to form. If this pattern holds, we could see a move above $120,000 or even higher.
Potential support is likely between $116,300 and $117,000.
Short-term resistance is around $120,000.
⚠️Note: A break below L1 would destabilize the structure and significantly reduce bullish expectations.
🤜If you like my analysis, please like 💖 and share 💬 BITGET:BTCUSDT.P
The Curtain Falls on the Script: Why I Believe It's Time to StopHello everyone, this is EC.
From late June through July, we experienced a full-fledged primary uptrend in crypto, driven by a weakening U.S. Dollar. From the script preview to the execution of the plan, every step has been clearly documented.
However, today, I want to share a different, more cautious perspective: I believe this script may be nearing its end.
I. Reviewing the Script and the "Bubble's" Manifestation
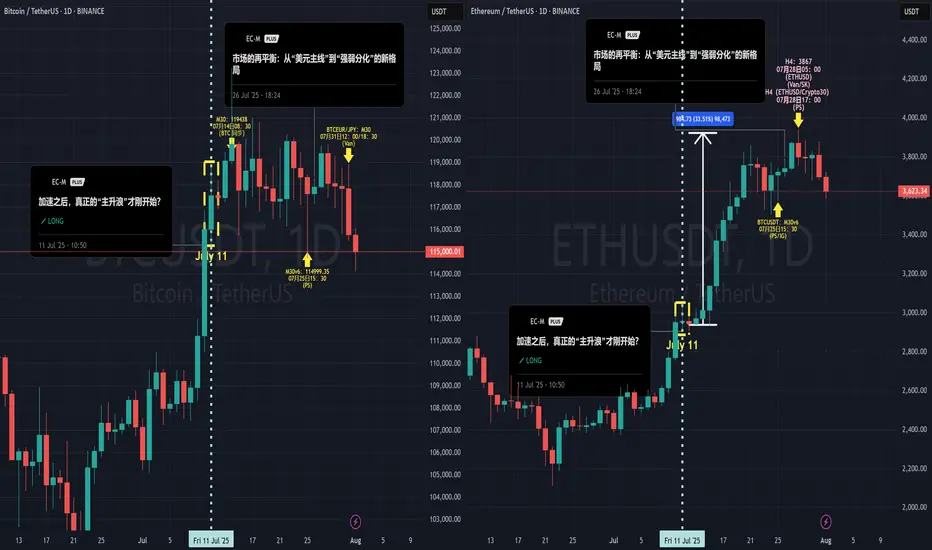
After our call on July 4th that the "main bull wave" was starting, the market perfectly delivered on our expectations. What was more interesting was the clear internal divergence we saw, which precisely confirms our thesis about the "bubble phase" from my June 20th article, "The Restlessness Before the Storm."
When the market's sentiment "balloon" is inflated to its limit, capital flows from the leader (BTC) to assets with higher elasticity (ETH).
The data shows that from July 11th until now, ETH took the baton and rallied approximately 35%, while BTC gained only around 6% in the same period. When BTC is already showing signs of fatigue while ETH is still in a solo rally, that in itself is a major signal that the bubble is nearing its end.
II. A Shift in the Winds: The Hand Inflating the Balloon is Loosening
I've chosen to end this script at this moment based on signal changes on two levels:
The "External Factor" Shift: The Potential Strengthening of the USD
As I pointed out in my July 28th analysis, "The Market's Rebalancing," the market has entered a phase of "strength-weakness divergence." This trend is now becoming more evident: the U.S. Dollar, cushioned by the extreme weakness of currencies like the Japanese Yen, has begun to show signs of a broad strengthening. Concurrently, U.S. and European stock markets are pulling back in sync, and global risk appetite is cooling.
The external environment that fueled the bubble (a weak USD) is beginning to falter.
The "Internal Factor" Signal: The Needle Point Inside the Balloon
The crypto market itself is also showing warning signs of resistance (see attached ETH daily chart). When the leading asset, ETH, begins to show signs of stagnation and distribution at its highs, it's like the balloon meeting the needle point. The exhaustion of internal momentum is a more direct warning than changes in the external environment.
III. Conclusion: Don't Be Greedy for the Last Dessert
When the core logic driving the rally (a weak USD) begins to waver, and the market simultaneously shows internal signs of exhaustion, my choice is to end this script and take profits off the table.
This doesn't mean I think crypto will crash immediately. But "no longer suitable to hold" implies that, in my view, the risk/reward ratio at the current level is no longer attractive. A grand feast is coming to an end, and being greedy for the last dessert is not a wise move. Shifting from "buying the dip" to "cautious observation" is the rational choice.
Thank you for your attention and for following along this past month.
#Crypto #BTC #ETH #TradingView #MarketAnalysis #RiskManagement
$BTCtime to run it back from here little more to go for H4 reclaim then looking for the thick white line to be reclaimed
stop below range low

BTC in a Sideways MovementBTC in a Sideways Movement: When the Market Froze, Psychology Starts to Fail
Honestly, this is one of the most difficult stages in the market - uncertainty without a clear direction. Bitcoin gets stuck between levels, giving false breakouts and immediately rolling back. It seems that something serious is about to happen, but in reality, nothing happens.
This kind of price movement often leads to emotional burnout of traders. Some start entering trades blindly, just to stay in the market. Others suffer a series of small losses, trying to guess the breakout. And some just close the charts, unable to cope with the silence.
The reality is that markets get tired too, especially after big moves. What we are seeing now with BTC is probably just a rebalancing phase. And that's okay. If there is no clear pattern, then this is not your trade.
For now, I am just watching, marking the boundaries of the range and waiting. For myself, I highlight the order block for 1D as zones of interest, I wait for a reaction from it and will look for a model to enter a position.
Any breakthrough, confirmed by volume and subsequent movement - that's when the next real movement will begin.
The main thing is not to waste energy in vain. Sideways movement is not eternal. After silence, movement always comes.