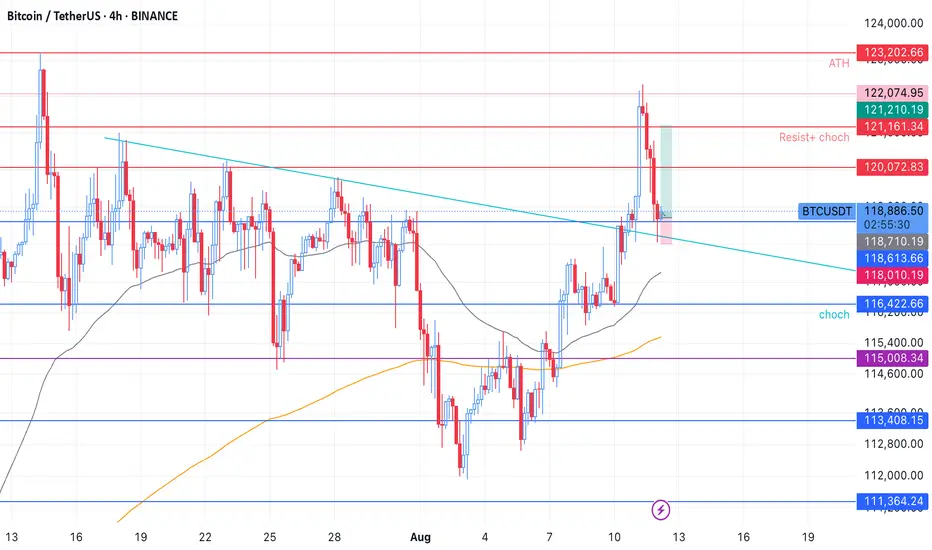
BTCUSDT 4H🔎 Chart Context
• Pair: BTC/USDT
• Exchange: Binance
• Timeframe: 4H (240M)
• Date: 16 August 2025
The chart applies price action, liquidity sweep, demand/supply zones, and FVG (Fair Value Gaps) to forecast market behavior.
📊 Key Observations
1. Major Highs & Lows
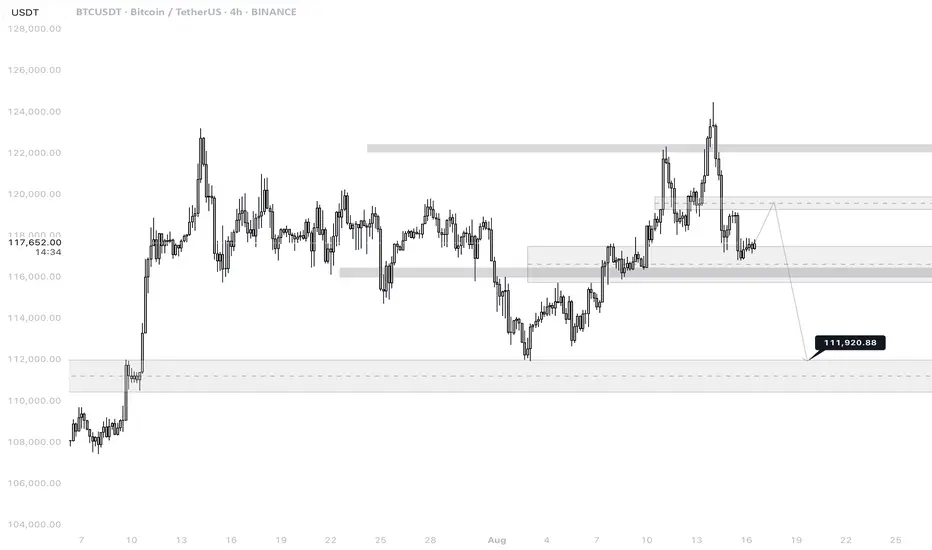
• Recent Highs: 124,474 and 123,218
• Key Resistance: 122,335.16 zone
• Significant Lows: 112,650.00 and 111,920.00 (highlighted as potential liquidity target)
These represent liquidity pools where institutional activity often occurs.
2. Current Price
• Trading around 117,621 – 118,235 zone at the time of charting.
• Price is consolidating after rejection from 124,474 top.
3. Liquidity Structure
• Market swept liquidity above 124,474 and quickly rejected, signaling a potential distribution phase.
• Below, untested liquidity exists near 111,920, which is marked as a probable downside target.
4. FVG & Demand Zones
• A Fair Value Gap (FVG) remains open around 115,200–116,500, which price could retest before further downside.
• Stronger demand lies around 111,920–112,650, likely to act as a magnet if the retracement deepens.
5. Resistance Zones
• 122,335–124,474 is a strong supply block / distribution zone, which caused the sharp rejection.
• Any bullish recovery will need to reclaim 120,247 and 119,800 to sustain upside momentum.
📈 Bullish Case (Less Likely, Countertrend Scenario)
• If BTC holds above 115,200–116,500 FVG zone and forms higher lows:
• First target: 119,800 (minor supply).
• Second target: 122,335 (major resistance).
• Reclaiming this zone could trigger a retest of 124,474.
• However, this requires strong demand and volume, which currently looks weak.
📉 Bearish Case (Higher Probability Scenario)
• After liquidity grab at 124,474, rejection suggests continuation lower.
• Likely retracement path:
• Retest 116,500–115,200 (FVG zone)
• Break below to sweep 112,650
• Final downside liquidity target: 111,920
This scenario aligns with the chart projection arrow pointing toward 111,920.88.
⚡ Trading Plan
• Short Entries (Preferred Play):
• At 119,800–120,247 (supply retest)
• At 122,335 zone (distribution block)
• Target 1: 116,500–115,200 (partial close).
• Target 2: 112,650.
• Target 3: 111,920 (main liquidity sweep).
• Stop-loss: Above 124,474 high.
• Long Setup (Countertrend, Risky):
• Entry at 115,200–116,500 (FVG)
• TP1: 119,800
• TP2: 122,335
• Stop: Below 114,700
USDTBTC trade ideas
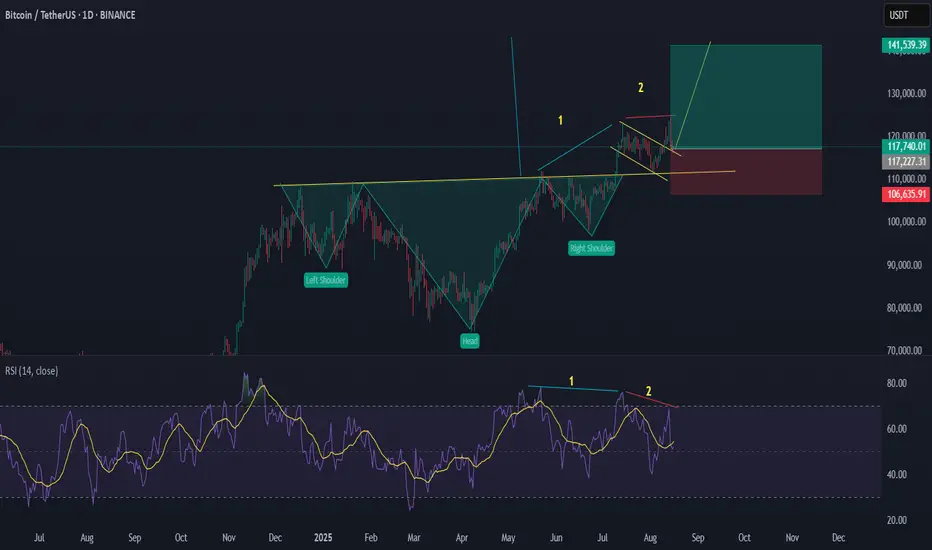
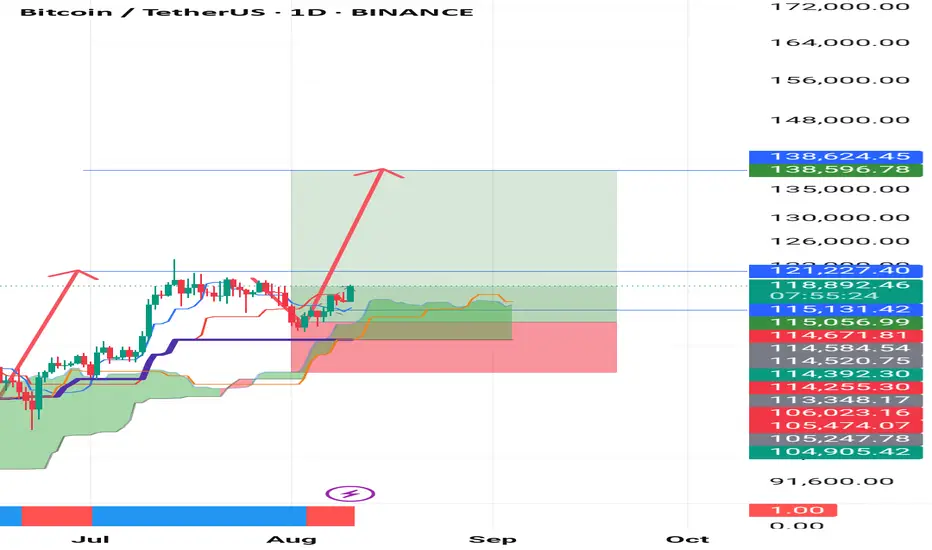
BTCUSDT– Possible Last Wave of the Bull Market?BTC has broken out from a long-term Inverse Head & Shoulders pattern, and despite short-term weakness (RSI divergence), the macro structure remains bullish.
🔍 Supporting Signs:
Breakout above neckline held as support (so far).
The wedge could be a bull flag, not a topping pattern.
Pullback may be a retest before resuming upward momentum.
Target (from H & S) projects price toward $140K–$145K.
🔼 Bullish Targets:
Short-term: $125K
Mid-term: $135K
Full target: $142K–$145K
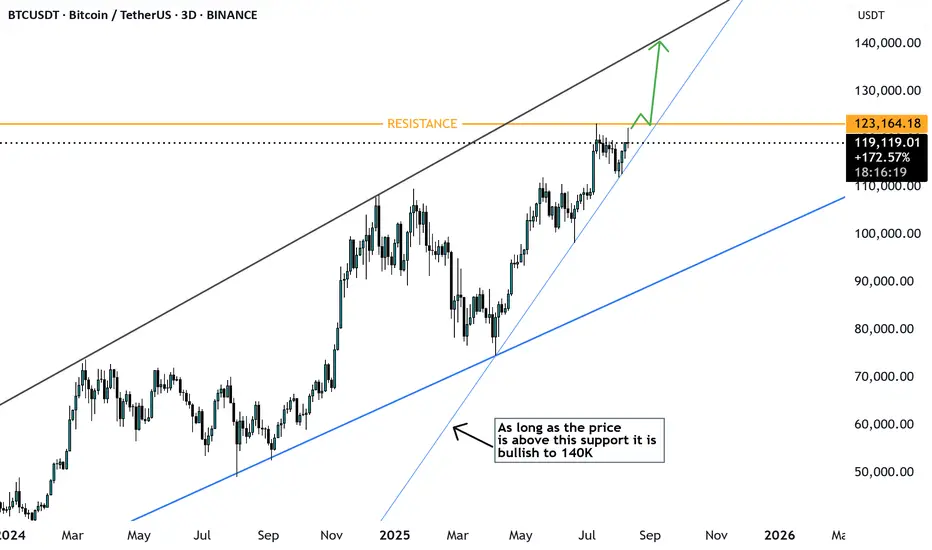
BTCUSD ready for Breakout ? 140K TargetBTCUSD is currently moving within an ascending broad wedge pattern on the 3D chart. Price has reached the resistance area near 123K and is showing a higher probability of breaking above it, targeting the 140K level. The setup remains bullish as long as price holds above the marked sub-trendline.
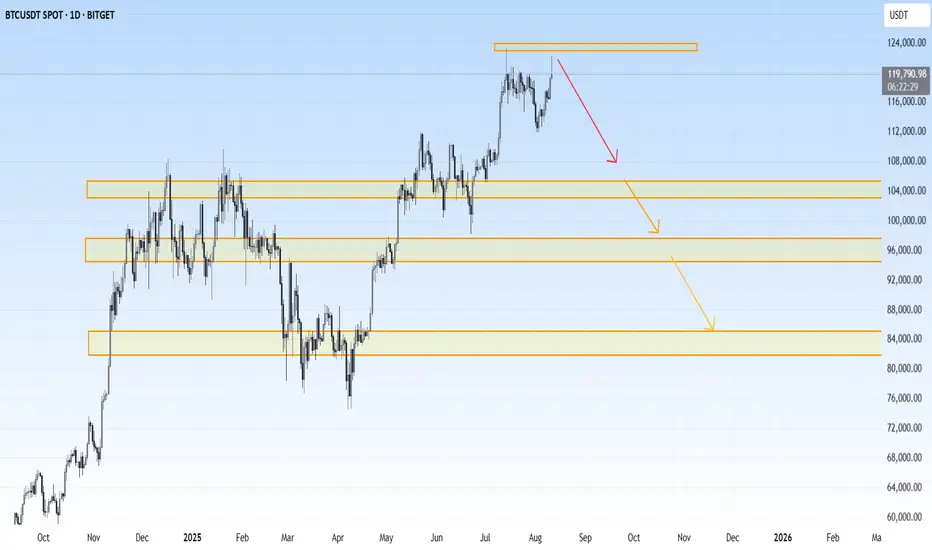
BTCUSDT-local correction is expectedExpecting local correction on BTC, as the price didn't manage to fix above 123000. Main target is around 103-105. In case of the deeper correction - next targets are mentioned on chart.
Invalidation will occur when price will fix above 123000 at least with one full candle.
BitcoinMy previous path was correct, now let's see if this is the right path to show me what I'm doing next.
Bitcoin Possible SenarioIt seems that the bullish trend is weakened. The RSI shows divergence both in weekly and daily timeframes. Buyers needs to be careful at 110K level. Break under 110K can bring sellers into the game!
It's to be apart of the trading revolutionthe AI I've built from scratch has predicted the market moves 6 weeks in advance
this level of accuracy is mind melting...
So many people have lost in this game, not only are we winning, I'm revolutionize it.
Reach out to me if you have any questions

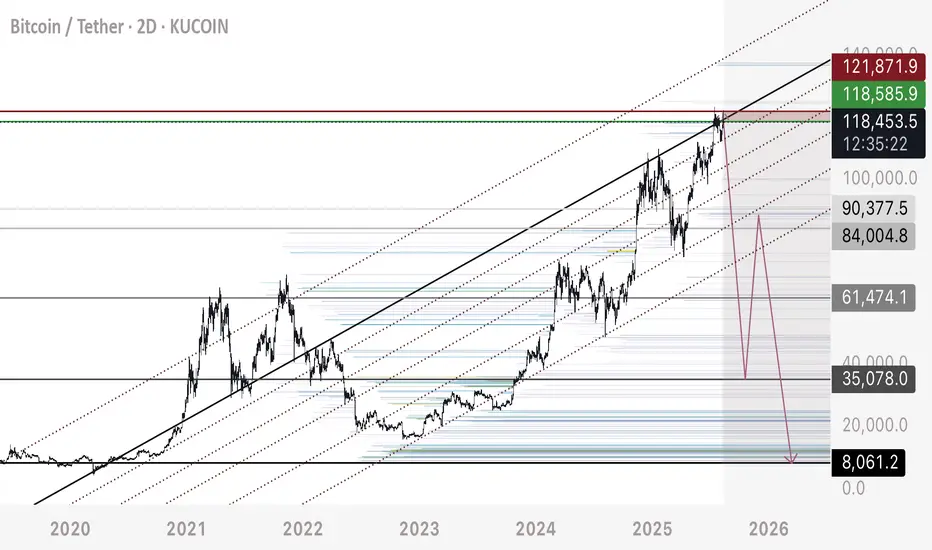
BTC - Short Update Part 2This chart shows the ascending parallel channel that supports 7,000-8,000 ultimate bottom - layered with BITCOIN ONLY liquidity zones on the multi day time frame.
The majority or liquidity in the chart is long position stop losses - leveraged sell orders.
Bitcoin has been moving straight up, consolidating sideways, straight up, consolidating sideways since End 2022.
This tells us the market is collecting long position stop losses and leaving them in tact IE not allowing price to fully drop and start triggering off the cascading chain reaction of sells that is a natural phenomenon.
Happy Trading.
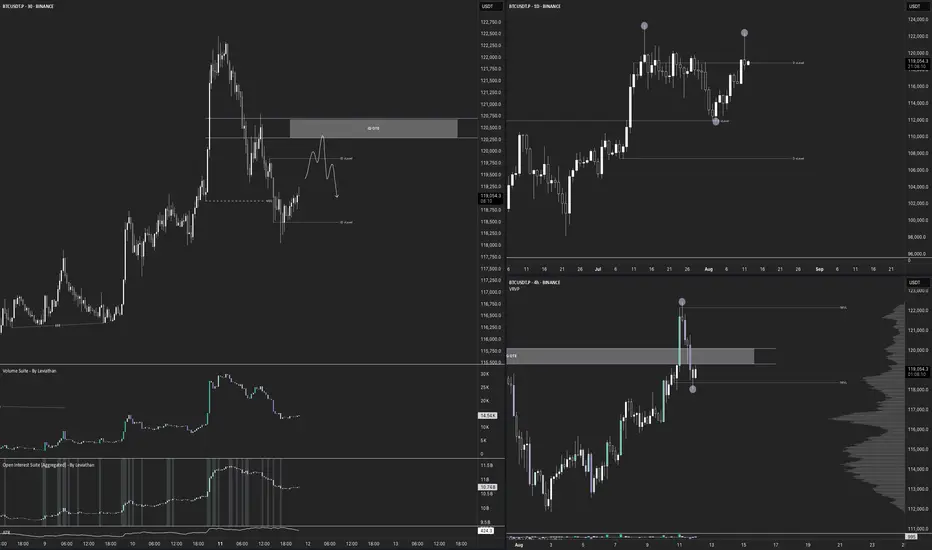
$BTC Macro OutlookWeekly Chart
BTC is still trading inside the macro range at $111,959.5–$119,655.0. Last week closed green but as an inside bar, which signals indecision. We also printed a failed auction above the prior higher-high vLevel—hinting at trend fatigue and the risk of a deeper pullback.
As long as price holds $111,959.5, the broader bullish structure is intact. A weekly close below $111,959.5 would likely open room toward the next vLevel near $98,115.4. Until this range resolves, expect two-sided trade and respect the extremes.
Daily Chart
Today’s candle closed as a shooting star (bearish pin bar) with elevated Relative Volume (RVOL), a classic reversal signal at resistance. On the Footprint, delta finished negative and, more importantly, VAH, VAL, and the POC all sit inside the upper wick, which tells us most of the trading occurred near the highs. That’s typical of late longs getting trapped.
With the daily trend pointing lower, the base case is a rotation toward the $111,910 vLevel. Until conditions change, treat bounces as opportunities to stay aligned with the bearish daily momentum.
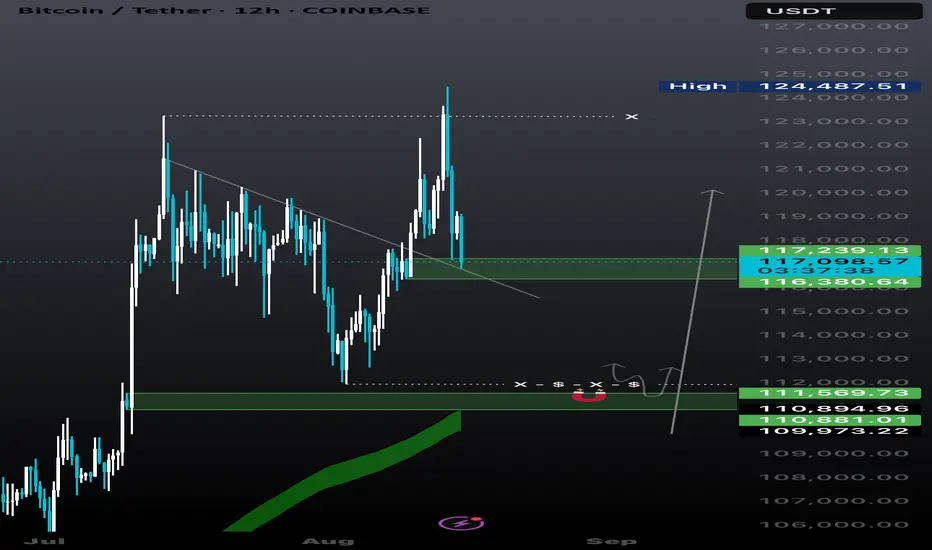
12-Hour Chart
Structure is still bullish, but this push looks more like a liquidity sweep above the prior range highs, right where most short stops sit; than true initiative buying. If we fail to gain acceptance above the breakout and rotate back inside the range with sell-delta/absorption at the highs, I’ll treat it as a failed auction and look for rotation back toward the range low.
4-Hour Chart
After a clean macro Over/Under, the 4-hour has rotated back into the SWING OTE zone, exactly where I want to be stalking shorts. Despite the 4H still reading structurally bullish, price is boxed inside $118 395.8–$122 165.4 and keeps showing responsive selling into the upper range. For a swing short, the key now is the 30-minute: Invalidation is acceptance above $122 165.4; below that, the short idea stays in play. We’ll break down the 30-min setup next.
30-Minute Chart
The 30-minute is flashing a clean spike in both CVD and Open Interest, fresh longs chased the intraday pump. Best case from here is a full fade of that impulse, turning late buyers into exit fuel. Leverage looks elevated, so a liquidity flush is very much on the table if price can’t hold acceptance above the spike. I’m placing limit shorts inside the intraday OTE zone with my stop just above 122 165.4.
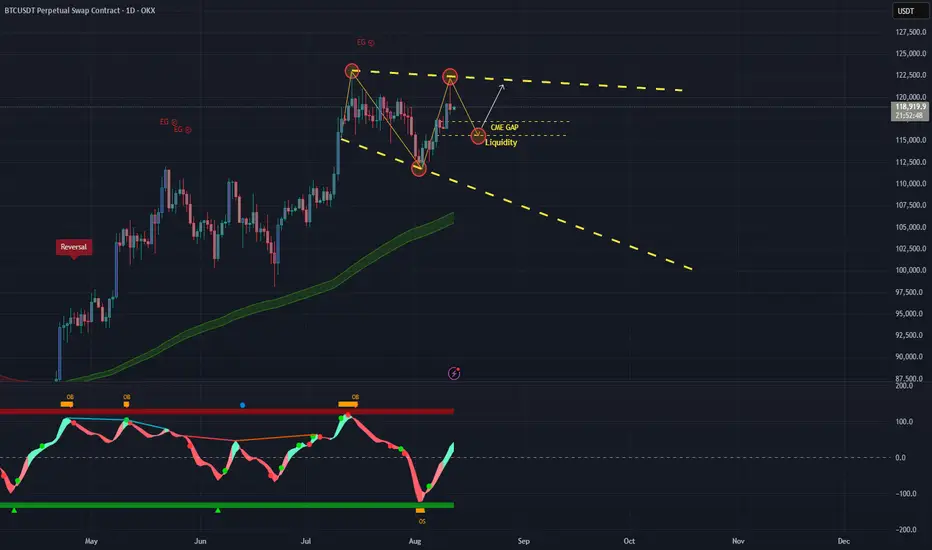
BTCUSDT – Eyeing Liquidity & Channel Resistance BTC has rebounded strongly from the lower boundary of the descending channel, supported by a recovery in momentum indicators from oversold territory. This move has pushed price toward the upper trendline resistance, with bullish momentum eyeing key liquidity levels.
A CME gap lies just ahead, acting as a potential magnet for price action. The immediate long target sits at $115,450, aligning with the identified liquidity zone and serving as the first area of interest for partial profit-taking. Sustained bullish pressure could lead to a test of the upper channel resistance near $121,400.
However, traders should monitor price reaction closely — a rejection from resistance could trigger a retracement toward mid-channel support or even back to the lower boundary around $108,000.
Key levels to watch:
Long Target: $115,450 (Liquidity zone)
Resistance: ~$121,400 (Upper channel boundary)
Lower Support: ~$108,000 (Channel base)
📊 Bias: Short-term bullish toward $115,450, but still trading within a larger corrective structure. Reaction at $121,400 will be critical for the next trend leg.
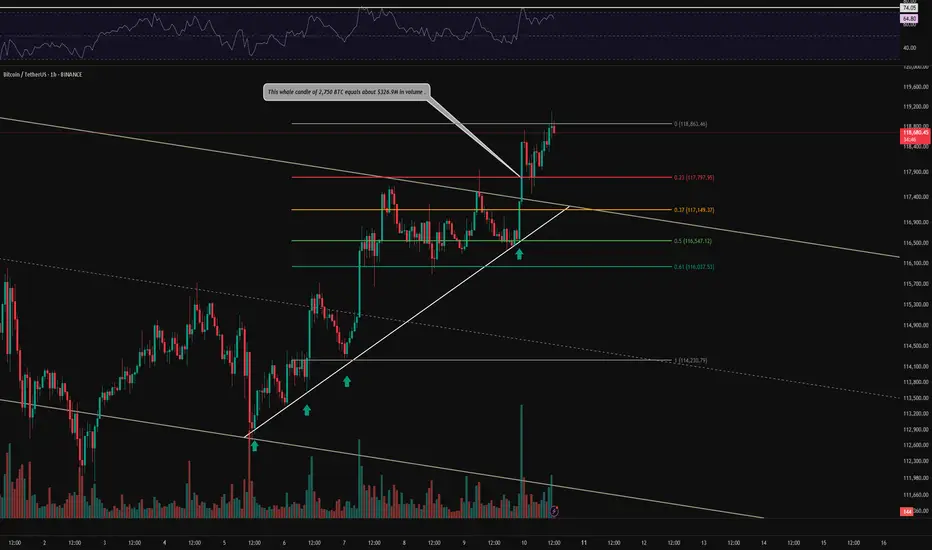
BTC 1H Analysis – Key Triggers Ahead | Day 7💀 Hey , how's it going ? Come over here — Satoshi got something for you !
⏰ We’re analyzing BTC on the 1-hour timeframe .
👀 After breaking out of its descending channel, Bitcoin is moving upward with a high-volume whale candle.
🕯 The trading volume and number of trades are rising sharply, and this volume increase during the New York session could lead to Bitcoin forming a new high.
⚙️ Our key RSI level is 74.05. If this level breaks, the volatility of Bitcoin’s long positions could increase significantly, potentially triggering a price surge.
🎮 After breaking the 0 Fibonacci level and pulling back to it, we can open our positions in line with the market structure change and move with the market.
🔒 An upward-sloping trendline has been drawn from the channel’s bottom to the top, and on the fourth reaction to it, Bitcoin bounced and beautifully broke through the channel’s top.
🔔 There’s no specific alert zone unless the current market structure changes, in which case an alert zone will be provided.
🖥 Summary: Bitcoin is moving upward, our long position trigger has been activated, and if the current structure is maintained, it could continue toward higher price levels.
📊 If USDT.D drops below 4.20% BTC might push toward higher targets .
❤️ Disclaimer : This analysis is purely based on my personal opinion and I only trade if the stated triggers are activated .
Long_BTC, TF: 4Hthis Long position gets in when condition have fallen in places.
first it has almost the all time high, but it got bounced back to retest to strong demand zone.
Also, it has been retest the important 4H trend line.
*** Risk consideration ***
Risk per Reward is about 2x
SL 1000 points TP 2500 points
if hit first TP then just tailing stop less as you wish.
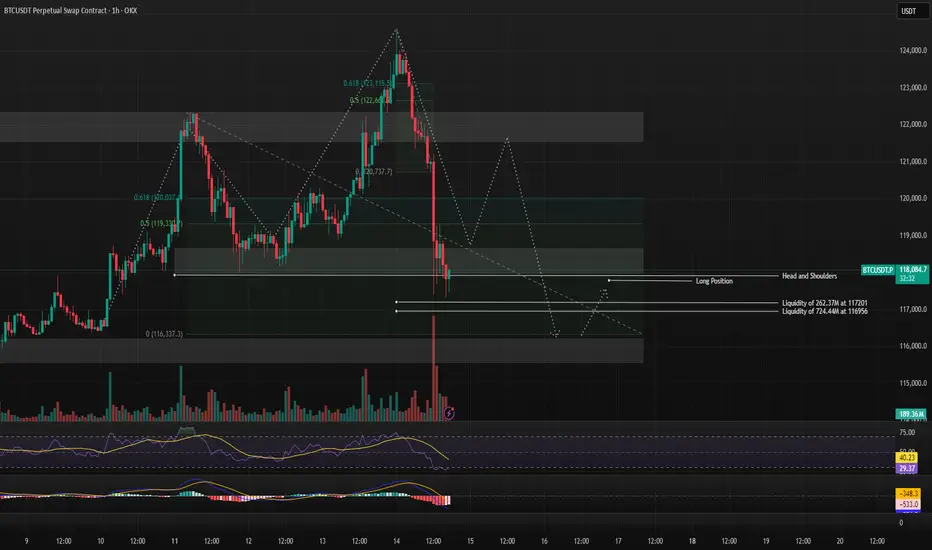
Liquidity Grab Long Setup with Fib Rejection and Head & ShoulderThought Process:
- Identify rejection at 0.618 Fib as a potential trend reversal signal.
- Map out major liquidity pools where stop-loss clusters are likely.
- Expect market makers to push price into these pools to collect liquidity.
- Plan a long entry immediately after liquidity grab for a possible bounce.
- Watch for bounce to align with right shoulder completion in Head & Shoulders pattern.
- Use neckline as the main resistance and decision point for next move.
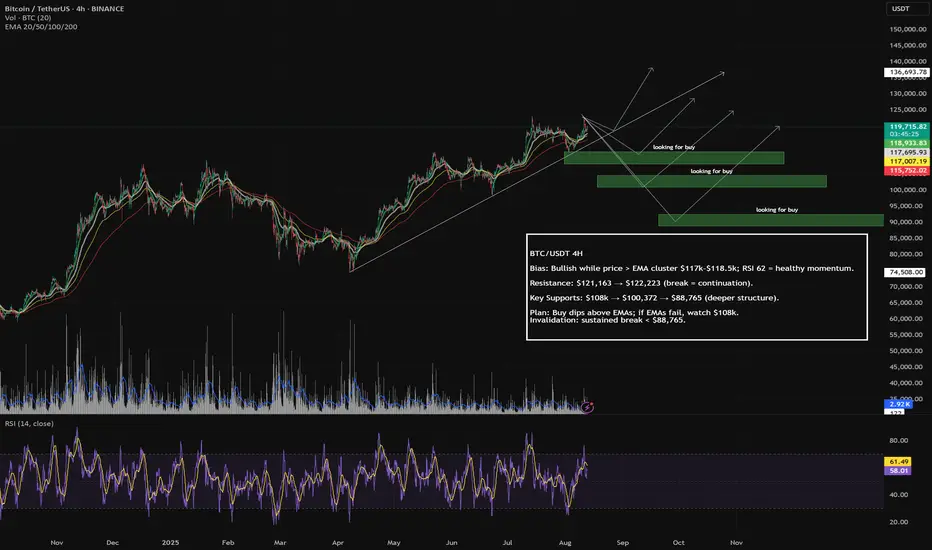
BTC/USDT 4H: Bullish Above EMAs — Watch $108k/$100k/$88k SupportTechnical Breakdown
Trend & Price Action: The overall trend remains bullish. The price is currently holding strong above the primary EMA cluster after a significant run-up, indicating buyer control.
Immediate Dynamic Support: The cluster of EMAs around $117,000 - $118,500 serves as the most immediate, dynamic support zone. The price holding above this area is critical for short-term bullish momentum.
RSI: The RSI at 62.15 confirms healthy bullish momentum with room to move higher before reaching overbought conditions.
Key Levels to Watch
Horizontal Support Zones:
These levels are critical as they represent previous areas of resistance and consolidation that have now likely flipped to support.
Support 1: ~$110,000: This level acted as a ceiling in late June and is the first major horizontal support to watch during a pullback.
Support 2: ~$100,372: This was a key consolidation zone in early June.
Support 3: ~$88,765: This is a major structural level, acting as a peak in April and providing support in late May. It represents the most significant of the three drawn support lines.
Resistance:
The upside targets remain the recent highs, identified by the indicator as:
$121,163
$122,223
Potential Scenarios
Bullish Continuation: The price remains above the EMA cluster and pushes through the $122,223 resistance. This would signal a strong continuation of the uptrend.
Corrective Pullback: If the price breaks down through the immediate EMA support, the market will look for a reaction at the key horizontal levels.
A minor correction would find support near $108,000.
A deeper correction would target $100,372, and in a major bearish shift, the crucial support at $88,765 would be the last line of defense for the current market structure.
Conclusion: The short-term outlook is bullish while the price stays above the EMAs. However, the support lines at $108k, $100k, and $88k are the most important levels to watch to gauge the severity of any potential pullback and the overall health of the uptrend.
What I Expect From BitcoinBeginning of August, I mentioned I expect Bitcoin to get to $109k level before deciding to create a massive ATH again.
Bitcoin retested the previous ATH few days ago and is heading down again due to U.S PPI data released on Thursday.
I'm still watching price would get to $111.5k level before we have that massive ATH if it doesn't go beyond the resistance level at $120k
Currently, have a trade running on lower timeframe targeting resistance.
What's do expect to happen bitcoin?
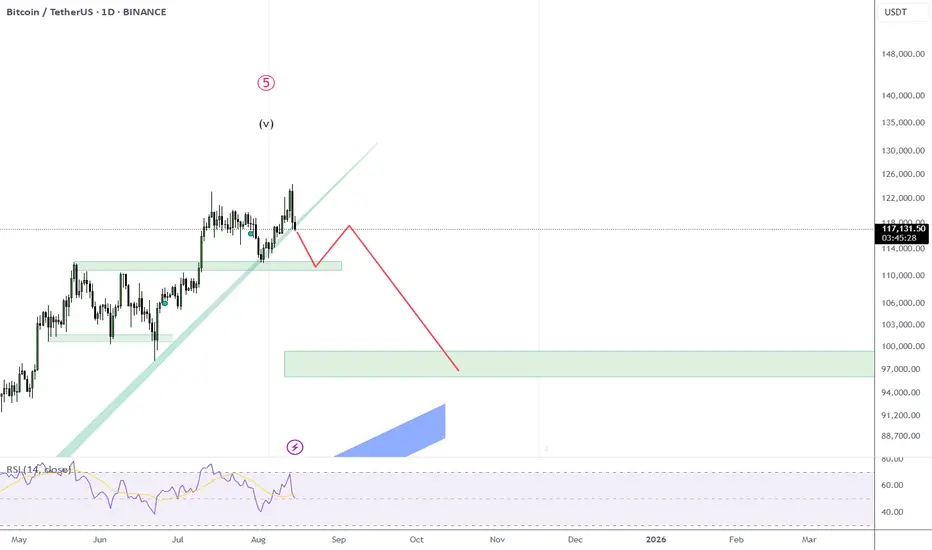
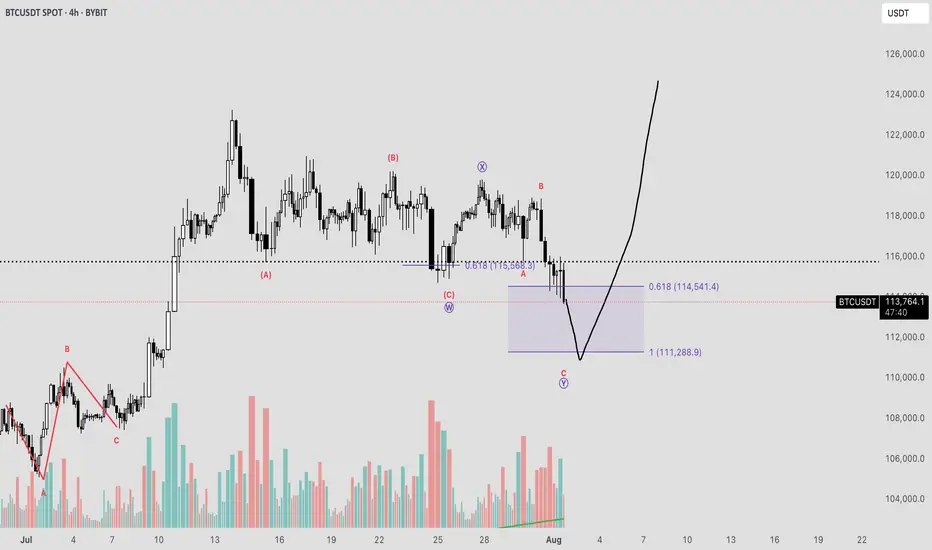
BTC Double Combo CorrectionFollowing a failure to maintain support at several critical technical levels, Bitcoin now appears vulnerable to a potential decline toward the ~$111,000 region. This projection is derived from an Elliott Wave corrective structure identified as a WXY Double Combination. The initial leg of the pattern features an ABC correction terminating near the 0.618 Fibonacci extension, thereby establishing the W pivot. This is succeeded by the X pivot, followed by a sharp, impulsive decline forming the Y wave.
By applying a trend-based Fibonacci extension across the W, X, and Y pivots, we can estimate the probable termination point of the corrective sequence—typically extending into the 1.0 to 1.1 Fibonacci range.
This move is anticipated to unfold over the weekend, potentially presenting a strategic buying opportunity, contingent on a favorable reaction at the projected low. Sunday evening may offer optimal conditions for entry, as traditional market participants—limited to weekday trading—could miss the initial dip, subsequently being compelled to re-enter at elevated price levels.
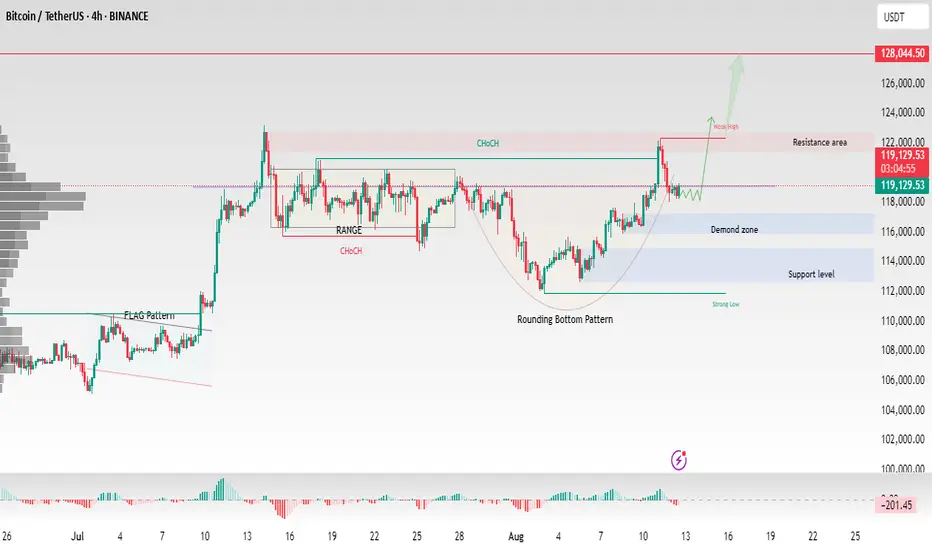
"BTCUSDT – Rounding Bottom Breakout with Demand Zone Support"Bitcoin is forming a strong rounding bottom pattern on the 4H chart, indicating a potential bullish continuation. Price has broken above the range and is now retesting near the demand zone at 118,000 – 116,000 USDT. If buyers hold this level, the next target sits near the weak high at 122,000 and potentially the major resistance at 128,000 USDT.
Key levels to watch:
Support: 114,000 – 116,000 USDT (demand zone)
Resistance: 122,000 and 128,000 USDT
Pattern: Rounding Bottom, bullish structure after ChoCH confirmation.
This is a technical analysis idea, not financial advice. Please manage risk accordingly
BITCOINBITCOIN, My hunter mindset strategy wont allow me to give a buy or sell position at the moment, allow the price to give a clear breakout out otherwise you will be caught in a bad trade.
we have conflicting signals ,we have buy and sell signal without confirmations, the strategy is based on risk to reward ratio and the probability of buy back is poor after the selloff from the supply roof which could put long position in danger.
and if you try to sell ,the price action is resting on daily support floor of the descending daily trendline breakout which gave birth to the current all time high.
ALLOW THE MARKET TO GIVE A DIRECTION.
NO TRADE FOR NOW.
HUNTER MINDSET
GOOD LUCK

BTCUSDT Analysis
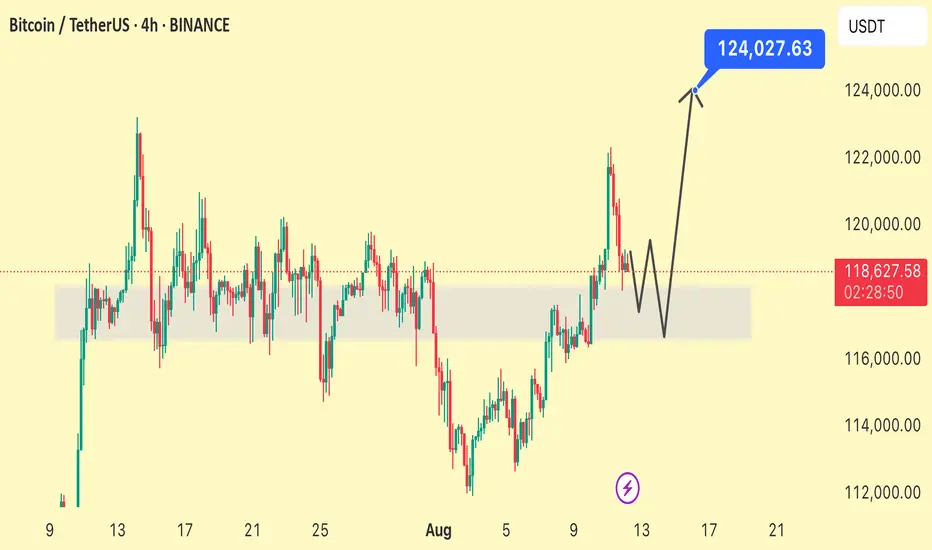
BTCUSDT From our previous analysis, BTC initially showed signs of a potential decline, but after holding a long-term support level, it has now pushed toward the 124K resistance. In the short term, a pullback is expected to retest the green support zone before continuing its upward movement.
BTC’s strength is supported by rising demand as an inflation hedge, which could maintain bullish momentum in the coming sessions.
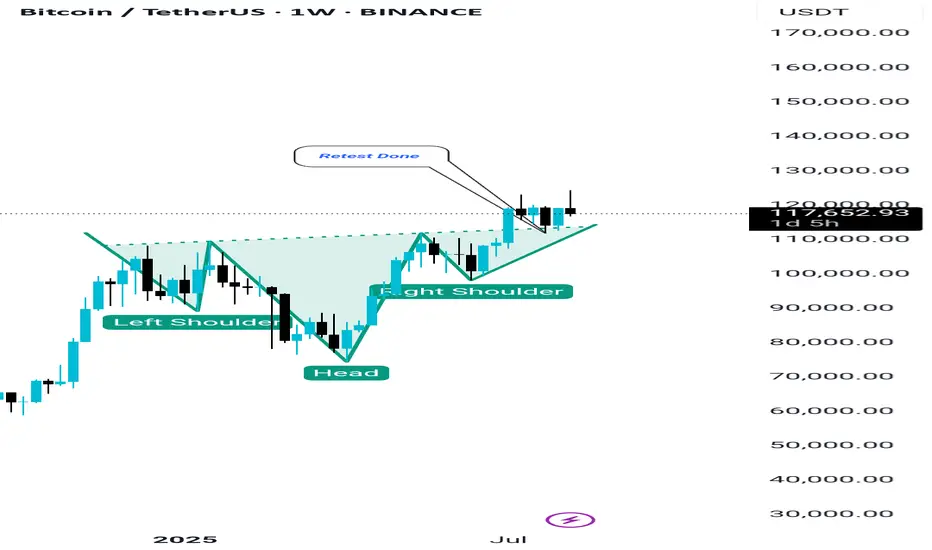
MASSIVE!!! Inverse Head and Shoulder Don't ignore this Bullish Head and Shoulder Pattern on Btc weekly Time Frame
For those who are worried that Bitcoin might have already topped, let me explain. This is actually an inverse head and shoulders pattern, which is a bullish setup. The neckline has already been retested, and from here the upward journey begins. The target ranges between $140K to $150K and it can even go higher. So there’s no need to panic—study the patterns, stay calm, and remember this market isn’t made for the weak.
BTC - TOP CYCLE 2025key zones of price & time to watch.
every sign of an accumulation or distribution in those zones would trigger the alert.

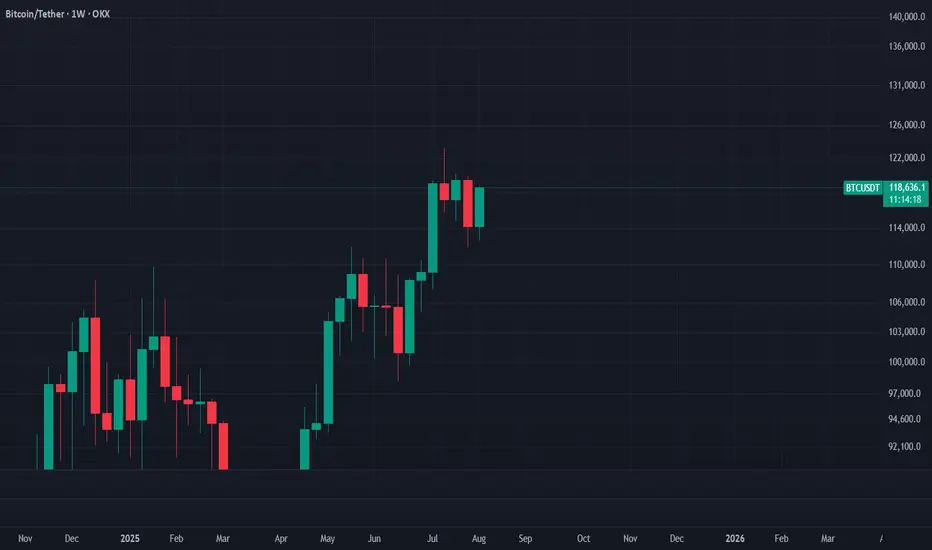
Bitcoin Readies for a $120K Breakout — Watch the Weekly Candle
OKX:BTCUSDT
Summary
If Bitcoin’s weekly candle engulfs the previous one, we can expect an explosive breakout.
Instrument / Timeframe
BTCUSDT, 1W
Scenario
If this week’s candle fully engulfs the prior week, the next week can start decisively bullish and push into fresh highs. For now, we won’t set fixed upside targets; let price discover. Once the market prints a clear resistance at the new peak, we’ll treat that level as Bitcoin’s new ceiling.
Trade Plan (example, not advice)
For long-term buyers who practice sound risk and capital management, a confirmed daily break and close above $120,000 can serve as an entry trigger.
Disclaimer
This is market commentary and reflects my personal opinion. It is not investment advice, a recommendation, or a solicitation to buy or sell any asset. Crypto markets are highly volatile and you can lose part or all of your capital. Always conduct your own research, make independent decisions, and use strict risk management (position sizing, stop-losses, scenario planning). Past performance is not indicative of future results. For guidance tailored to your situation, consult a licensed financial advisor.
#Bitcoin #BTC #BTCUSD #BTCUSDT #Crypto #Breakout #PriceAction #Engulfing #Candlestick #SupportResistance #MarketStructure #Momentum #RiskManagement #PsychologicalLevel #WeeklyClose
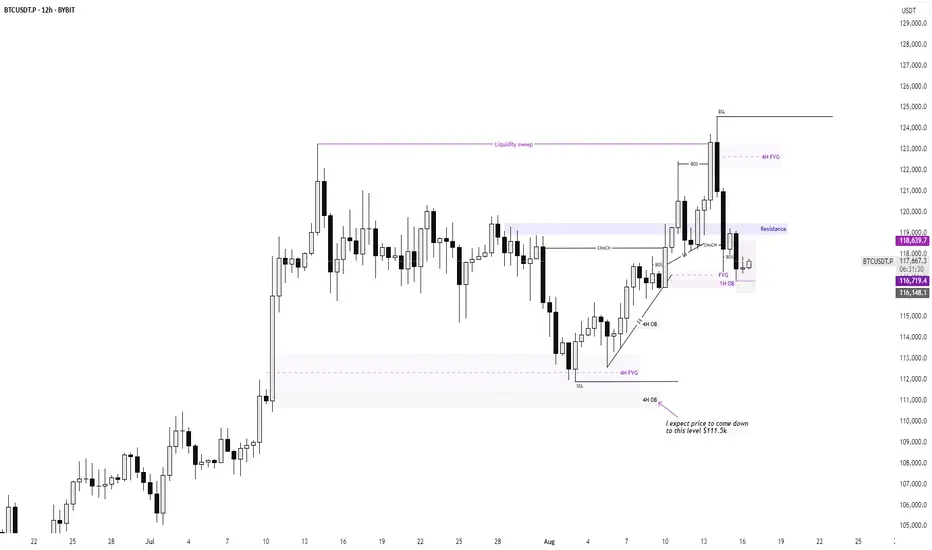
BTC Spot Buy Idea - Clean Execution Plan! This is the 12 hour BTC chart and Alhamdulillah BTC is moving exactly as I expected recent move was predicted if you don’t believe me check my last live YT stream.
Now for the analysis: BTC is trading in demand marked zone as long as it stays above this zone it can still pump. But if 12-hour candle closes below it then look at marked magnet zone below that is very important key zone. If that happens BTC will likely move straight to it.
I’ve been waiting for that level for a long time so watch closely 110k level is magnet level.