BTC CAN HIT 125K AFTER SHORT CORRECTIONHello friends, Bitcoin has made an incredible climb, carefully looking at the chart and also based on Elliott wave theory, it is clear that Bitcoin is completing submicro wave 4 of micro wave 5, wave 4 is usually an extended wave that covers a large time period with up and down fluctuations, I think the end of submicro wave 4 will be in the 110k-112k range in the four-hour timeframe. I think Bitcoin will break the 25k range in the coming days.
USDTBTC trade ideas

BTC Next Move Toward $150K?Bitcoin recently broke out above a long-standing resistance zone ($110K–$115K), supported by a clean move through the volume profile high node. After testing local highs, BTC is now pulling back to retest the breakout area, a critical level that could act as new support.
Key Points:
Breakout Retest: Price has pulled back into the breakout zone around $114K, aligning with strong previous resistance that may now flip to support.
Volume Profile: A strong high-volume node is visible below ($105K–$110K), which reinforces this area as a major demand zone.
EMA Confluence: The 50-day and 100-day EMAs are trending upward and aligning near the retest area, providing additional support.
If this level holds, BTC could resume its bullish leg toward the $150K level.
Cheers
Hexa

BTC: in a new drop?!Hello guys!
btc is running in a descending channel!
However, the upper level is broken up, but it could reach the upper level after a drop here!
I am not sure about this analysis!
What do you think about it?
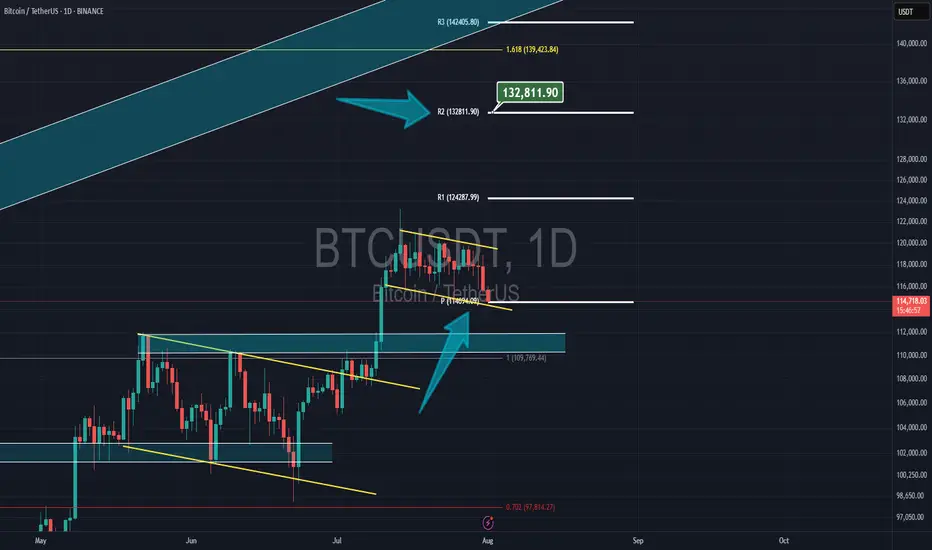
Bitcoin & NEW monthly PivotBitcoin had a correction yesterday but now its still above the new monthly pivot at $14,700 and my target is the 2nd resistance of the pivot at $132,800
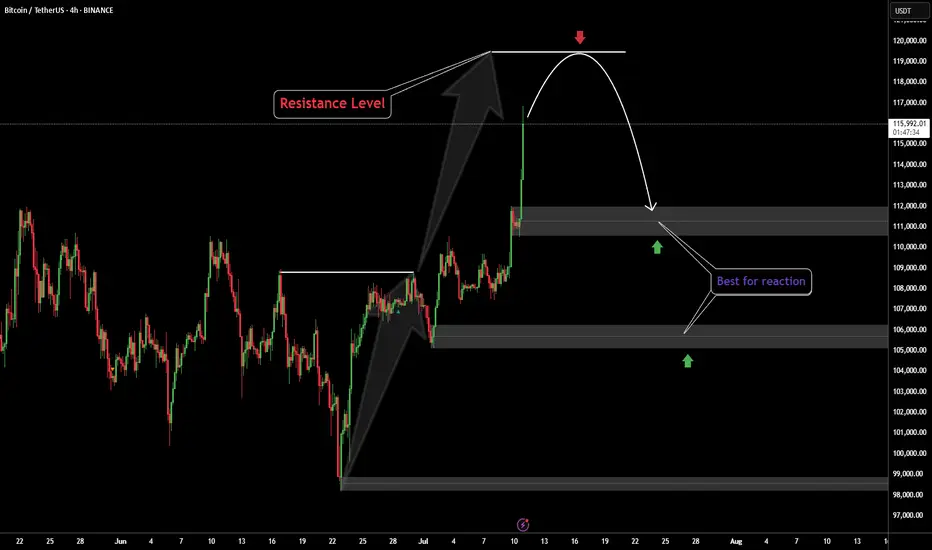
Bitcoin ATHBINANCE:BTCUSDT This is amazing for crypto community because this level-up all of lover crypto currencies.
Next target: 120.000K
Best for pollback levels: 111.000K & 105.500K
👓We are this time keep calms emotional in buy or sell.
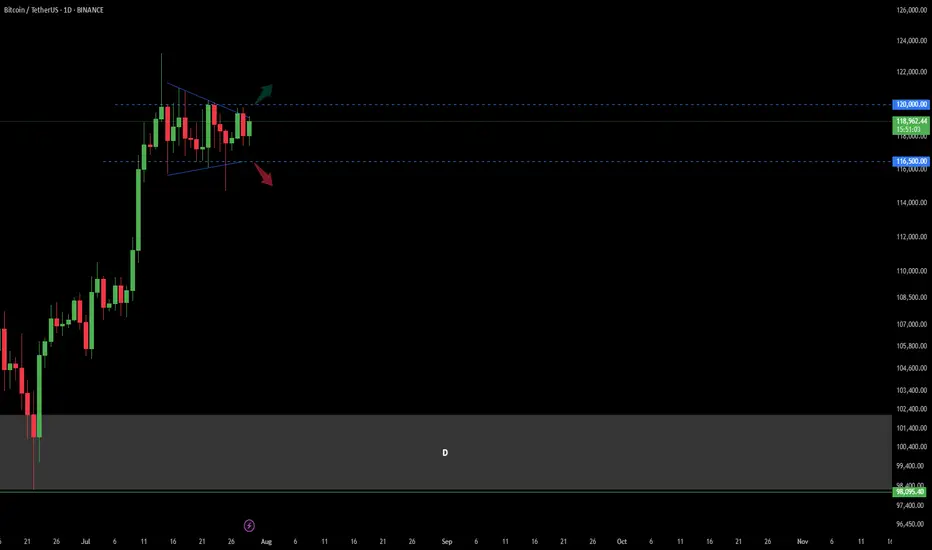
Bitcoin Trend Analaysis UP or DOWN?!Price capped in a wedge in Daily time frame.
There was a fake break from the bottom of this wedge last week and sharply got back to the top of it!
Now : break and confirm above 120 K in Daily would make the market BULLISH
break and confirm under 116.5 K in Daily would make the market BEARISH.
other wise market is still in a range mode...
BTCUSDT: Trend in daily time frameThe color levels are very accurate levels of support and resistance in different time frames.
A strong move requires a correction to major support and we have to wait for their reaction in these areas.
So, Please pay special attention to the very accurate trend, colored levels, and you must know that SETUP is very sensitive.
BEST,
MT
#BTC Update #13 – Aug 01, 2025#BTC Update #13 – Aug 01, 2025
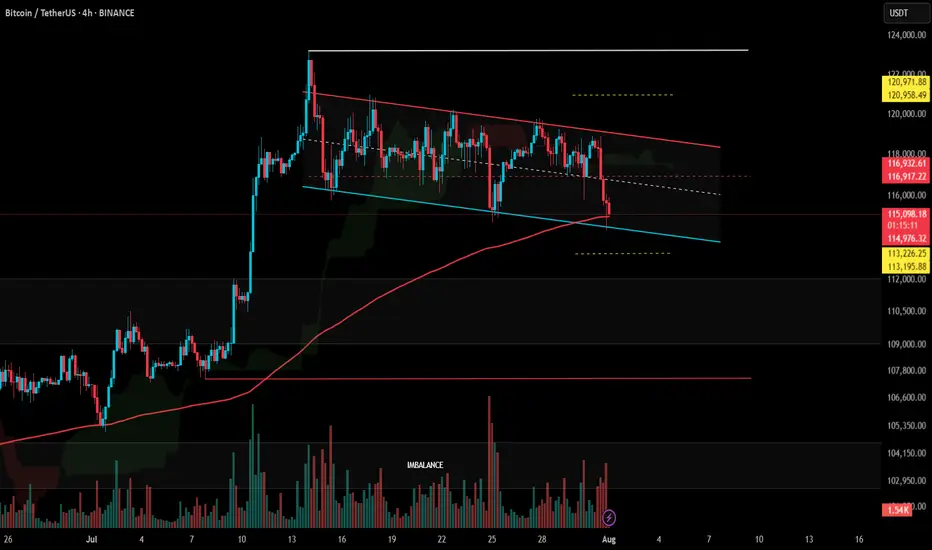
Bitcoin has approached the lower edge of its current channel and received a reaction from there. However, in the current timeframe, the ongoing candle seems willing to pull back again. The MA200 band held the previous candle well, which also represented the bottom of the current channel. There is high liquidity between the $113,200 and $121,000 zones. I believe Bitcoin will continue to move by sweeping through this region. Therefore, I think Bitcoin’s current target is to reach around the $118,000 level with a 3% push move.
If Bitcoin does not make this move and chooses to pull back instead, it may go as far as filling the imbalance at the $110,000 level. The last impulsive move was made around 20 days ago, and since then, the chart has been progressing with a correction of a correction. As long as there’s no close below $107,500, the uptrend will remain intact in the long term. However, if the $107,500 level is broken with a strong candle, we can say that Bitcoin has turned bearish on the 4-hour timeframe. For now, this doesn’t seem very likely. I believe Bitcoin’s next move will target the $118,000 region, continuing to clear out the liquidity accumulating in the upper ranges. However, this channel will need to break at some point.
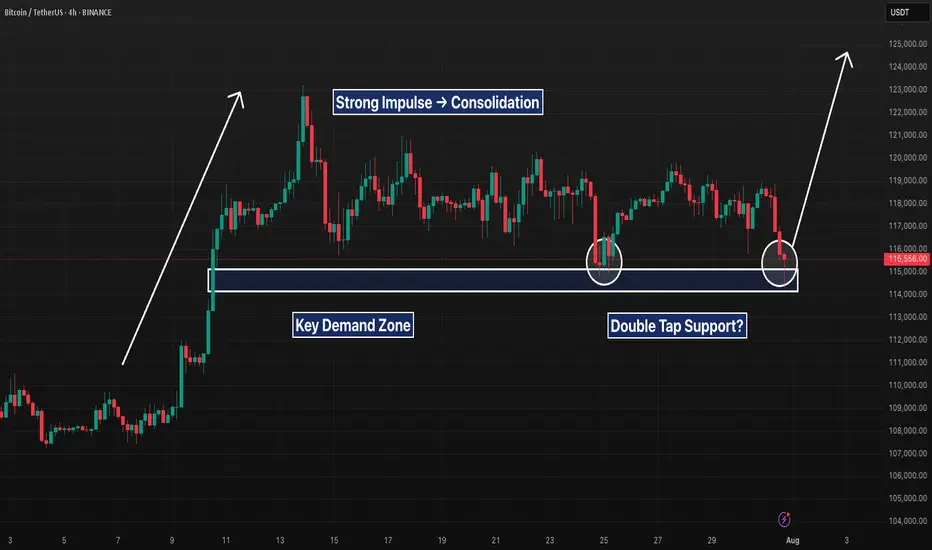
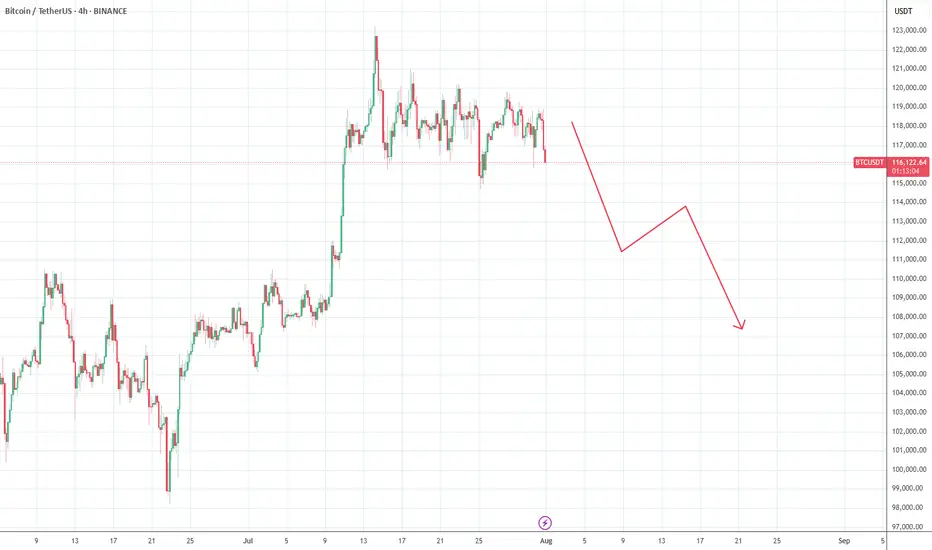
BTC 4H – Support Tapped 2x After Breakout, Will Bulls Step In?Bitcoin is retesting a major demand zone that launched the last breakout. After a sharp impulse move, price has ranged tightly and just tapped this support area for the second time.
A clear double bottom attempt is forming, but failure to hold $115K could open the door to deeper downside. Bulls want to see a quick reclaim of $117K to confirm structure still holds.
Clean levels. Clear reaction zones. Let’s see who takes control.
BTC defies expectations –Absorbs 9 billion USD, aiming for 130K?BTCUSDT maintains its bullish momentum despite Galaxy Digital offloading 80,000 BTC (worth ~9 billion USD). Price only saw a slight dip before bouncing back quickly, signaling strong demand and a more mature market sentiment.
Citi analysts point to ETF inflows and retail participation as the primary drivers of BTC’s rally, even as investors remain cautious ahead of the Fed’s rate decision.
On the daily chart, BTC continues to trade within an ascending channel, with the 116,200 zone acting as a potential buy area on any pullback. The next target is set at 129,500 USDT, aligning with the channel’s upper boundary and technical resistance.
Suggested strategy: Look to buy near 116,200–117,000. Target 129,500. Stop-loss below 115,000.
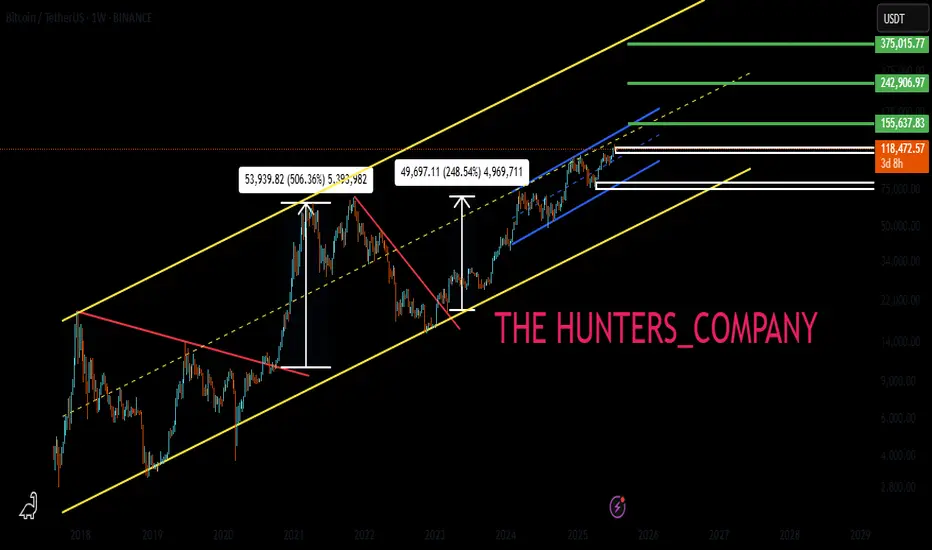
This is why I firmly believe we'll witness BTC reach 150K soon.No caption needed and every reasons are kept in the chart. Zoom In and analyze every single lines in the chart and hope you will see what I tend to see as far as my capabilities allows me. Let me know your comments on the idea. I am looking forward to witness $150K in the next 3 to 4 months time. I will be updating my confluences to say this on higher timeframes too.
With Regards. And stay Tuned.
Big Decision Point for BTCThis is a big decision point. If BTC can hold at or above yesterday's low at 115700, then its to the MOON from here. Otherwise... its not gonna be pretty for any and all altcoin hodlers.
HOLD THE LINE BULLS!!

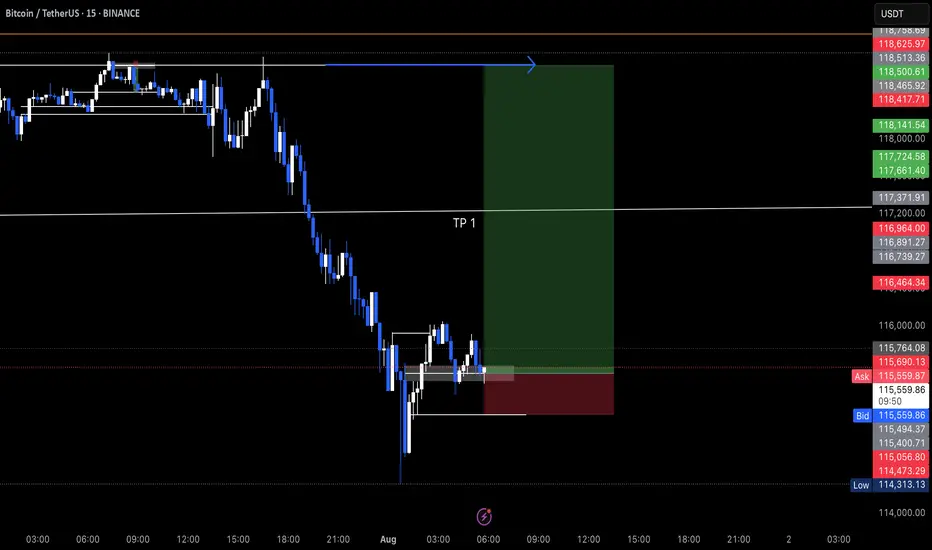
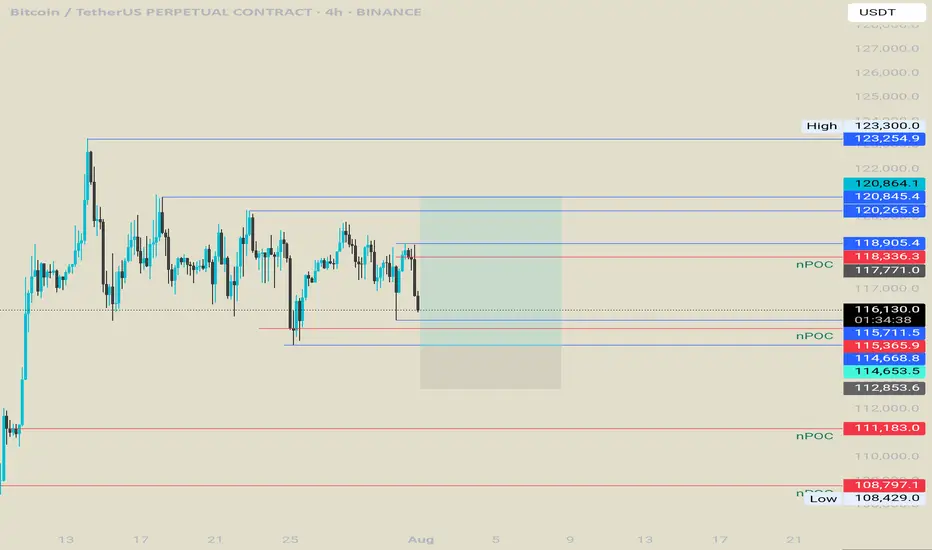
Bitcoin long from 114kWaiting for that npoc level to hit.
After that there is a 4h low , manipulate it , and we will try to catch a reversal.
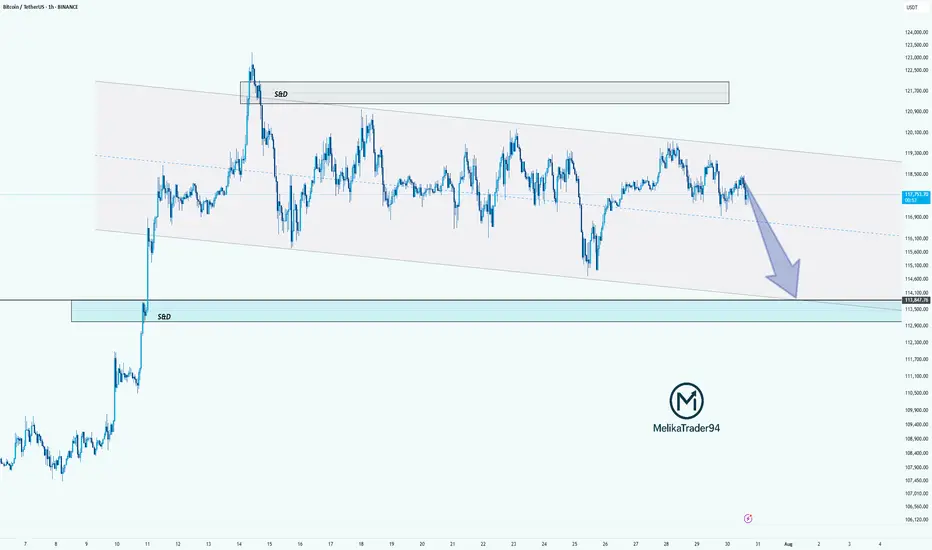
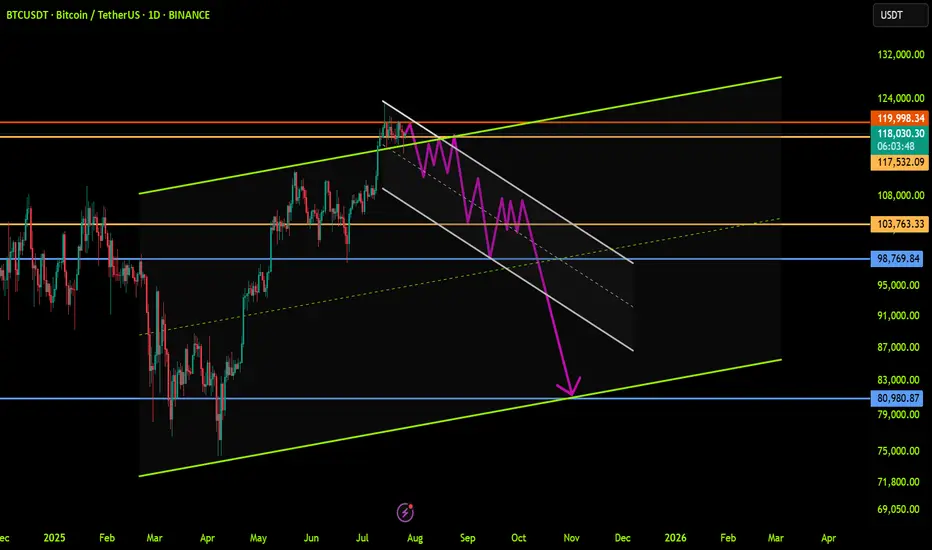
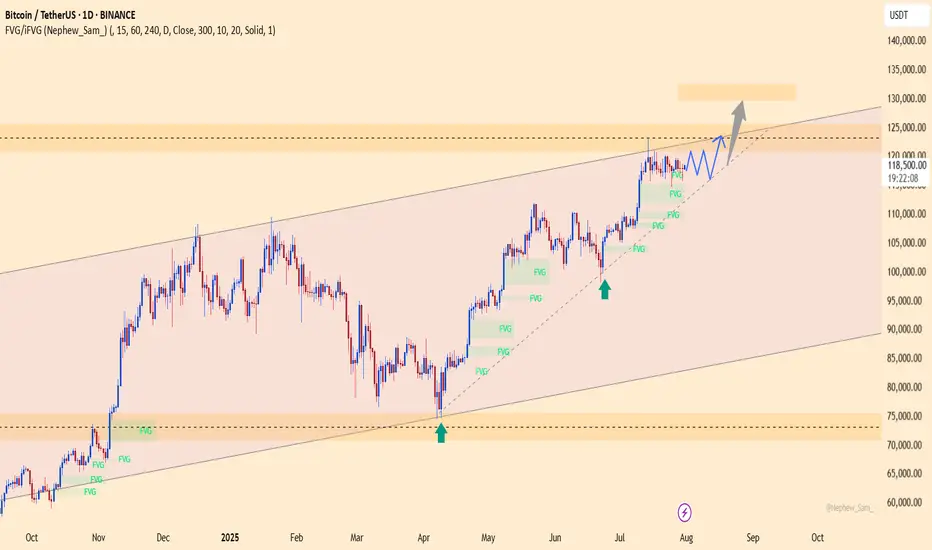
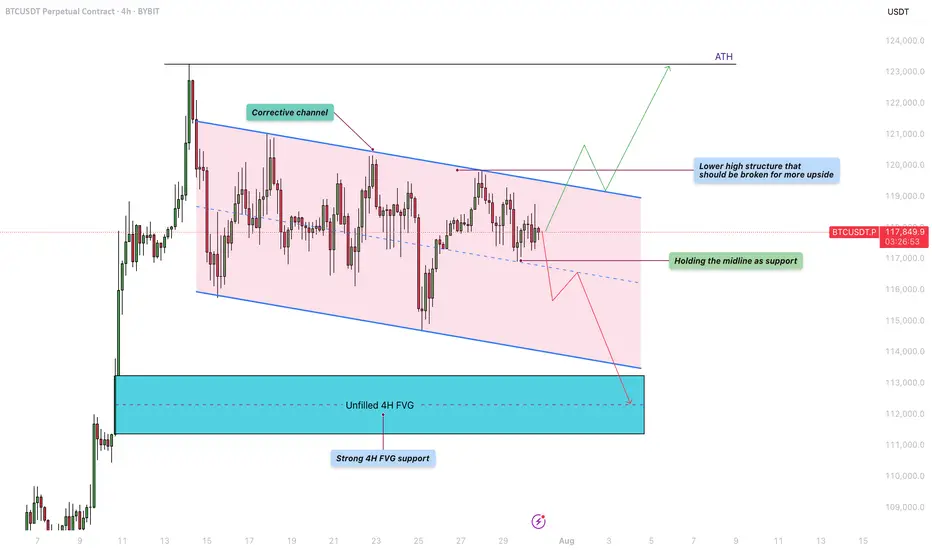
Bitcoin - Will the liquidity at $122K be the next target?Bitcoin is currently trading within a defined corrective channel, which has been developing over the past few weeks. Price action within this structure has been characterized by a sequence of lower highs and lower lows, suggesting a mild downtrend. However, these movements lack strong momentum, indicating that the market is consolidating rather than entering a deeper correction. This kind of structure often precedes a significant breakout, and given the nature of the current price action, a retest of previous highs remains a realistic possibility.
Bullish Scenario
Looking at the overall structure of the channel, a bullish breakout seems increasingly likely. For this scenario to unfold, BTC needs to hold the midline of the channel as support. If this level is respected, it could pave the way for a push towards the upper boundary of the channel and a potential break above the lower high structure near $120,000. A successful breach of that level could trigger a move toward the $122,000 liquidity zone, with the potential to challenge the all-time high (ATH) in the near future. Holding the midline and breaking above key resistance would provide confirmation of strength and continuation to the upside.
Bearish Scenario
On the flip side, if BTC fails to hold the midline as support and starts closing below it on the 4H timeframe, we could see a renewed move toward the lower boundary of the corrective channel. This could lead to a test of the unfilled 4H fair value gap (FVG) highlighted in the chart, located around the $112,000 – $113,000 area. This zone also coincides with a strong historical support level, making it a logical area where buyers might step in and provide the momentum needed for a more sustainable bullish reversal.
Final Thoughts
While both scenarios remain valid, the price structure within the corrective channel currently leans slightly more toward a bullish outcome. The lack of aggressive selling and the potential for liquidity above the previous highs support this view. However, trading is never about certainty but about preparing for various possibilities. Being aware of both bullish and bearish setups allows traders to react with flexibility and discipline depending on how the market unfolds in the coming sessions.
-------------------------
Thanks for your support. If you enjoyed this analysis, make sure to follow me so you don't miss the next one. And if you found it helpful, feel free to drop a like 👍 and leave a comment 💬, I’d love to hear your thoughts!
Deep Dive Into Moving Average Convergence Divergence (MACD)🗓 The Moving Average Convergence Divergence (MACD) is one of the most popular momentum indicators in technical analysis. Whether you're a beginner or an experienced trader, understanding how the MACD works can significantly enhance your trading decisions.
📚 Introduction: What Is MACD and Why It Matters
The MACD (Moving Average Convergence Divergence) is one of the most powerful and widely used momentum indicators in technical analysis. It was developed by Gerald Appel in the late 1970s and has since become a staple in the toolkit of traders and investors across markets — from stocks and forex to cryptocurrencies.
At its core, MACD helps traders understand the relationship between two moving averages of an asset’s price, providing insight into both trend direction and momentum strength. By analyzing how these averages converge and diverge, the indicator offers valuable signals for entries, exits, and trend reversals.
What makes MACD especially popular is its versatility — it works well in trending markets, can be used across all timeframes, and combines both leading and lagging components. Whether you're a day trader or a long-term investor, understanding how MACD works gives you an edge in making timely and informed trading decisions.
📚 How the MACD Is Calculated: The Components Explained
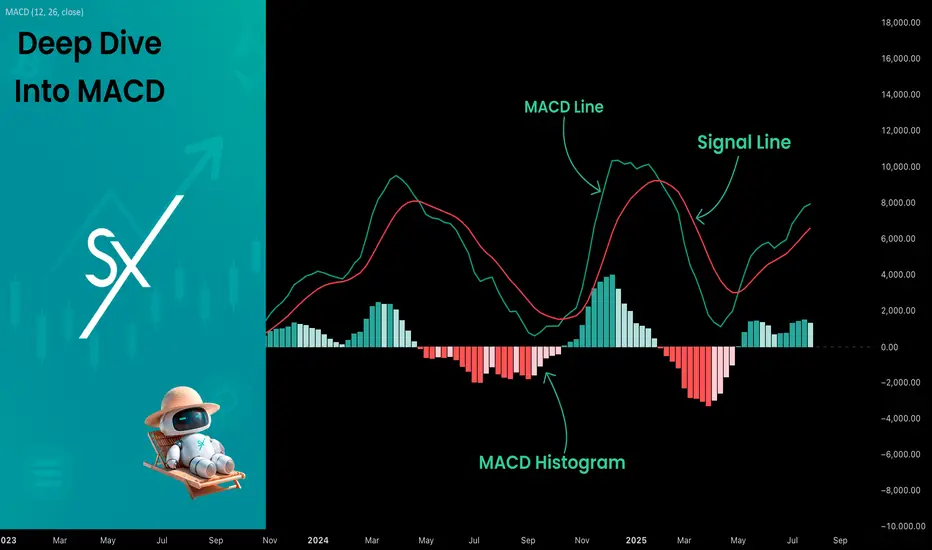
The MACD is built from three core components: MACD line, Signal line and MACD histogram.
🔹 Calculating the MACD Line:
The MACD line is the difference between two Exponential Moving Averages (EMAs), typically 12-period EMA (fast) and 26-period EMA (slow). The formula is:
MACD Line = EMA(12) − EMA(26)
This line captures momentum by tracking how the shorter-term average diverges from the longer-term average. When the MACD line rises, the short-term momentum is increasing faster than the longer-term trend — a sign of bullish acceleration. The reverse implies bearish momentum.
🔹 Calculating the Signal Line:
To reduce noise and provide clearer signals, a 9-period EMA of the MACD line is plotted on top. This is the Signal Line, and it acts as a trigger:
When the MACD line crosses above the signal line → bullish signal (buy)
When the MACD line crosses below the signal line → bearish signal (sell)
Signal Line = EMA(9)(MACD Line)
🔹 Calculating the MACD Histogram:
The Histogram shows the difference between the MACD Line and the Signal Line:
Histogram = MACD Line − Signal Line
It provides a visual representation of momentum strength. The histogram bars expand when momentum strengthens and contract as it fades. It helps you spot shifts in momentum earlier than a basic crossover.
📚 How to Use MACD in Trading Strategies
⚡️MACD Signal Line Crossover
Buy Signal:
MACD Line crosses above the Signal Line from below (bullish crossover)
Preferably when both lines are below the zero line (early in the trend)
Price closes above the long-term trend approximation, in our case we use 200-period EMA
Sell Signal:
MACD Line crosses below the Signal Line from above (bearish crossover)
Preferably when both lines are above the zero line (early in the trend)
Price closes below the long-term trend approximation, in our case we use 200-period EMA
📈Long Trading Strategy Example
1. Wait until MACD line crosses over the Signal line from down to up. In our example we use 1D time frame for BITMART:BTCUSDT.P . Open long trade if point 2 will be completed.
2. Price candle shall be closed above the 200-period EMA. This is long-term trend filter to increase the probability that trades will be open only in the direction of the main trend.
3. Close the long trade when the MACD line crosses under the Signal line. This is an approximation that short-term impulse is over and correction is about to start.
In our case we have +20% return on this long trade, but, please, notice that we have not used initial stop-loss in this strategy. Trade was closed according to the technical condition, this approach can violate the risk management rules, but also can be applicable if you trade the amount ready to lose using this strategy. We will talk about stop-loss later.
📉Short trading strategy example
1. Wait until MACD line crosses under the Signal line from up to down. In our example we use 1D time frame for BITMART:ETHUSDT . Open short trade if point 2 will be completed.
2. Price candle shall be closed below the 200-period EMA. This is long-term trend filter to increase the probability that trades will be open only in the direction of the main trend.
3. Close the short trade when the MACD line crosses over the Signal line. This is an approximation that short-term impulse is over and correction is about to start.
In this case we have +15% return on the short trade. Again, strategy used the technical condition to close the trade and now let's cover how to place the stop-loss. There is no right answer how to use stop-losses. The first and the most obvious way to place stop-loss is using recent swing low/high, but the problem is that all traders are seeing them and do the same. Price tends to reach such levels to collect liquidity.
Another one way to place stop-loss is using the signal candle's high/low. This is so-called 1 candle stop-loss. Usually it's very tight and can allow to have the fantastic risk to reward ratio, but we are now recommend to use it if you are not a professional trader because win rate of such strategy decreases.
Third approach in placing stop-loss which we often use in our algorithmic strategies is the Average True Range (ATR). ATR is the volatility measurement, it allows to take into account the current volatility. Sometimes it helps to avoid the stop-loss hit when trade finally goes in your direction. You can just simply subtract (in case of long trade) or add (in case of short trade) ATR value to the entry price and obtain the dynamic stop loss based on current market condition. Also multiplier can be used for ATR. You shall choose the approach which is more comfortable for you, backtest all these approached to make your choice.
🧪Important: we used the long signals only below the zero-line and short signals above it in the attempt to catch the beginning of a trend and have large potential move. On the picture below you can see the same BITMART:BTCUSDT.P , but what will happen if we open long on the lines crossover above zero line? This trade will not be profitable because of restricted potential.
⚡️MACD Zero Line Crossover
Buy Signal:
MACD Histogram crosses above the zero line (momentum shifts from bearish to bullish)
Price closes above the long-term trend approximation, in our case we use 200-period EMA
Sell Signal:
MACD Histogram crosses below the zero line (momentum shifts from bullish to bearish)
Price closes below the long-term trend approximation, in our case we use 200-period EMA
📈Long Trading Strategy Example
1. Wait until MACD Histogram crosses over zero line. Open long trade if point 2 will be completed.
2. Price candle shall be closed above 200-period EMA. This is long-term trend filter to increase the probability that trades will be open only in the direction of the main trend.
3. Take profit when price reaches 3:1 risk to reward ratio according to the stop-loss from point 4.
4. Stop-loss shall be placed below recent swing low. This point can be discussed, you can use any stop-loss technique described earlier in this article. We demonstrate the simplest one, the key here is using at least 3:1 RR.
📉Short trading strategy example
1. Wait until MACD Histogram crosses under zero line. Open short trade if point 2 will be completed.
2. Price candle shall be closed below 200-period EMA. This is long-term trend filter to increase the probability that trades will be open only in the direction of the main trend.
3. Take profit when price reaches 3:1 risk to reward ratio according to the stop-loss from point 4.
4. Stop-loss shall be placed above recent swing high. This point can be discussed, you can use any stop-loss technique described earlier in this article. We demonstrate the simplest one, the key here is using at least 3:1 RR.
⚡️MACD Divergence Strategy
MACD Divergence is a strategy that helps traders identify potential reversals in market direction before they become obvious on the price chart. This makes it a favorite tool among swing traders and crypto enthusiasts looking to catch major moves early.
But what exactly is a divergence? In simple terms, divergence occurs when price and momentum (MACD) are moving in opposite directions — signaling that the current trend may be losing strength and preparing for a reversal. There are two main types of divergence.
🐂 Bullish Divergence
Price makes a lower low
MACD Histogram makes a higher low
This suggests that while price is still falling, downward momentum is weakening. The bears are losing control, and a bullish reversal may be near. Trading signal is very simple, when bullish divergence happens wait for the first increasing column on MACD histogram and open long trade. Place stop-loss under recent swing low and take profit at 3:1 RR.
🐻Bearish Divergence
Price makes a higher high
MACD makes a lower high
This suggests that while price is still falling, downward momentum is weakening. The bears are losing control, and a bullish reversal may be near. Trading signal is very simple, when bearish divergence happens wait for the first decreasing column on MACD histogram and open short trade. Place stop-loss above recent swing high and take profit at 3:1 RR.
🧪 Important hint: MACD histogram shall cross the zero line between two lows/high to create the most reliable divergence signals. We are not recommend to use it without zero-line crossover to decrease number of false signals.
📈Long Trading Strategy Example
1. MACD Histogram shall create higher low.
2. Price shall create lower low.
3. MACD Histogram shall cross the zero line between lows.
4. MACD Histogram shall show the first increasing column.
5. Put stop-loss under the recent swing low.
6. Put take profit at 3:1.
🧪 You can enhance the long signal with the MACD Line divergence. In our case we have both divergences: with MACD Histogram and MACD Line.
📉Short trading strategy example
1. MACD Histogram shall create lower high.
2. Price shall create higher high.
3. MACD Histogram shall cross the zero line between lows.
4. MACD Histogram shall show the first decreasing column.
5. Put stop-loss above the recent swing high.
6. Put take profit at 3:1.
🧪Divergence is extremely strong signal, but when price continue it's move in the direction of a trend and it's not reversing it can also be the signal for the trend continuation. This situation is called "Baskerville Hound" signal, this name was given by famous trader Alexander Elder. We don't recommend to use it for novice traders, but it's useful to know about it.
📚 Conclusion
The Moving Average Convergence Divergence (MACD) is more than just a crossover tool — it's a powerful momentum indicator that offers deep insight into the strength, direction, and timing of market trends. By understanding how the MACD line, Signal line, and Histogram interact, traders can uncover early trend shifts, spot momentum divergences, and time entries and exits with greater confidence.
Whether you're a short-term trader using fast crossovers for scalping or a long-term investor watching for weekly divergences, MACD can adapt to your style when used thoughtfully. Like all indicators, it works best when combined with price action, support/resistance levels, and other indicators — not in isolation.
Ultimately, mastering MACD is not about memorizing patterns, but about learning to read the story of momentum that unfolds beneath the surface of price. With disciplined application and practice, MACD can become a reliable compass in your trading strategy.
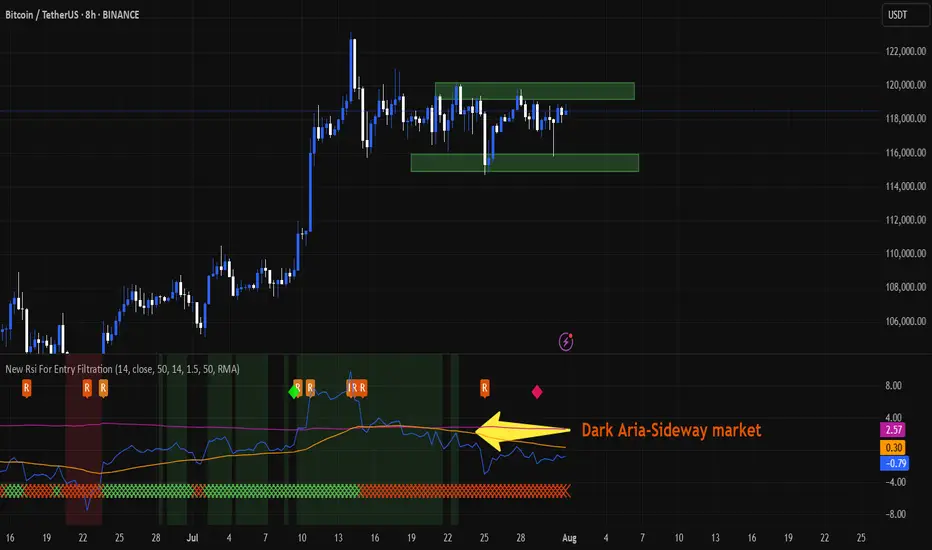
daily #bitcoin analysisBitcoin is fluctuating between the two price areas of $115,000 and $120,000 and I don't think it will trend either up or down anytime soon. Unless it breaks the two mentioned areas from above or below. As we can see, the new RSI indicator also shows a sideways trend. This analysis is not a financial recommendation in any way.
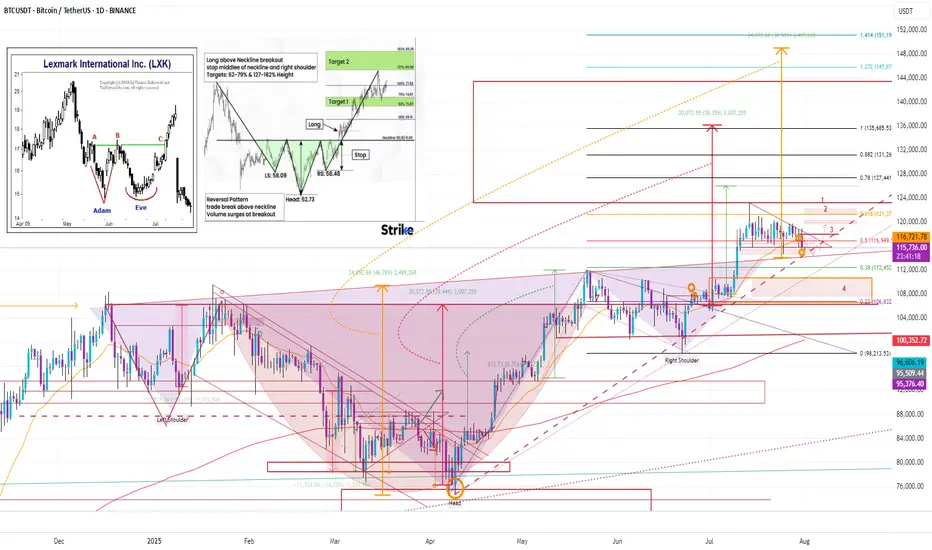
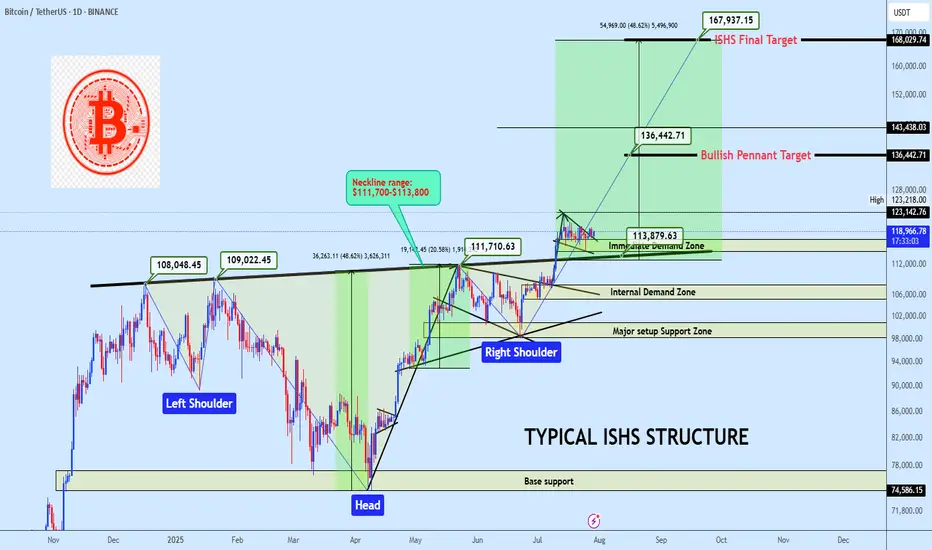
BTCUSDT ISHS Breakout with Bullish Pennant ContinuationBTC is holding above a clean neckline breakout from a inverse head and shoulders formation, currently consolidating inside a bullish pennant. A breakout from this range offers continuation potential to $136K and possibly to $168K. Bias remains bullish while price holds above the $114K region.
Market Structure
• Trend: Bullish continuation
• Pattern: Inverse Head & Shoulders + Bullish Pennant
• Price Action: Clean breakout and retest of neckline support, followed by tightening consolidation
Key Zones
• Immediate Demand Zone: $114,000 – $117,000
• Internal Demand Zone: $105,000 – $108,000
• Major Setup Support Zone: $98,000 – $101,000
• Base Support (ISHS Origin): $74,500 – $77,000
• Neckline: $111,700-$113,800 (Confirmed pivot level)
Technical Confluence
• Volume: Strong candle breakout through neckline, followed by low-volume bullish flag
• Price Geometry: ISHS measured move aligns with the final target at $168K
• Momentum: Bullish structure maintained with higher lows and reactive demand
Entry Plan
• Zone: $117,500 – $119,000
• Method: Limit buy on demand retest or breakout retest of $123K
• Execution: Swing entry with invalidation below demand base
Targets
• 🎯 TP1: $136,442 — Pennant measured move
• 🎯 TP2: $168,029 — Final ISHS target
Invalidation
• ❌ SL: Below $110,000
• Reason: Break below ISHS Neckline invalidates bullish thesis in the short term
• RRR: Estimated 1:4 depending on execution
If this structure aligns with your outlook, feel free to share your thoughts in the comments.
You’re also welcome to drop your preferred altcoins for a quick technical review.
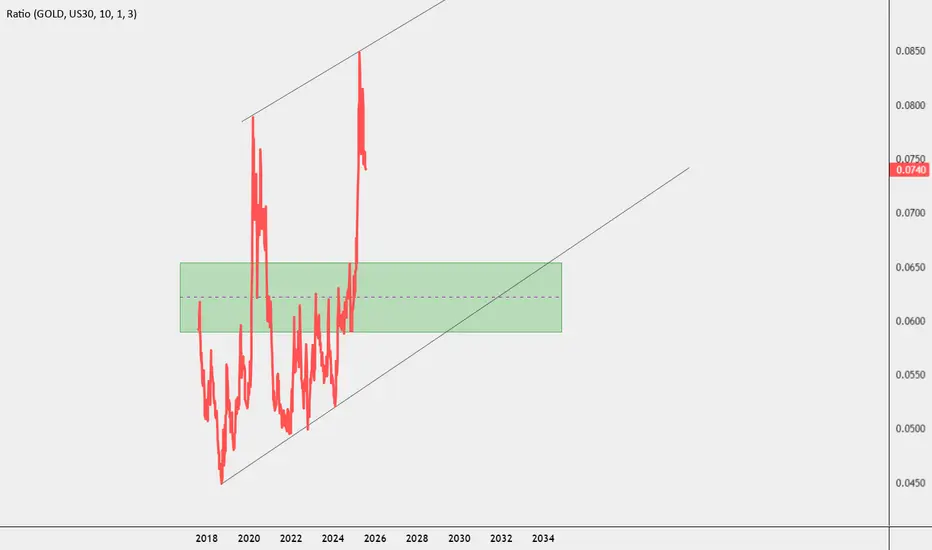
BTC : The future of Bitcoin...Hello friends🙌
👀According to the price history, the price has always been bullish and is in a long-term bullish channel.
📈Now that the price is struggling in the middle of the channel and is gathering strength for a big move, which is expected to break the middle of the channel in the form of a resistance or middle channel, the price will move to the ceiling of the channel.
⚠Don't forget risk and capital management.
🔥Follow us for more signals🔥
*Trade safely with us*
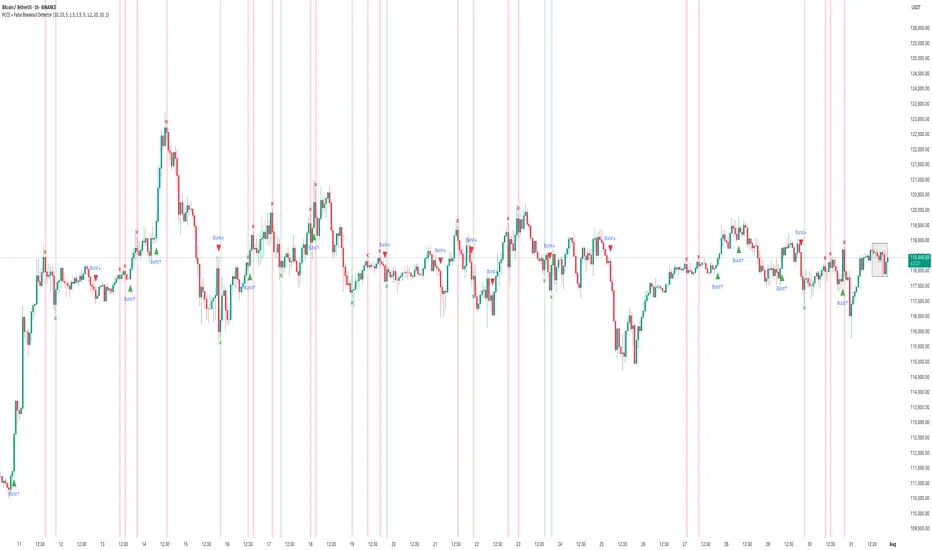
How to Use the PCCE + False Breakout DetectorHow to Use the PCCE + False Breakout Detector to Catch Trap Zones in BTC
Chart: BTC/USDT (1H)
Tool Used: PCCE + False Breakout Detector
Type: Educational – How to identify false breakouts and anticipate trend shifts.
⸻
🧠 What the Indicator Does:
The PCCE + False Breakout Detector is designed to identify breakouts from coiling ranges and filter out trap moves that often fool traders.
🔹 Burst↑ / Burst↓: Valid breakout from a price coil with volume and trend alignment
🔻 Red X: Marks a bull trap — breakout failed and price reversed lower
🟢 Green X: Marks a bear trap — breakdown failed and price reversed higher
By flagging where breakout structure fails, the indicator helps traders avoid false entries and position early for reversals.
⸻
✅ Recent Performance Highlights (BTCUSDT 1H):
📈 From July 13–31:
• Burst↑ on July 13 led to a clean uptrend (+$1,500 gain)
• Red X on July 16 called a failed breakout — price dropped hard
• Green X on July 16 caught the bear trap — price reversed immediately
• Burst↓ on July 21 triggered a sharp decline, validating breakdown
• Red X on July 30 spotted the bull trap just before price reversed down
📉 Even in sideways ranges, Red/Green Xs signaled when the move lacked conviction, allowing traders to wait instead of chasing noise.
⸻
🔍 Current Interpretation:
• BTC is trading inside a choppy structure after a recent Burst↑ and Red X combo.
• The X mark zone (gray box) warns of instability — bulls attempted a breakout but failed.
• If price continues to stay below the Red X high → likely retracement ahead.
• If we see a Green X + rally soon → potential reversal setup in progress.
⸻
📚 How-To Use the Indicator:
1. Burst Signals (Breakouts)
🔸 Use these to enter when coil compression breaks with volume
🔸 Works best when aligned with EMA trend and breakout body
2. Red / Green X (False Breakout Detector)
❌ Red X: Price spiked above resistance but lacked follow-through → trap
✅ Green X: Price dipped below support but got bought → trap
3. Confirm with Price Context
🔄 Look for reaction candles after X marks
📏 Set tighter stops — traps often reverse fast
🔔 Combine with your S/R zones or order block theory
⸻
🧠 Final Thoughts:
The PCCE + False Breakout Detector isn’t just about spotting momentum — it’s about reading intent vs. failure in price action.
BTC’s current structure shows signs of indecision. Trust the Xs to tell you whether the move has legs — or is just another trap.
🎯 Learn to trade the trap, not fall into it.
BTC:LIVE TRADEHello friends🙌
📉Given the decline we had, we now had a good price rebound in the specified support area, which shows the power of buyers. Now, with capital and risk management, we can buy at the specified points in a stepwise manner and move to the specified targets.
🔥Follow us for more signals🔥
*Trade safely with us*
