BTC : The future of Bitcoin...Hello friends🙌
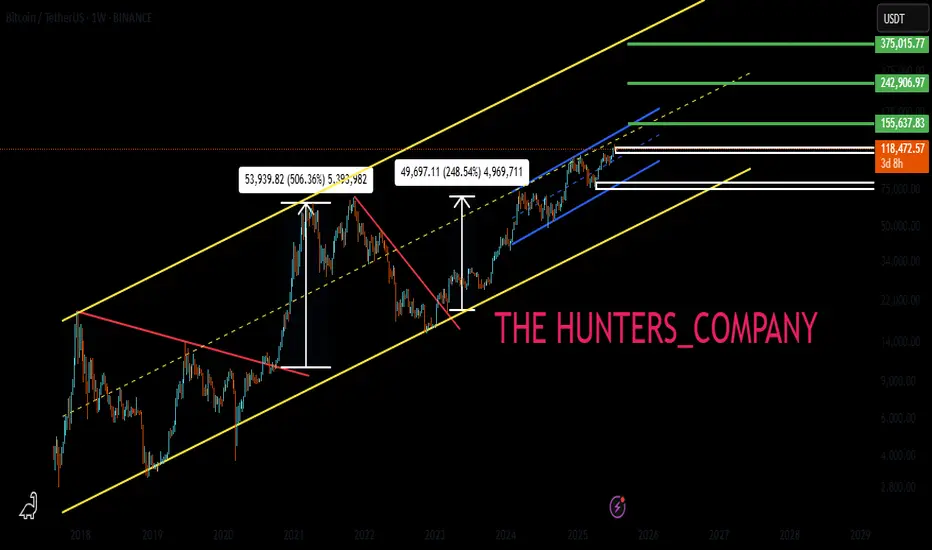
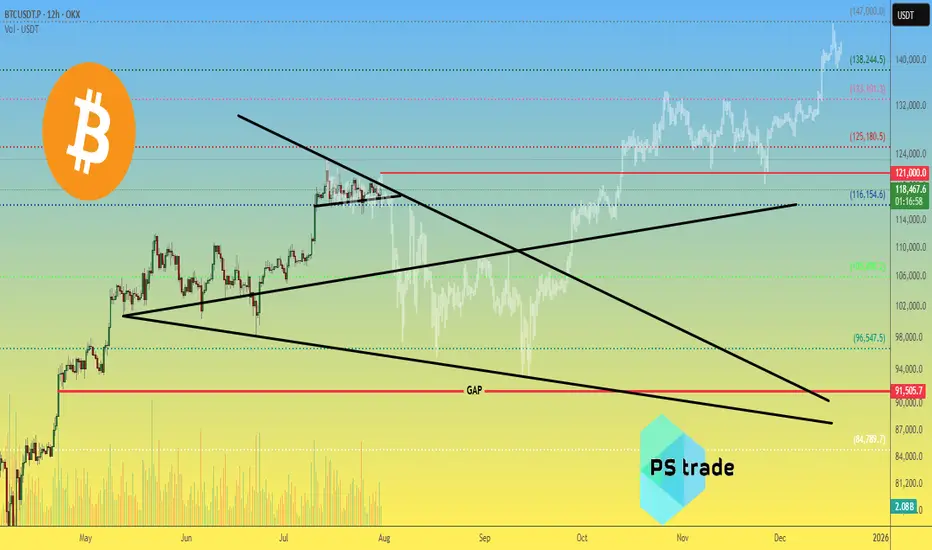
👀According to the price history, the price has always been bullish and is in a long-term bullish channel.
📈Now that the price is struggling in the middle of the channel and is gathering strength for a big move, which is expected to break the middle of the channel in the form of a resistance or middle channel, the price will move to the ceiling of the channel.
⚠Don't forget risk and capital management.
🔥Follow us for more signals🔥
*Trade safely with us*
USDTBTC trade ideas
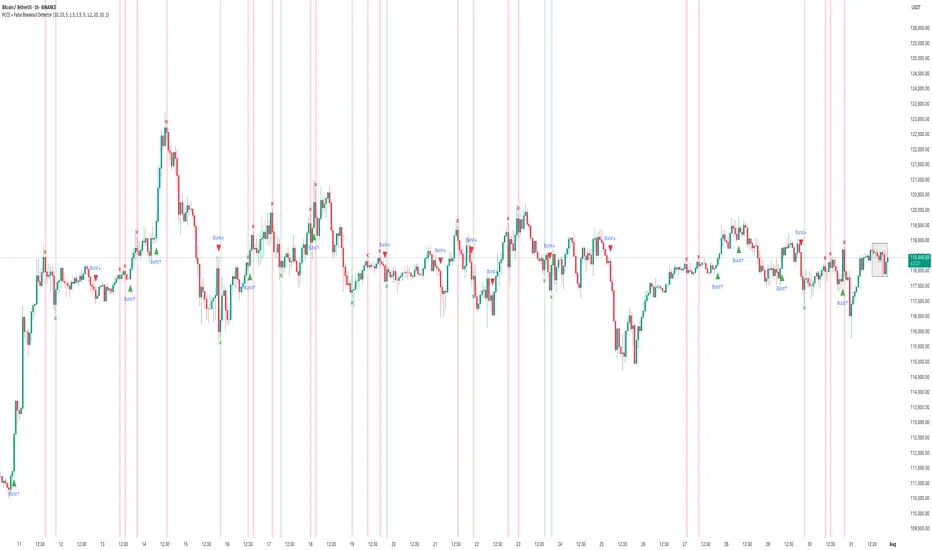
How to Use the PCCE + False Breakout DetectorHow to Use the PCCE + False Breakout Detector to Catch Trap Zones in BTC
Chart: BTC/USDT (1H)
Tool Used: PCCE + False Breakout Detector
Type: Educational – How to identify false breakouts and anticipate trend shifts.
⸻
🧠 What the Indicator Does:
The PCCE + False Breakout Detector is designed to identify breakouts from coiling ranges and filter out trap moves that often fool traders.
🔹 Burst↑ / Burst↓: Valid breakout from a price coil with volume and trend alignment
🔻 Red X: Marks a bull trap — breakout failed and price reversed lower
🟢 Green X: Marks a bear trap — breakdown failed and price reversed higher
By flagging where breakout structure fails, the indicator helps traders avoid false entries and position early for reversals.
⸻
✅ Recent Performance Highlights (BTCUSDT 1H):
📈 From July 13–31:
• Burst↑ on July 13 led to a clean uptrend (+$1,500 gain)
• Red X on July 16 called a failed breakout — price dropped hard
• Green X on July 16 caught the bear trap — price reversed immediately
• Burst↓ on July 21 triggered a sharp decline, validating breakdown
• Red X on July 30 spotted the bull trap just before price reversed down
📉 Even in sideways ranges, Red/Green Xs signaled when the move lacked conviction, allowing traders to wait instead of chasing noise.
⸻
🔍 Current Interpretation:
• BTC is trading inside a choppy structure after a recent Burst↑ and Red X combo.
• The X mark zone (gray box) warns of instability — bulls attempted a breakout but failed.
• If price continues to stay below the Red X high → likely retracement ahead.
• If we see a Green X + rally soon → potential reversal setup in progress.
⸻
📚 How-To Use the Indicator:
1. Burst Signals (Breakouts)
🔸 Use these to enter when coil compression breaks with volume
🔸 Works best when aligned with EMA trend and breakout body
2. Red / Green X (False Breakout Detector)
❌ Red X: Price spiked above resistance but lacked follow-through → trap
✅ Green X: Price dipped below support but got bought → trap
3. Confirm with Price Context
🔄 Look for reaction candles after X marks
📏 Set tighter stops — traps often reverse fast
🔔 Combine with your S/R zones or order block theory
⸻
🧠 Final Thoughts:
The PCCE + False Breakout Detector isn’t just about spotting momentum — it’s about reading intent vs. failure in price action.
BTC’s current structure shows signs of indecision. Trust the Xs to tell you whether the move has legs — or is just another trap.
🎯 Learn to trade the trap, not fall into it.
BTC:LIVE TRADEHello friends🙌
📉Given the decline we had, we now had a good price rebound in the specified support area, which shows the power of buyers. Now, with capital and risk management, we can buy at the specified points in a stepwise manner and move to the specified targets.
🔥Follow us for more signals🔥
*Trade safely with us*

Bitcoin held the $115k level ┆ HolderStatBINANCE:BTCUSDT is currently in a triangle formation just above key support near 112,000. The price recently dipped below short-term support, likely triggering stop-losses, but still holds inside a bullish structure. If momentum builds, a push toward 125,000+ is likely. The trend remains intact above 110,000.

Bitcoin Go 135000Bitcoin has not yet reached the channel ceiling and should bounce back after the resistance.
TradeCityPro | Bitcoin Daily Analysis #140👋 Welcome to TradeCity Pro!
Let’s dive into the Bitcoin analysis. Yesterday, the interest rate decision by the US Federal Reserve was announced, and once again, just like the past few months, it remained unchanged. Let’s see what impact it had on Bitcoin.
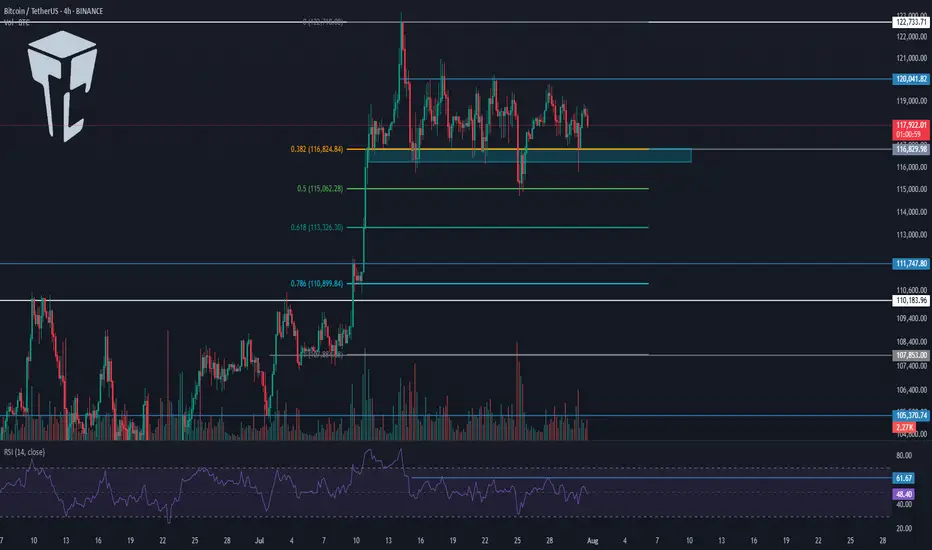
⏳ 4-Hour Timeframe
In the 4-hour timeframe, after the announcement of the unchanged interest rate and Powell’s speech, Bitcoin printed a red candle on the support zone and even wicked lower, but then recovered and the price returned back into the box.
✔️ Basically, we can say that this month’s rate decision had no real impact on the market, and Bitcoin is still moving inside its range box. The fact that the support zone wasn’t lost is a positive sign for the continuation of the trend.
⭐ But the important point is this: if the uptrend is going to continue, the price must print a higher high or at least a level equal to 120041, and in my opinion, if for any reason a lower high gets printed, the chances of breaking below 116829 significantly increase.
📊 I currently have no new position on Bitcoin, and all my entries are below 110000. But if 120041 breaks, I’ll open a long position for the next bullish wave that Bitcoin might start.
💥 A major trigger for starting a new leg is the 61.67 level on the RSI. As long as RSI remains below this level, there’s no bullish momentum in the market — and considering that the number of touches to 116829 has increased, the probability of a correction is also rising.
❌ Disclaimer ❌
Trading futures is highly risky and dangerous. If you're not an expert, these triggers may not be suitable for you. You should first learn risk and capital management. You can also use the educational content from this channel.
Finally, these triggers reflect my personal opinions on price action, and the market may move completely against this analysis. So, do your own research before opening any position.
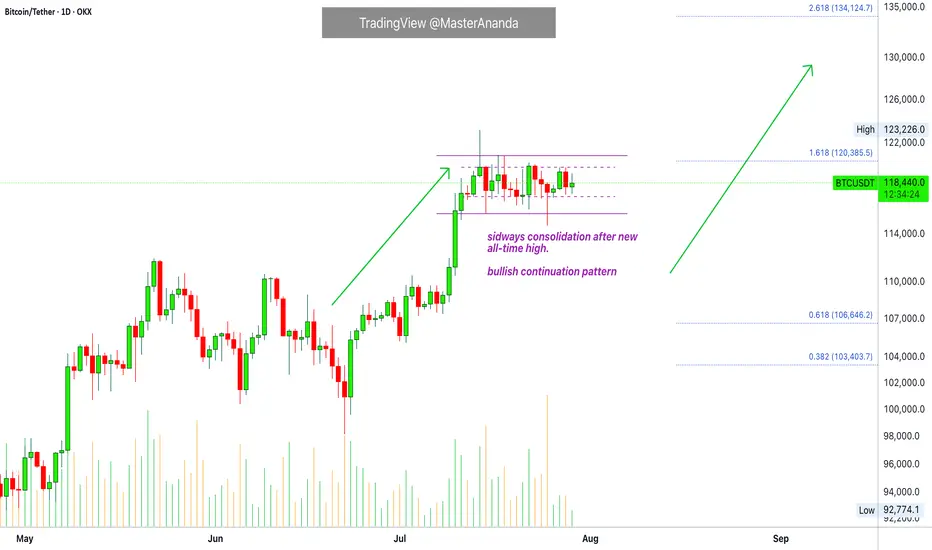
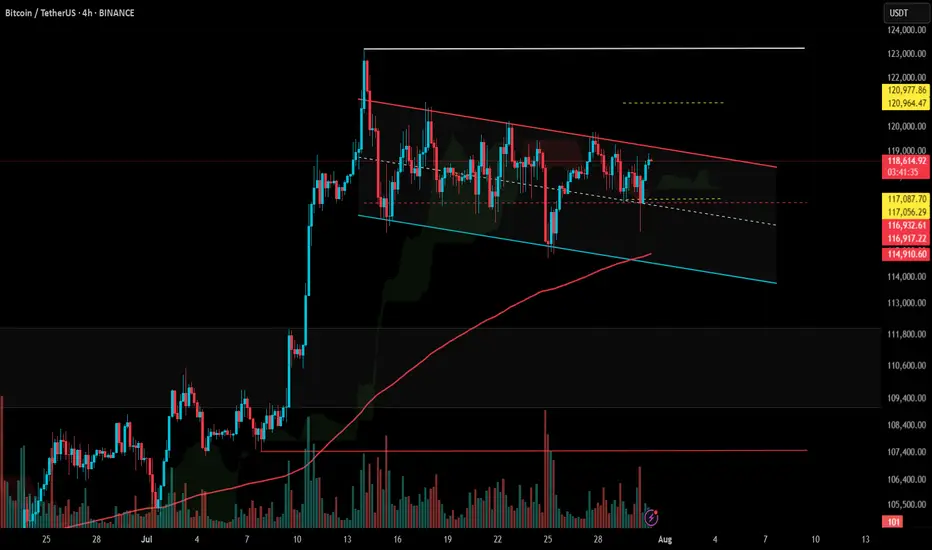
Bitcoin & The Altcoins —Name Your AltcoinBitcoin is sideways right now and is moving in a very tight and narrow range. All the action has been happening between $117,000 and $120,000 based on candle close since 11-July. This is bullish, think about it.
Bitcoin hits a new all-time high and next thing you know it turns sideways very close to resistance. The only drop was short-lived and everything sold was quickly bought. Why is Bitcoin consolidating so close to resistance? It is preparing to move ahead.
What happens when Bitcoin moves forward after so much recovery? Everything experiences a positive cycle. This is a very strong signal.
This chart allows for more whipsaw as you know nothing else is possible in a trading range. We predict the pattern to resolve bullish, but there can be swings to either side. A swing down just as it happened 25-July. A swing up just as it happened 14-July. This is always possible but the end result won't change. Bitcoin will continue sideways but when the sideways period is over, you will not see a move toward $110,000 or $100,000. The break of the trading range will confirm the advance toward $135,000 next month. Bitcoin is likely to continue in the same mode. While Bitcoin consolidates the new advance, the altcoins grow. In this way the entire market continues to recover and grow month after month after month.
Name Your Altcoin
Leave a comment with your favorite altcoin trading pair and I will do an analysis for you. I will reply in the comments section. Make sure to include any questions you might have beforehand.
If you see a comment with a pair you like, boost and reply so these can be done first.
Thanks a lot for your continued support.
Namaste.
Three White Soldiers & Three Black CrowsHello, Traders! 😎
In technical analysis, not all candlestick patterns are created equal. While some merely hint at indecision or short-term corrections, others shout with conviction: "Trend reversal is coming…" Two of the most powerful momentum candlestick formations are the Three White Soldiers and the Three Black Crows. When they appear, traders PAY ATTENTION. In this article, we’ll dive deep into: What do these patterns look like? Why do they form? What do they tell us about market psychology? How to trade them?+ Their limitations 👇🏻
What Are Three White Soldiers and Three Black Crows?
These Are Multi-Candle Reversal Patterns That Suggest A Strong Shift In Market Sentiment:
Three White Soldiers. A 🐂bullish reversal pattern that occurs after a downtrend. It consists of three consecutive long-bodied green (or white) candles, each closing higher than the last, and ideally opening within the previous candle’s real body.
Three Black Crows. A 🐻bearish reversal pattern that shows up after an uptrend. It’s made of three consecutive long-bodied red (or black) candles, each closing lower than the last and opening within the previous candle’s real body. They signal not just a change in price, but a shift in power, from sellers to buyers (or vice versa).
Candles With a Message
Unlike most one-candle signals or minor patterns, these sequences tell a real story. They show that one side has taken clear control over the market — not for an hour, not for a single day, but for multiple sessions. And that kind of shift, especially on higher timeframes like daily or weekly charts, is something seasoned traders pay close attention to.
Let’s get into the psychology for a second. Imagine you’re a trader who just watched BTC drop for two weeks. Then out of nowhere, three strong green candles appear, each more bullish than the last. You’re seeing buyers push through resistance levels like they don’t even exist. That’s not just a bounce, that’s confidence. That’s the kind of thing that makes people FOMO back in, or finally close out their shorts. Same with the Black Crows. If the price has been climbing and suddenly sellers start hammering it for three days straight? That’s not retail panic. That’s big money exiting.
Now, How do Traders Trade Them?
Well, a lot of people jump in right after the third candle closes. If you’re going long on the Three White Soldiers, you’re betting that the breakout has legs. Same for shorting the Black Crows.
But, and here’s the trap, not all of these patterns play out. Sometimes, that third candle is the climax, not the beginning. So confirmation matters. Volume should increase. The move should break a recent key level. Indicators like RSI or MACD should support the shift. Otherwise, you might just be catching the end of a move, not the start of one.
Another mistake? Ignoring context. These patterns mean nothing if they’re forming in the middle of chop or during low-volume holiday trading. They work best when they signal the end of exhaustion.
And let’s be honest. Even if the pattern is clean, you still need a plan. Stops should go below the first green candle (for bullish setups) or above the first red one (for bearish setups). If price moves against you, it means momentum never really shifted. That’s your cue to get out fast.
Final Thoughts
Three White Soldiers and Three Black Crows are powerful tools in the hands of a patient trader. Of course, these patterns aren’t perfect. They don’t account for time, so a 3-day move might seem powerful, but if it happens slowly over 12-hour candles, it’s not as strong as the same pattern on a daily chart with volume.
The takeaway? These are patterns worth knowing, not because they’re magic, but because they reflect a real shift in market behavior. When Three White Soldiers or Three Black Crows show up in the right place, at the right time, with the right confirmation… that’s when charts stop being random and start making sense. But remember. They are indicators, not guarantees. The best traders use them in conjunction with other tools and a clear trading plan.

BTC/USDT Analysis: Testing Strong Support
Hello everyone! This is the daily analysis from CryptoRobotics' trader-analyst.
Yesterday, we tested the local support zones previously marked and moved into a decline. At 21:00 (GMT+3), the U.S. Federal Reserve released its monetary policy statement, which included hawkish comments regarding inflation risks. The interest rate remained unchanged. The market reacted negatively to this news, and Bitcoin accelerated its drop.
At one point, a key buyer zone at $116,200–$115,000 (volume anomalies) was tested. Then, between 21:30 and 22:00 (GMT+3), a report from the White House on digital assets was released, shifting focus toward a more positive regulatory outlook. Bitcoin bounced from the mentioned zone and has since fully recovered the drop.
Currently, there are no immediate resistance levels, so in the near term, we’re likely to see a test of the ~$120,000 level. There, it's important to watch for any signs of selling pressure.
Buy Zones:
• $116,200–$115,000 (volume anomalies)
• $110,000–$107,000 (accumulated volume)
This publication does not constitute financial advice.
BTC AI Prediction Dashboard - 6h Price Path (31.07.25)
Prediction made using Crypticorn AI Prediction Dashboard
Link in bio
BTCUSDT Forecast:
Crypticorn AI Prediction Dashboard Projects 6h Price Path (Forward-Only)
Forecast timestamp: ~14:00 UTC
Timeframe: 15m
Prediction horizon: 6 hours
Model output:
Central estimate (blue line): -118,124
Represents the AI’s best estimate of BTC’s near-term price direction.
80% confidence band (light blue): 117,836 – 118,977
The light blue zone marks the 80% confidence range — the most likely area for price to close
40% confidence band (dark blue): 117,650 – 119,908
The dark blue zone shows the narrower 40% confidence range, where price is expected to stay with higher concentration
Volume on signal bar: 177.26
This chart shows a short-term Bitcoin price forecast using AI-generated confidence zones.
Candlesticks reflect actual BTC/USDT price action in 15-minute intervals.
This helps visualize expected volatility and potential price zones in the short term.

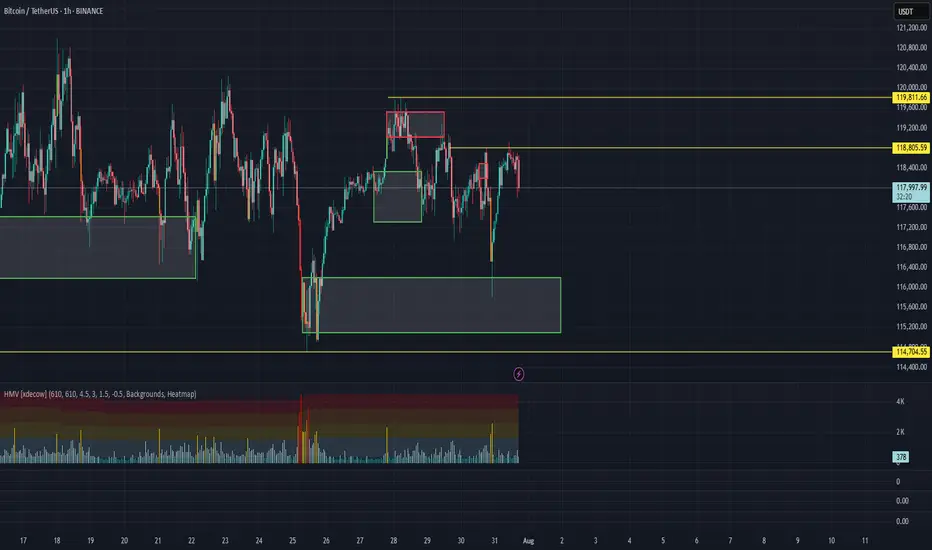
$BTC - Swing Point RetestCRYPTOCAP:BTC | 2h
We've got a swing point retest at 115.7k after the deviation at 114.6k
For bullish continuation, holding above 117.3k-116.8k is key — any break below invalidates the setup.
A clean break above the 120k resistance, I'm expecting we could finally tag 121k–122k (untested supply zone).
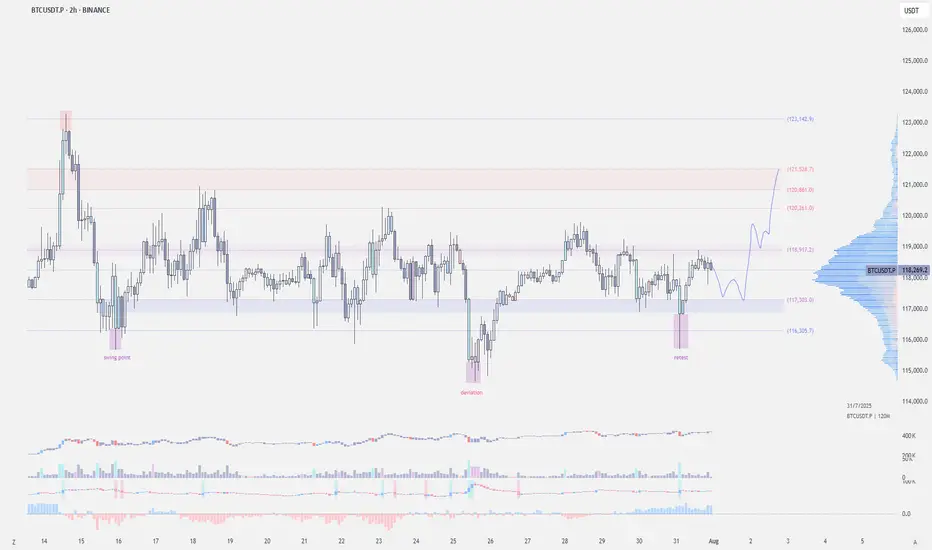

Chart Patterns - How to read them like a ProChart patterns are visual formations on price charts that help traders anticipate potential market movements.
These patterns fall into three main categories: bullish , bearish , and indecisive .
---
1. Bullish Chart Patterns
Bullish patterns often signal that price is likely to move upward.
1.1 Bull Flag
* What it looks like: A sharp upward move followed by a small downward-sloping rectangle (the flag).
* Meaning: After a strong rally, the price consolidates briefly before continuing higher.
* Key insight: A breakout above the flag typically signals a continuation of the trend.
1.2 Pennant (Bullish)
* What it looks like: A strong upward move followed by a small symmetrical triangle.
* Meaning: Similar to the bull flag, but the consolidation takes a triangular form.
* Key insight: Once price breaks above the pennant, the uptrend often resumes.
1.3 Cup & Handle
* What it looks like: A “U”-shaped curve (the cup) followed by a small downward drift (the handle).
* Meaning: This pattern suggests a period of accumulation before price breaks higher.
* Key insight: A breakout above the handle signals the beginning of a new bullish leg.
1.4 Inverse Head & Shoulders
* What it looks like: Three low points, with the middle low being the deepest.
* Meaning: This reversal pattern appears after a downtrend and signals a potential change to an uptrend.
* Key insight: A breakout above the “neckline” confirms the reversal.
---
2. Indecisive Chart Patterns
These patterns show market hesitation, where neither bulls nor bears are clearly in control.
2.1 Consolidation Channel
* What it looks like: Price moves within a horizontal channel.
* Meaning: Market is moving sideways with no strong trend.
* Key insight: A breakout in either direction often leads to a significant move.
2.2 Symmetrical Triangle
* What it looks like: Two converging trend lines forming a triangle.
* Meaning: This is a neutral pattern that can break out in either direction.
* Key insight: Traders wait for a breakout before taking a position.
---
3. Bearish Chart Patterns
Bearish patterns signal a high probability of downward price movement.
3.1 Bear Flag
* What it looks like: A sharp decline followed by a small upward-sloping rectangle.
* Meaning: After a strong drop, price consolidates before continuing lower.
* Key insight: A breakout below the flag suggests a continuation of the downtrend.
3.2 Pennant (Bearish)
* What it looks like: A sharp downward move followed by a small symmetrical triangle.
* Meaning: Similar to the bear flag, but the consolidation takes a triangular form.
* Key insight: A breakout downward typically resumes the bearish trend.
3.3 Inverse Cup & Handle
* What it looks like: An upside-down cup with a small upward drift forming the handle.
* Meaning: Indicates weakness after an uptrend, often followed by a drop.
* Key insight: A break below the handle usually signals a strong bearish move.
3.4 Head & Shoulders
* What it looks like: Three peaks, with the middle one being the highest.
* Meaning: A classic reversal pattern that indicates a potential shift from an uptrend to a downtrend.
* Key insight: A break below the “neckline” confirms the bearish reversal.
---
How to Use These Patterns
* Combine pattern recognition with support/resistance, volume, and indicators for stronger confirmation.
* Always wait for breakouts and avoid acting too early.
* Manage risk with stop-loss orders.

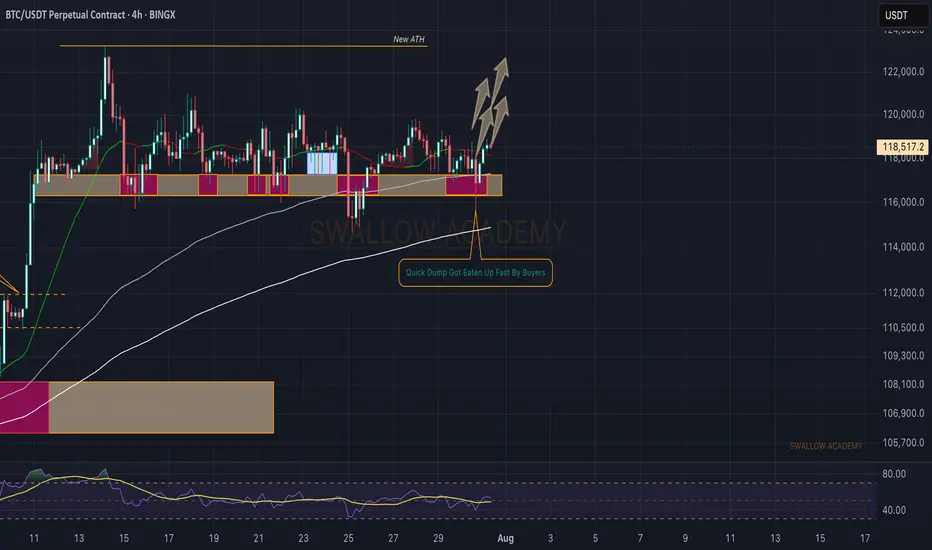
Bitcoin (BTC): Failed Dump | Buyers Still in Control Bitcoin recently had another wave of selling, where buyers once again showed their dominance near the local $116K zone and pushed the price of BTC back up.
We remain bullish, as we see the buyside dominance above the 116K area, so our target is still the current ATH; let's see.
Swallow Academy
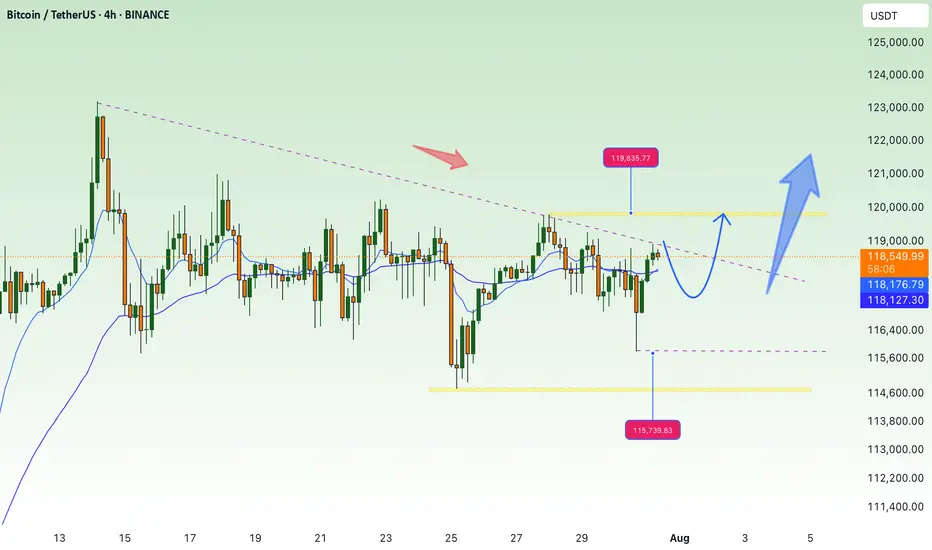
Accumulate waiting for btc price increase💎 BTC PLAN UPDATE – End of July (31/07)
📊 BTC Technical Analysis (4H Timeframe – End of July)
✅ Positive Signals:
• BTC has broken out of the consolidation triangle pattern (blue diagonal line), indicating a potential strong uptrend.
• The current price is retesting the breakout support zone around 117,800–118,000 → showing a good reaction and creating upward momentum.
• MA50 and MA200 are starting to slope upwards → confirming increasing buying strength.
📈 Bullish Scenario:
• If BTC holds above 118,000, it is likely to move toward the nearest resistance zone at 119,900.
• After breaking 119,900, the next targets are:
→ 122,792 (Fibonacci 1.618)
→ Further target: 127,900 (Fibonacci 2.618)
🛑 Risk Note:
• If the price drops below 117,000, it’s important to monitor again, as it may retest a deeper support zone around 114,500.
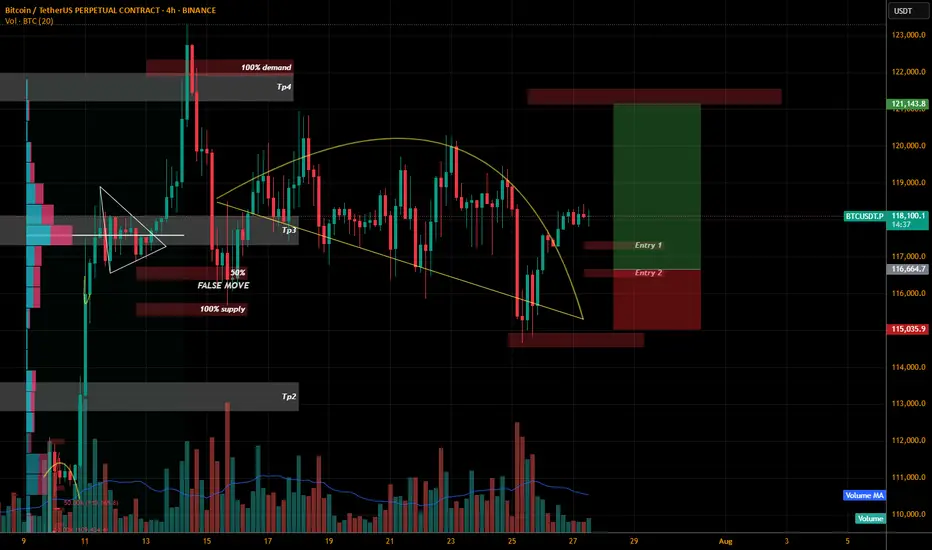
BTCUSDT.P LONGThe price is squeezed and its Sunday we might get a big move Positive Lets hope for the best and plan our trading.
I have marked 2 entries I think the more we wait the more we get.
So entry 2 in my opinion will be more beneficial to trail this trade. Anyhow if we see any bullish momentum on these level we are IN guys.
WHY? why i planned this trade as we can see the we are on sunday and price squeezed and we are already in bull run and we can see the price break the curve resistance so i hope the price will retest the level and if we see bullish candle patterns than only we will execute it.
If you like my previous ideas and analysis please don't forget to follow me. We all need encouragement. The more followers the more encouragement.
Bitcoin BTC price analysis by the end of 2025🕯 July is coming to an end, with 3 weeks of OKX:BTCUSDT consolidation between $117k–121k.
Tomorrow begins the last month of summer — and it promises to be "hot" as, according to our earlier published calendar Trump's administration plans to send letters with new, increased tariffs to "all countries" on 01.08.
💰 Also, take a look at Bitcoin Monthly Returns. In our view, 2025 resembles 2020 the most.
What do you think?
👉 According to this dynamic, the real "hot" may come not in summer, but late autumn.
💰 We've also tried to find a price fractal for #BTCUSD that fits the current structure — and for now, it looks plausible:
◆ In the coming days, CRYPTOCAP:BTC should not rise above $121k.
◆ A low of correction might hit mid-September around $93k.
◆ A cycle top for #BTC could arrive to the end of 2025, near $147k.
📄 Now that you've seen our version — share your forecasts on future #BTCUSDC price action in the comments 👇
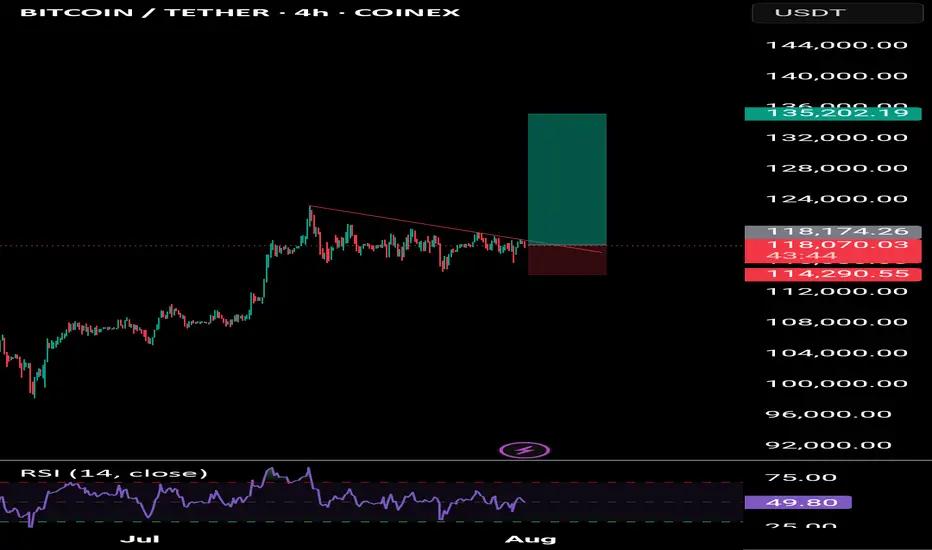
BITCOIN & 134KAfter Bitcoin rallied on July 8 and consolidated for two weeks, this bull flag remains valid, targeting $134,000.

#BTC Update #12 – July 31, 2025#BTC Update #12 – July 31, 2025
Bitcoin is currently at the upper boundary of the channel it has been following. It may experience a pullback from this upper boundary. This pullback is estimated to reach the $116,800 level. If it wants to go lower, it could drop as far as the $114,500 level.
There is a significant amount of liquidity between $121,000 and $117,000. Bitcoin may also try to sweep this area. However, despite 4 or 5 attempts, it still hasn’t managed to break above the upper resistance zone. Therefore, a pullback should always be taken into account.
Overall, Bitcoin is still in a correction within a correction. That means no impulsive move has occurred yet. It’s not at a suitable point for either long or short positions. You may choose to trade within this range, but keep in mind that it's quite risky.
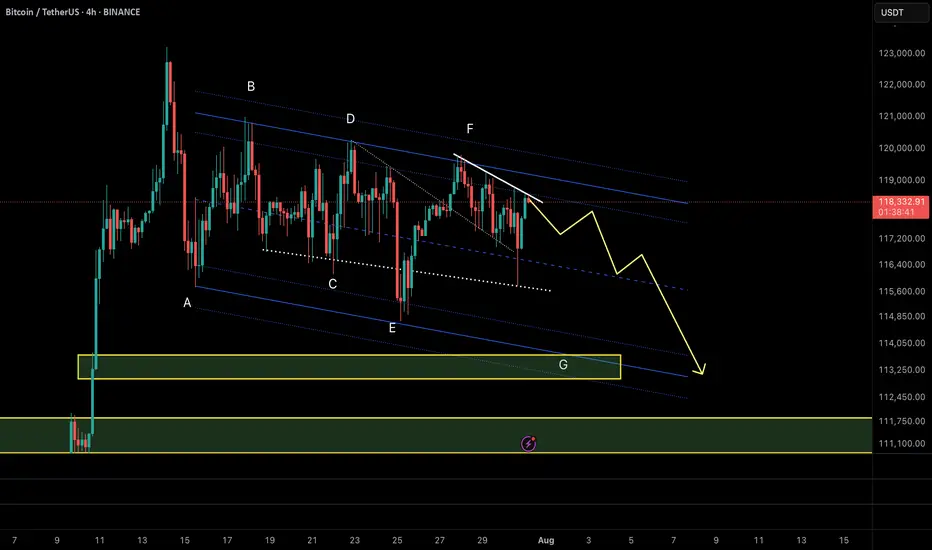
BTCUSDT – Diametric G-Leg Underway?⏱ Timeframe: 4H / 1H
🔍 Method: NeoWave + Smart Money Concepts (SMC)
📍Posted by: CryptoPilot
⸻
🧠 NeoWave Progression Update
As outlined in our previous analysis, we are tracking a potential Contracting Diametric structure (A–G) originating from the March 2025 highs.
🚨 The G-Leg may now be actively unfolding.
Here’s what just happened:
• Price rejected sharply from the supply zone near 119,000–119,500, exactly where Wave F was expected to end.
• After a drop to 115,780 (minor trendline), price bounced, but failed to make a new high, stalling at 118,700, forming a lower high → classic signature of a developing G-Leg.
• This G-wave likely aims to break below Wave E low, seeking imbalance fills and structural resets.
⸻
📊 Smart Money Confluence (SMC / ICT)
• 🟥 Bearish Market Structure confirmed via MSS on 1H: Lower Highs + Internal BOS
• 🟨 Buy-side Liquidity above 120k was already swept
• 🔻 Price failed to reclaim OB block around 119.5k
• 🧩 FVGs remain open between 114.5k–113k, acting as magnet zones
• 📉 Expectation: Price may now break the ascending minor trendline and accelerate toward the major structure low
📌 Primary Scenario:
• Wave G of Diametric in motion
• Potential structure: Zigzag or Complex Combination
• Expectation: Bearish continuation to break below 113k
📌 Alternative Scenario:
• If price closes above 120.5k, diametric structure may be invalidated
• Watch for triangle/flat development instead
⸻
⚠️ Risk Management Note:
Price action near 118.7k–119.5k is crucial. Reclaiming that zone with strength changes the bias. Until then, sellers remain in control.
💬 Final Thought:
We’re tracking the final stages of a multi-month complex correction. The rejection at supply, combined with SMC signals and NeoWave symmetry, suggests sellers may push price into deeper demand zones soon.
⸻
📌 Follow CryptoPilot for advanced wave structure updates, market geometry insights, and ICT-style smart money traps.
💬 Share your views or alternate wave counts in the comments!
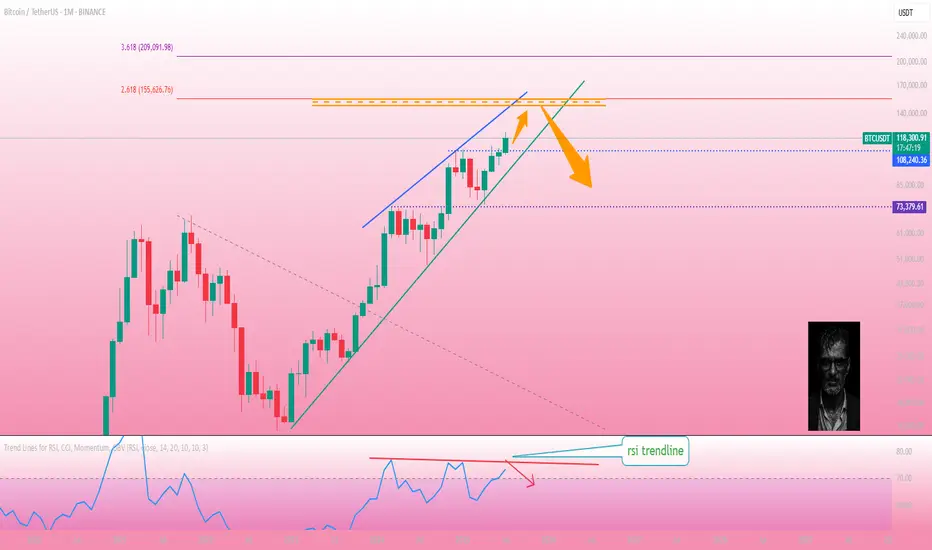
Bitcoin on a monthly time frameBitcoin on the monthly time frame.
If the monthly candle closes in this way, the price is expected to move to the 618 Fibonacci area. According to the trend line in RSI, we will enter a correction phase after the price rises.
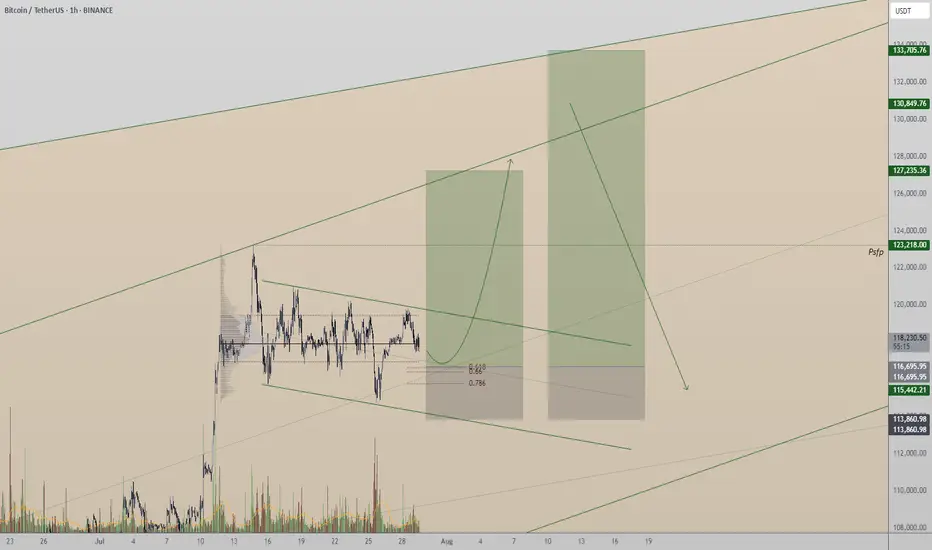
Bitcoin:Can Support at Point of Control Fuel a Move to New High?Bitcoin is currently consolidating at its local point of control, facing immediate resistance from a Fibonacci-aligned value area low. A critical reversal from here could pave the way to new all-time highs.
Bitcoin has entered a pivotal phase, trading at a key technical region that could determine its short-term direction. Over the past week, price action has hovered around the local point of control, showing signs of absorption and consolidation. With immediate resistance looming at a major confluence level, the next few daily candles may set the stage for either a breakout or a deeper retracement.
Key Technical Points:
- Local Point of Control: Bitcoin is ranging around this level, showing indecision
- Value Area Low + 0.618 Fib: Immediate resistance forms strong technical confluence
- Swing Low Critical: A break below the last swing low would invalidate bullish structure
Bitcoin’s current position around the local point of control reflects a phase of market equilibrium. This level represents the area of highest traded volume over the recent range, acting as both support and resistance at different times. The fact that price has revisited and hovered here for multiple days suggests active positioning from both bulls and bears.
Just above lies the value area low, which is in direct confluence with the 0.618 Fibonacci retracement from the recent swing high to swing low. This dual-layered resistance is significant — if Bitcoin is able to break above and reclaim this zone, it could unlock the next leg higher.
However, traders must remain cautious. The most recent swing low, formed during the last pullback, now acts as the final line of defense for bulls. A loss of this low would shift market structure to bearish and potentially initiate a correction deeper into the prior range.
So far, the lack of high-volume breakdowns suggests sellers have not yet gained control. But without a decisive bounce and follow-through above resistance, the risk of a failed reversal increases.
What to Expect in the Coming Price Action:
If Bitcoin holds above the point of control and mounts a successful challenge of the value area low, a rotation toward a new all-time high becomes increasingly likely. However, failure to defend the swing low would invalidate the setup and favor further downside. All eyes remain on the current consolidation for clues on the next major move.