BTC/USDT Buy Setup – VSA & Demand Zone Reaction✅ Entry: Current price action near 117,297
🎯 Target: 119,078 (+1.22%)
🛑 Stop Loss (SL): 116,944 (below demand zone)
📊 Technical Insight (Volume Spread Analysis):
Stopping Volume at Lows:
The recent down move halted with a wide spread down-bar on high volume, followed by an immediate rejection. This indicates potential professional buying absorbing supply.
No Supply Confirmation:
After the stopping volume, several narrow spread candles on low volume formed, suggesting weak selling pressure and a lack of commitment from bears.
Bullish Reaction:
Price rebounded from the demand zone with increasing volume on up-bars, showing early signs of demand dominance.
The current consolidation just above the support is typical of absorption before a markup phase.
Risk-Reward Structure:
The setup offers a favorable 2.2:1 R:R ratio, with the stop placed just below the zone to avoid false breakouts while allowing the trade room to breathe.
📌 Trade Plan:
Bias remains bullish as long as price holds above 116,944.
A breakout above the minor resistance (117,828) with volume expansion would confirm the next leg up toward the 119,078 target.
If volume fails to support the move, reassess before committing additional capital.
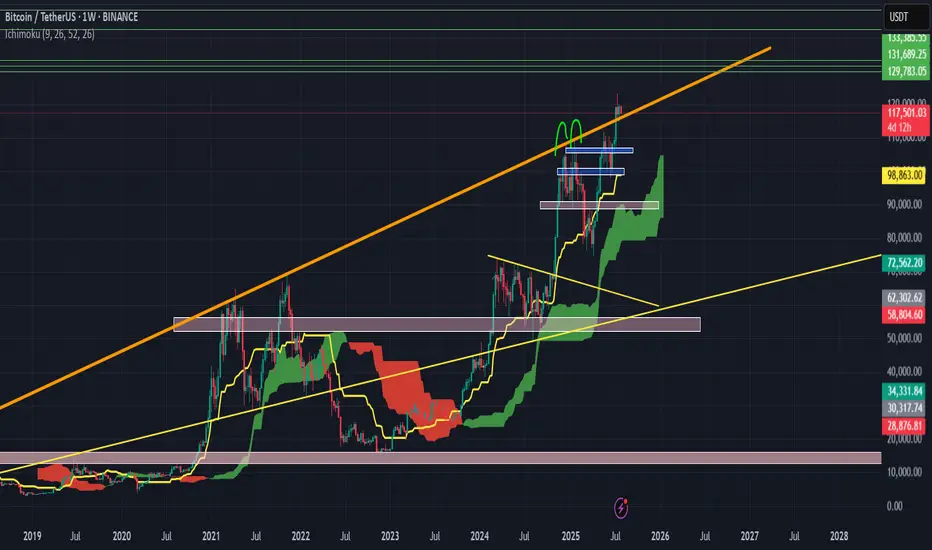
USDTBTC trade ideas

$BTC Retest Before Takeoff?Back on July 27, I shared a path 120K → 114K → 127K
Price has followed this playbook closely and now we’re at a critical zone again.
On daily timeframe, structure is still in an uptrend, but momentum is fading.
Price is consolidating between 119.9K–120.1K (Fib 61.8–65%) and 117.8K–116.6K (Fib 38.2–23.6%). MACD bearish crossover and histogram is still growing. RSI is neutral at 51 but definitely losing bullish energy.
If 117.8K breaks cleanly, we may revisit 114.7K (demand zone + full Fib retracement) before bulls reclaim control.
If we look at lower timeframe (4H). It is forming a tight range, but a lower high + weakening MACD suggests a bit more downside short term. Also, RSI at 46 confirms that consolidation with mild bearish tilt.
Key levels that I am currently looking are 118.8K–117.8K for the short-term intraday range play. And 116.6K & 114.7K for the support & potential bounce zone.
The scenario is still in play
- Rejection at 120K
- Retest 114K–116K zone
🚀 Then potential launch toward 127K (measured move + channel top)
Only a daily close above 120.1K with volume invalidates this retrace idea.
TL;DR
🟥 Resistance: 119.9K–120.1K
🟧 Neutral zone: 117.8K–118.9K
🟩 Support: 116.6K - 114.7K
🟦 Target: 127K if bulls reclaim the high ground
Still playing the patient game. Let’s see if 114K gets tagged one more time. What do you guys think?

Important Volatility Period: August 2nd - 5th
Hello, fellow traders!
Follow us for quick updates.
Have a great day!
-------------------------------------
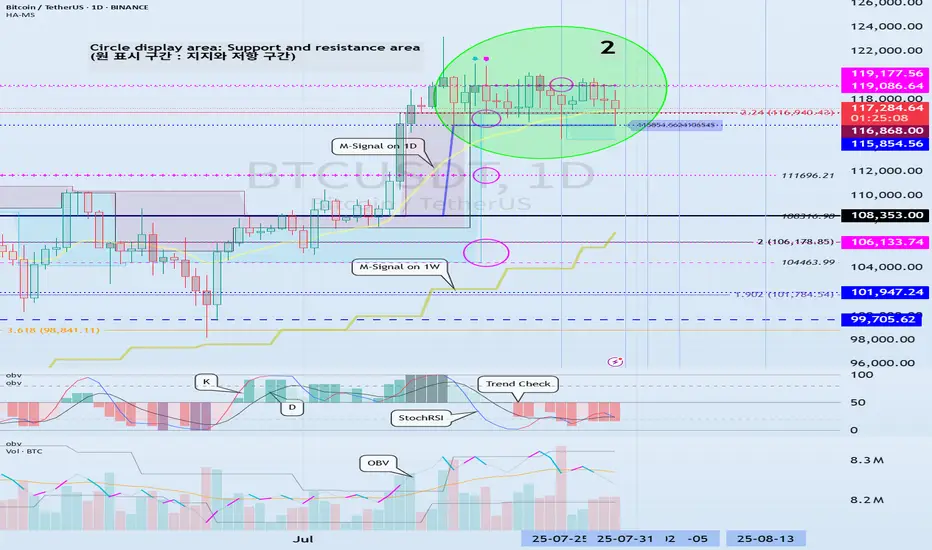
(BTCUSDT 1M Chart)
Let's take a moment to check the trend before the new month begins.
There have been two major declines so far, and a third major decline is expected next year.
For the reason, please refer to the "3-Year Bull Market, 1-Year Bear Market Pattern" section below.
-
My target point for 2025 is around the Fibonacci ratio of 2.618 (133889.92).
However, if the price surges further, it could touch the Fibonacci range of 3 (151018.77) to 3.14 (157296.36).
If it rises above 133K, it's expected that prices will never fall below 43823.59 again.
Since the HA-Low indicator hasn't yet been created on the 1M chart, we need to monitor whether it appears when a downtrend begins.
Based on the current trend, the HA-Low indicator is expected to form around 73499.86.
More details will likely be available once the movement begins.
-
The basic trading strategy involves buying in the DOM(-60) ~ HA-Low range and selling in the HA-High ~ DOM(60) range.
However, if the price rises above the HA-High ~ DOM(60) range, a step-up trend is likely, while if the price falls below the DOM(-60) ~ HA-Low range, a step-down trend is likely.
Therefore, the basic trading strategy should be a segmented trading approach.
The further away from the HA-High indicator, the more likely it is that the DOM(60) indicator will act as a strong resistance when it forms.
Therefore, if the current price and the HA-High indicator are trading far apart, and the DOM(60) indicator forms, it is expected to face significant resistance.
-
Looking at the current trend formation, the high trend line is drawn correctly, but the low trend line is not.
This is because the StochRSI indicator failed to enter the oversold zone.
Therefore, the low trend line is marked with a dotted line, not a solid line.
Therefore, what we should pay attention to is the high trend line.
We need to see if the uptrend can continue along the high trend line.
-
(1D chart)
If we use the trend lines drawn on the 1M, 1W, and 1D charts to predict periods of volatility, the periods around August 5th and August 13th are significant periods of volatility.
By breaking this down further, the volatility periods are around July 31st, August 2nd-5th, and August 13th.
Therefore, trading strategies should be developed based on the assumption that the volatility period extends from July 30th to August 14th.
The current price is moving sideways in the 115,854.56-119,177.56 range.
This range, the HA-High ~ DOM (60), is a crucial area to consider for support.
This will determine whether the price will continue its upward trend by rising above 119,177.56, or whether it will turn downward by falling below 115,854.56.
If the price falls below 115854.56, it is expected to meet the M-Signal indicator on the 1W chart and reestablish the trend.
The HA-High indicator on the 1W chart is forming at 99705.62, and the DOM (60) indicator on the 1W chart is forming at 119086.64.
Therefore, when the price declines, it is important to check where the HA-High indicator on the 1W chart forms and determine whether there is support near that point.
-
The On-Board Value (OBV) indicator within the Low Line ~ High Line channel is showing a downward trend.
If the OBV falls below the Low Line, the price is expected to plummet.
Therefore, it is necessary to closely monitor the movements of the OBV indicator.
The Trend Check indicator is a comprehensive evaluation of the StochRSI, PVT-MACD Oscillator, and On-Board Value (OBV) indicator.
The TC (Trend Check) indicator interprets a rise from the 0 point as a buying trend, while a decline indicates a selling trend.
In other words, a rise from the 0 point is likely to indicate an uptrend, while a decline is likely to indicate a downtrend.
Currently, the TC (Trend Check) indicator is below the 0 point, suggesting a high probability of a downtrend.
However, if the TC (Trend Check) indicator touches a high or low, the trend may reverse.
In other words, touching a high increases the likelihood of a reversal from an uptrend to a downtrend, while touching a low increases the likelihood of a reversal from a downtrend to an uptrend.
When such movements occur, it's important to consider the support and resistance levels formed around the price level to determine a response.
In other words, consider the support and resistance levels formed at the current price level.
As a significant period of volatility approaches, prepare to transition from box trading to trend trading.
-
Thank you for reading to the end.
I wish you successful trading.
--------------------------------------------------
- Here's an explanation of the big picture.
(3-year bull market, 1-year bear market pattern)
I'll explain more in detail when the bear market begins.
------------------------------------------------------
BTCUSDT | Bitcoin needs liquidity to be able to go up more🚀 Trade Setup Details:
🕯 #BTC/USDT 🔽 Sell | Short 🔽
⌛️ TimeFrame: 1H
--------------------
🛡 Risk Management:
🛡 If Your Account Balance: $1000
🛡 If Your Loss-Limit: 1%
🛡 Then Your Signal Margin: $1204.82
--------------------
☄️ En1: 118829.28 (Amount: $120.48)
☄️ En2: 119162.54 (Amount: $421.69)
☄️ En3: 119400.34 (Amount: $542.17)
☄️ En4: 119638.61 (Amount: $120.48)
--------------------
☄️ If All Entries Are Activated, Then:
☄️ Average.En: 119283.83 ($1204.82)
--------------------
☑️ TP1: 118025.43 (+1.05%) (RR:1.27)
☑️ TP2: 117427.5 (+1.56%) (RR:1.88)
☑️ TP3: 116671.89 (+2.19%) (RR:2.64)
☑️ TP4: 115717.73 (+2.99%) (RR:3.6)
☑️ TP5: 114673.35 (+3.87%) (RR:4.66)
--------------------
❌ SL: 120276.34 (-0.83%) (-$10)
--------------------
💯 Maximum.Lev: 66X
⌛️ Trading Type: Swing Trading
‼️ Signal Risk: ⚠️ High-Risk! ⚠️
🔎 Technical Analysis Breakdown:
This technical analysis is based on Price Action, Elliott waves, SMC (Smart Money Concepts), and ICT (Inner Circle Trader) concepts. All entry points, Target Points, and Stop Losses are calculated using professional mathematical formulas. As a result, you can have an optimal trade setup based on great risk management.
⚠️ Disclaimer:
Trading involves significant risk, and past performance does not guarantee future results. This analysis is for informational purposes only and should not be considered financial advice. Always conduct your research and trade responsibly.
💡 Stay Updated:
Like this technical analysis? Follow me for more in-depth insights, technical setups, and market updates. Let's trade smarter together!
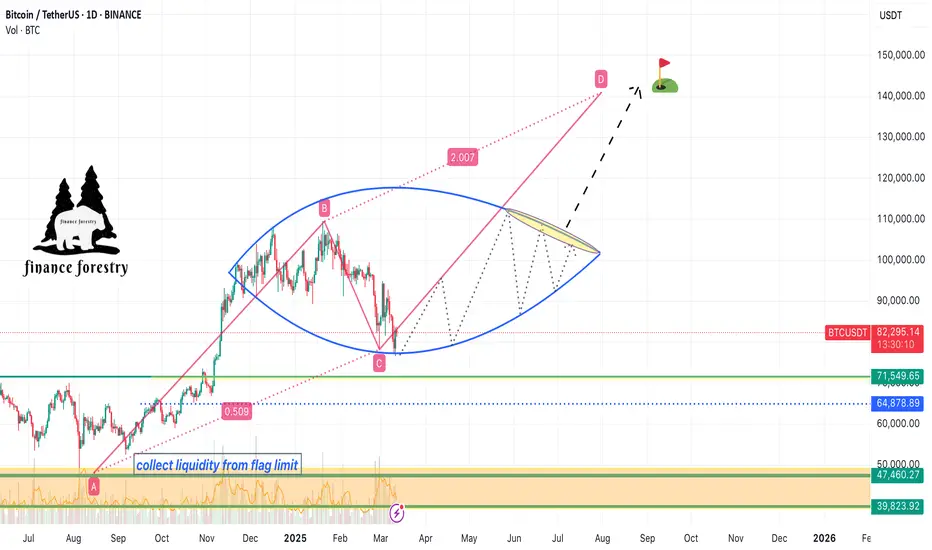
Bitcoin's Natural Correction and the $141K Target Based on Fibonhello dear trader and investors
The cryptocurrency market is always accompanied by strong fluctuations and natural corrections. Bitcoin, as the market leader, requires corrections and liquidity accumulation after each significant rally to pave the way for higher price targets. In this article, we analyze Fibonacci structures and harmonic patterns to demonstrate that Bitcoin's next target could be $141K.
1. Bitcoin Corrections: A Natural Part of an Uptrend
Price corrections in bullish trends are a normal phenomenon that helps shake out weak hands and allows major players to accumulate liquidity. Historically, Bitcoin has experienced 20-30% corrections before resuming its upward trajectory. The current correction is no different and may serve as a base for the next strong move toward higher targets.
2. The $141K Target Based on Fibonacci
Fibonacci levels are among the most reliable tools for predicting price targets. Assuming Bitcoin's recent high was around FWB:73K and the ongoing pullback is a healthy retracement, we can use harmonic AB=CD pattern to project potential upside targets. Based on these levels, Bitcoin could reach $141K in the next bullish phase.
Confirmation Through Harmonic Patterns
Harmonic patterns like Butterfly and Gartley suggest that the current correction is forming a potential reversal structure. If this correction completes within the PRZ (Potential Reversal Zone), Bitcoin could see a strong continuation of its uptrend. The Fibonacci ratios in these harmonic structures indicate that the final price target for this bullish wave could be around $141K.
Volume and Liquidity: Key Drivers for the Rally
Bitcoin needs increased volume and liquidity inflows to reach higher levels. On-chain data shows that trading volumes are rising and large investors (whales) are accumulating rather than selling. This behavior typically precedes a strong bullish move.
Bitcoin's current correction is entirely natural, and technical structures suggest that it could be laying the foundation for a new bullish wave. Based on Fibonacci and harmonic pattern analysis, Bitcoin's next major target is around $141K. Traders and investors should consider these levels in their analysis and avoid emotional decisions during market corrections
good luck
mehdi
BITCOIN → Correction within a downward channel. 112K or 125K?BINANCE:BTCUSDT is consolidating. However, a local downward trading range is forming relative to the current setup. What is the probability of a correction continuing to 112K or growth to 125K?
Daily structure: a local correctional channel within a global bullish trend. We have cascading resistance at 119.2, 119.6, 120, and 120.8. It will be quite difficult to break through this zone on the first attempt, but MM can use it to form traps and collect liquidity.
At the bottom, everything is simpler — a breakdown of the local bullish structure, the formation of an intermediate minimum, below which there is a void down to 112K.
Yesterday, relative to 115-116K, mm staged a massacre (trap) on both sides of the market.
Liquidity collection, return to the range, and growth. The reaction to the false breakdown of support is quite strong. Since the opening of the session, Bitcoin has been heading towards resistance, but there may not be enough potential to break through the upper resistance conglomerate, so I expect to see a pullback or decline to 116-115-114.
Resistance levels: 119.2, 120.1, 120.85
Support levels: 116.37, 115.67, 112
Technically and fundamentally, I do not see any drivers that could support the market (I am talking about Bitcoin, since the driver for altcoins is the decline in Bitcoin's dominance). It is possible that this may appear later. In the current situation, I am considering a false breakout and correction, as the market has not yet finished consolidating or correcting, and the current downward trading range may be extended.
PS: As the price moves towards resistance, it is necessary to monitor the reaction. The market itself will show what it is preparing for...
Best regards, R. Linda!

btc buy midterm"🌟 Welcome to Golden Candle! 🌟
We're a team of 📈 passionate traders 📉 who love sharing our 🔍 technical analysis insights 🔎 with the TradingView community. 🌎
Our goal is to provide 💡 valuable perspectives 💡 on market trends and patterns, but 🚫 please note that our analyses are not intended as buy or sell recommendations. 🚫
Instead, they reflect our own 💭 personal attitudes and thoughts. 💭
Follow along and 📚 learn 📚 from our analyses! 📊💡"
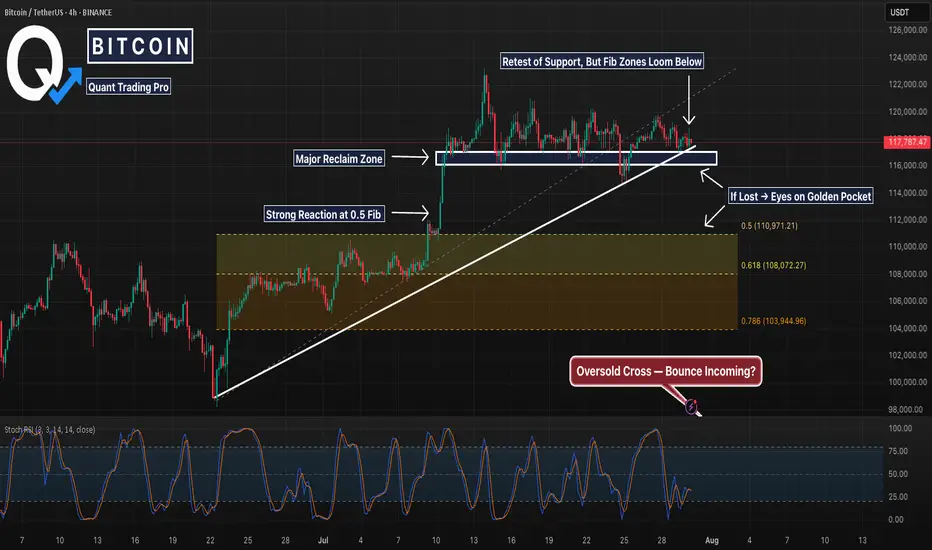
BTC 4H – Retest Holding, But Golden Pocket BelowBitcoin’s 4H chart is at a key decision point. After a strong breakout in early July, price has been consolidating just above the prior resistance zone — now acting as support. This white box represents a major reclaim level that has held multiple times, but buyers are starting to look fatigued.
Below this support lies a clean Fibonacci retracement zone:
0.5 at 110,971
0.618 (Golden Pocket) at 108,072
0.786 deeper pullback at 103,945
The structure remains intact for now, but a loss of the current level could trigger a deeper sweep into one of these fib levels — especially with momentum (Stoch RSI) resetting from oversold.
A potential bounce here keeps the uptrend alive. However, if the zone breaks, the .618 area may be the magnet.
📊 Watching for:
Strong reaction or absorption at this support
Bullish divergence forming
Sweep into golden pocket followed by reversal structure
This setup blends price action, key S/R levels, and Fib confluence — a great chart for anticipating the next move, not reacting to the last one.
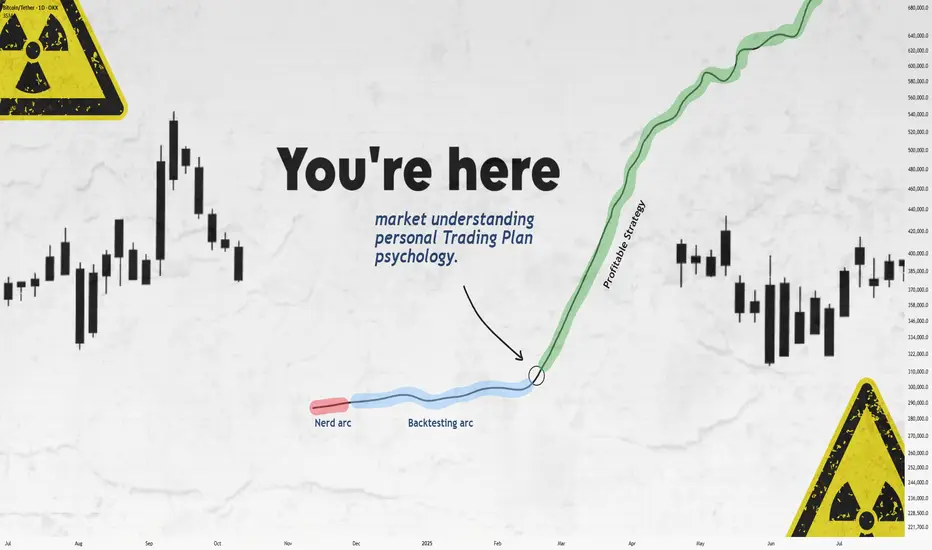
Still Losing After Backtesting? This Fixed It.Let’s get straight to it.
If you’ve gone through the "nerd arc" and the "backtesting arc" but still aren’t profitable...
What’s the fix?
In this short write-up, I’ll walk you through 3 brutal truths that made me finally see green.
Is it hard?
UH—Damn right.
But let’s go 👇
1. Market Understanding
This isn’t something you "learn" from a course.
It’s something that clicks after dozens of stop losses and live trades.
Here are a few ways I got more comfortable with it:
1. Don’t fear opening trades or hitting stop loss.
Each trade gives you data. More trades = more experience = better market feel.
What’s the requirement? Capital and risk management. Without that, you won’t even survive long enough to "get" it.
2. Journaling every single trade.
Write everything: your thoughts, screenshots, feelings — before and after.
Too lazy to do it? Left trading. Simple.
3. Be the detective.
Read the chart like a story. No, seriously.
Think of Bitcoin as a character with real moods.
Every candle tells you something.
That 5% pump? Buyers pushing up. Then bears smacked it down — candle closed red.
Now price is bleeding again.
Why?
🔍 Be the detective.
4. Analyze the market every day — even without trading.
The more you observe, the more you see. Structures. Patterns. Behavior.
Easy? Nah.
It takes discipline — like posting one story text to Insta for 1,000 days straight. Still wanna try?
2. Personal Trading Plan
Remember how I said "don’t fear opening trades"?
Well — after you’ve opened a bunch, you can start tailoring your own trading plan based on you.
This isn’t a PDF you can steal off Google.
Only after seeing how you behave in trades, you’ll know what rules make sense.
Maybe:
"I don’t trade when I’m emotionally off."
"This setup gave me the best results over 100 trades."
Just don’t copy-paste someone else’s rules.
Make a flexible structure, then let the details emerge from the market and your own experience.
Now —
Take a deep breath.
When was the last time you enjoyed your coffee?
More than a day ago?
Go make one now.
Might not get to taste it tomorrow.
Not everything in life is trading :)
3. Psychology
Ah, the final boss.
Still my weakest area, honestly.
But here are a few real things that helped:
Tip 1: WRITE.
Just write whatever you feel.
Telegram saved messages? Notebook?
Or if you're like me (🧠nerd), Notion.
Do it for 60 days straight — then feed that journal to ChatGPT and analyze yourself.
Takes time, but the patterns you'll see are... magical.
Tip 2: Money & Risk Management.
When you know your stop loss means only -0.25% of your capital…
why should you panic?
For me:
I place the SL, set a TP alert, and leave the screen.
No emotions, no fear.
Why? Because when capital is protected, so is my psychology.
Truth is, trading emotions aren’t just during the trade — they live in your head all day.
When your mental energy’s drained?
You’ll miss A+ setups.
Fall for BS ones.
Lose focus.
It’s complicated.
Because humans are complicated.
Our brains are the most tangled system known.
And somehow, out of all that noise, consciousness emerges.
A miracle.
So don’t expect to always feel calm.
Just aim to get better.
That’s it.
Thanks for sticking around.
These are just my thoughts, from one tired trader to another 🧠
I’m no expert—just sharing what’s worked (and what hasn’t).
If it helped, a boost would mean a lot.
🚫 Don’t FOMO
✅ Manage your capital
Until tomorrow —
Peace out. ✌️
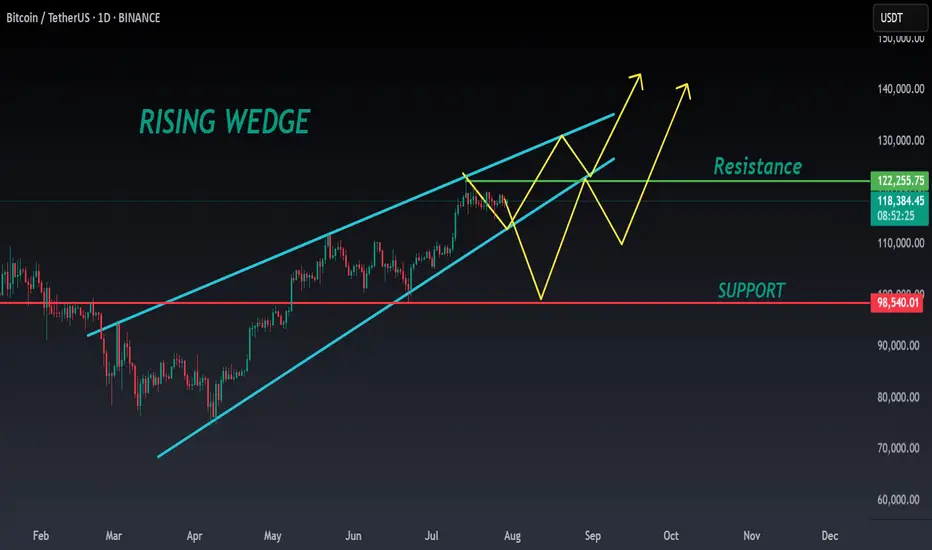
BTC ANALYSIS🔮 #BTC Analysis 💰💰
🌟🚀As we said #BTC performed same. Now, In daily chart we can see a formation "Rising Wedge Pattern in #BTC. There is a strong resistance zone and we could see a rejection from that level but if the price breaks the resistance zone then we would see a bullish move 💲💲
🔖 Current Price: $1,18,590
⁉️ What to do?
- We have marked some crucial levels in the chart. We can trade according to the chart and make some profits in #BTC. 🚀💸
#BTC #Cryptocurrency #DYOR #PotentialBreakout
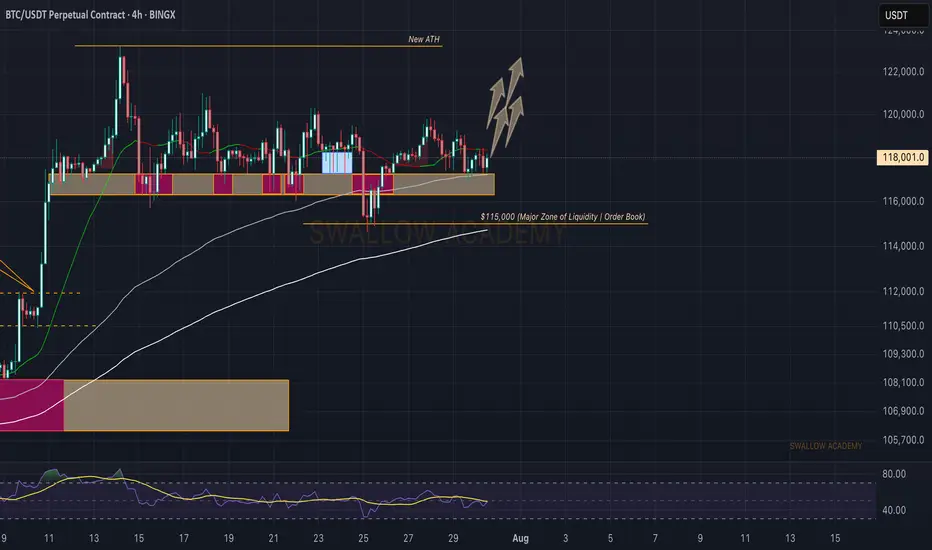
Bitcoin (BTC): Still Above Local SupportIt's been a choppy week so far but BTC is still above the local support zone, which means we are still bullish and the bullish sentiment has not disappeared (for now, at least).
We wait for and mostly keep an eye on that middle line of BB (Bollinger Bands) for now. The order book is our friend currently as well with all those liquidity hunts taking place!
Swallow Academy
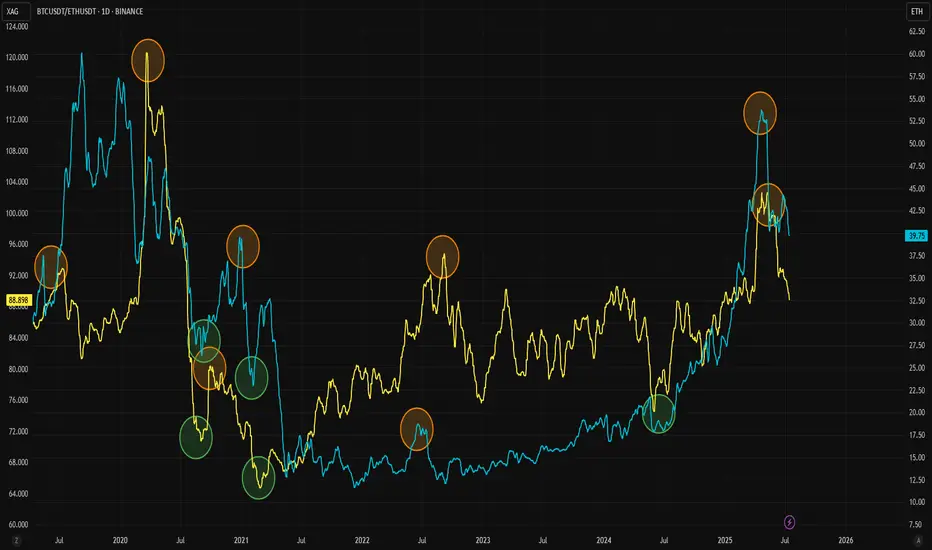
Want to Know What Happens in Crypto? Check Silver InsteadThe Gold/Silver ratio is one of the key indicators that highlights major turning points in modern economic history. Similarly, the ETH/BTC ratio is widely followed as a gauge of strength in the crypto market and the beginning of altcoin seasons. Interestingly, these two ratios also appear to correlate well with each other.
As adoption of both Ethereum and Bitcoin has grown, the Gold/Silver and BTC/ETH ratios have started to move more closely together. They often follow similar patterns, with tops and bottoms forming one after the other. For clarity, this analysis uses the BTC/ETH ratio rather than ETH/BTC.
Historically, BTC/ETH tends to lead during market tops, followed by a similar move in the Gold/Silver ratio. This pattern has been observed repeatedly since 2020. When it comes to bottoms, the timing between the two ratios is usually tighter, as seen during the 2020, 2021, and 2024 lows.
The latest signal came from a top in the BTC/ETH ratio, and the Gold/Silver ratio now appears to be following that move. Given the cyclical nature of crypto markets, both ETH and silver could be at the early stages of new upward trends. For a potential trend reversal, it may be wise to keep a closer eye on silver in the coming weeks.
BTC/USDT Analysis — Hidden Buyer
Hello everyone! This is the daily analysis from the CryptoRobotics trading analyst.
Yesterday, Bitcoin continued its move toward the local low and formed a false breakout.
Throughout the decline, we observed a positive delta, which may indicate gradual accumulation of long positions. At the same time, the descending trendline has not yet been broken, and there was strong absorption of market buys around ~$118,400 and ~$118,800 — which makes entering long positions very risky at the moment.
Our main expectations are based on further rotation within the range marked in yesterday’s analysis. In the short term, we are watching for a test of two local zones to assess the reaction from sellers. If the reaction is weak, a test of the upper boundary of the new sideways range is quite possible.
Buy zones:
$116,200–$115,000 (volume anomalies)
$110,000–$107,000 (accumulated volume)
Sell zones:
~$118,400 and ~$118,800 (local resistances)
This publication is not financial advice.
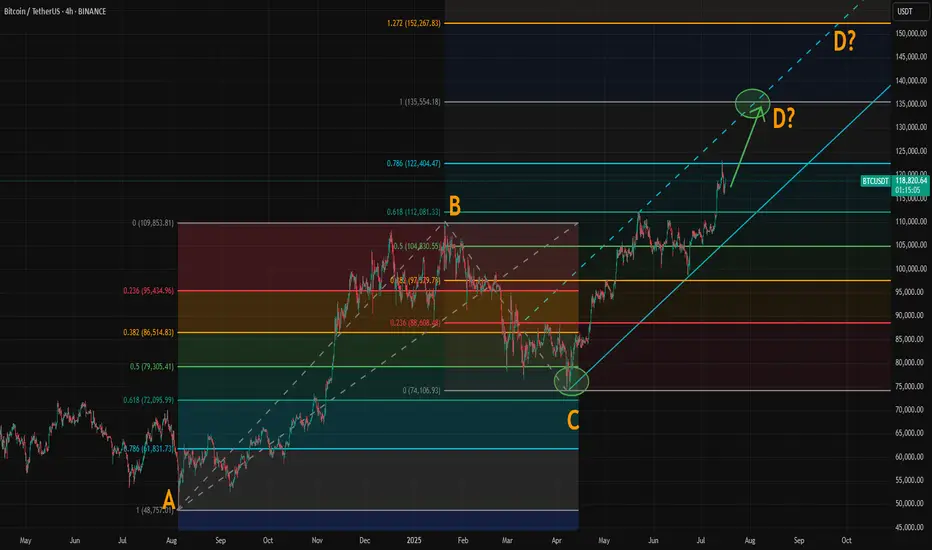
Where Could Bitcoin Make Its Cycle Top? Model and ABCD AlignedWith the breakout above resistance around 110,000, Bitcoin’s rally appears to be back on track. If you've been following our crypto analysis, either here or on our website, you’ll know our target range for this bull cycle is between 135,000 and 150,000, with the top of the range possibly extending further depending on the strength of the final wave.
Now, a possible ABCD pattern is forming, with point D potentially landing at either 135,000 or 150,000. A coincidence? Maybe, maybe not.
How Did We Arrive at the 135K–150K Target?
We based this range on historical halving cycle returns:
Halving Year - Return to Cycle Top
2012 - 9,076%
2016 - 2,122% (↓ 4.27x)
2020 - 541% (↓ 3.92x)
Two things stand out:
Each cycle has shown diminishing returns.
The rate of decline appears roughly consistent, dropping by around 4x each time—but slightly less with each cycle.
So depending on the multiplier used:
If returns fall by 4.27x again → target: 135K
If reduced by 4x → target: 140K
If reduced by 3.92x → target: 142K
If the rate of reduction itself slows (difference of 0.35 between 4.27 and 3.92) → target: 150K
While the sample size is too small, we believe the model holds reasonable logic with fundamental backing from various metrics.
The chart now shows a possible ABCD pattern:
If it becomes a classic AB = CD structure, point D could form near 135K.
If it becomes an extended ABCD (with CD = AB × 1.272), then point D could reach just above 150K.
These technical targets align closely with our halving model projections, increasing our confidence in the 135K–150K range as a likely top zone for this cycle.
Also, please check our earlier post for possible altseason start. A correlation between BTC/ETH and Gold/Silver might give some tips about possible Ether surge.
Bitcoin Retests Broken Trendline Minor Resistance in Focus!Bitcoin has recently taken support from the lower levels and moved upward, successfully breaking above a key trendline resistance. Currently, the market appears to be forming another minor trendline resistance on the short-term chart. Interestingly, the previous trendline that was broken is now acting as a support zone, indicating a potential shift in market structure.
If the price manages to break this newly developing minor trendline resistance, we may expect a possible retest of that level. Should the retest hold, it could provide a strong bullish signal, allowing Bitcoin to continue its upward movement toward higher liquidity zones or resistance levels.
Accroding to VSFA+ long turm BTC Asalam-o-Alikum All,
Accroding to VSFA+ Strategy BTC very soon big drop coming, BTC testing 90k to 95k price velue, Total market cap crashing so overall crypto coin's crashing toO so becareful...

BTC: Calm before the storm on market, or where we go?Sometimes the market is straightforward: there’s momentum, a trend, a clear direction. But other times—like now—there’s complete uncertainty. Over the past few days, Bitcoin has been trading in a tight range, lacking any pronounced momentum. The price moves back and forth, bouncing off local levels but not breaking out in any meaningful way.
📉 This is especially clear on the 4-hour chart: neither bulls nor bears can take control. Every move upward is quickly met with selling pressure, and attempts to drop are countered by buying. It’s like a “ping-pong” match in a sideways market.
📊 Indicators show low volatility and declining volumes, confirming that market participants are simply waiting. Likely, they’re anticipating an external trigger: news, macroeconomic events, interest rate decisions, ETF developments, or something else.
What could this mean?
Such conditions often precede a strong move. The question is—where to? Honestly, there’s no clear signal yet. Personally, I try not to rush in moments like these: if the market isn’t giving a clear direction, it’s better to take a pause.
That’s the essence of a professional approach: don’t trade just for the sake of trading, but wait until the market speaks more confidently.
What can you do now?
– Watch the range boundaries and wait for a breakout or trade bounces.
– Avoid entering positions based on emotions—pullbacks can be sharp and unexpected.
– Reduce trade sizes if you do enter, and set tight stops.
– Keep an eye on the news—sometimes even neutral news can spark a move.
Sometimes the best decision is to do nothing. This might be one of those times. In a sideways market, you’re more likely to lose than gain. But clarity almost always follows a consolidation.


Nothing Changed, Still BullishDO NOT FORGET USING A STOP LOSS
Warning:
This is just a suggestion and we do not guarantee profits. We advise you analyze the chart before opening any position.
I hope you are always profitable

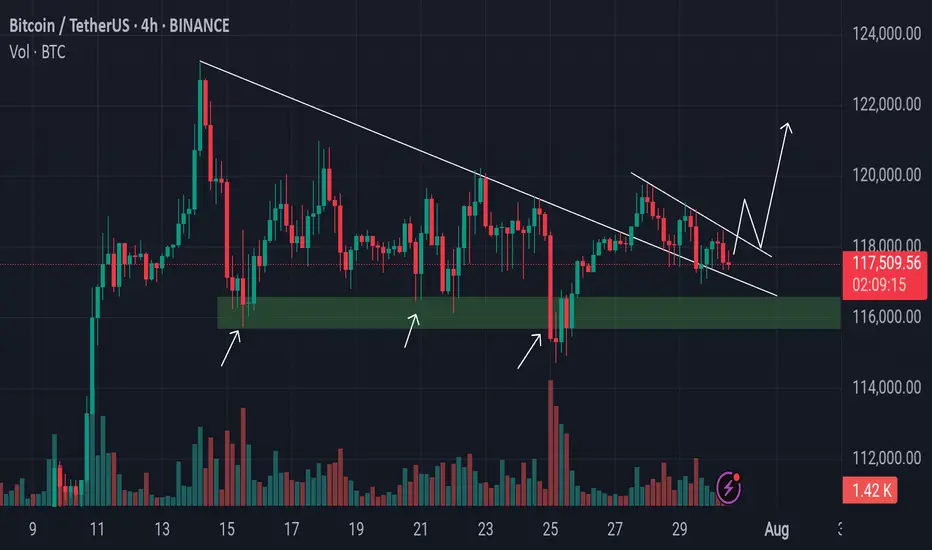
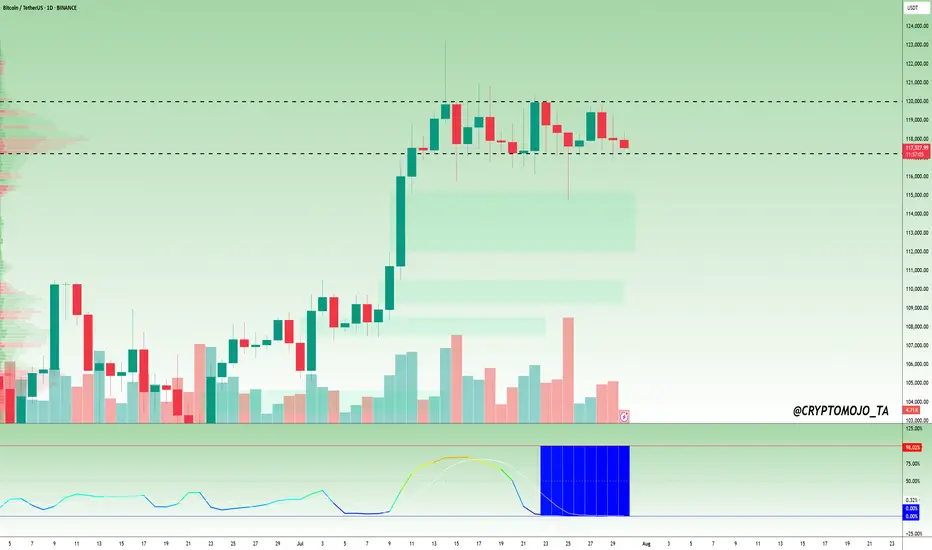
$BTC Daily Timeframe Update! #Bitcoin ( CRYPTOCAP:BTC ) is still moving sideways, consolidating in a tight range between ~$117,400 and $120,100, just below recent local highs. The market is showing clear signs of compression, and the BBWP (Bandwidth Width Percentile) is flashing a deep blue near 0%, which signals extremely low volatility.
Historically, this kind of BBWP reading comes before big price moves. However, the direction is still uncertain as BTC trades between key resistance and minor support.
Key Levels to Watch:
Resistance: ~$120,100
Support: ~$117,400
BBWP: ~0% tight volatility coil
If BTC breaks above $120K, it could lead to strong upside continuation. But if it drops below $117.4K, we might see a deeper correction.
📌 Tip: Wait for volume and BBWP expansion to confirm the next move. The spring is tightly wound, a big breakout is likely coming soon.
DYOR, NFA
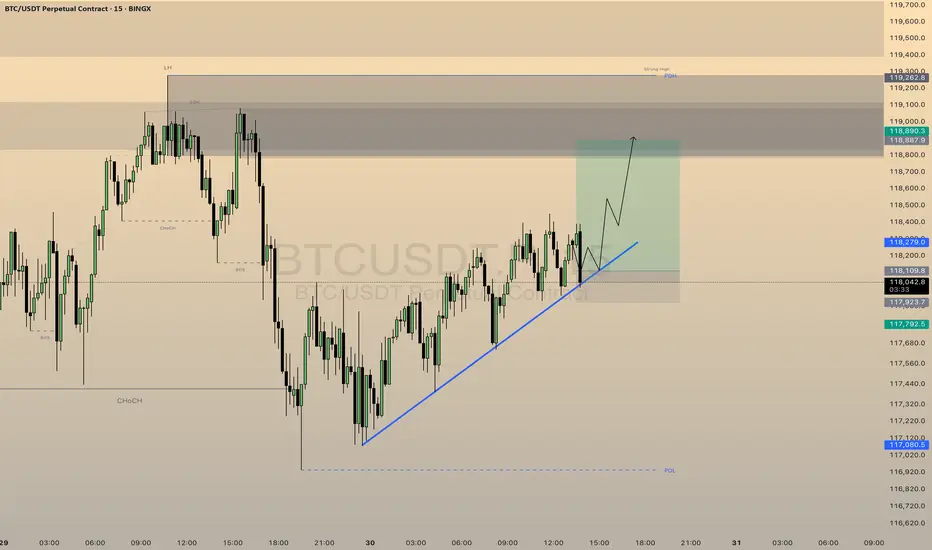
FUTURES SIGNALFUTURES SIGNAL
Coin: BTC
Direction: LONG
🟢Input range: 118109
✔️ТР: 118890
❌SL: 117923
We trade with the trend, stop at the minimums
BTC AI Prediction Dashboard - 6h Price Path (30.07.25)
Prediction made using Crypticorn AI Prediction Dashboard
Link in bio
BTCUSDT Forecast:
Crypticorn AI Prediction Dashboard Projects 6h Price Path (Forward-Only)
Forecast timestamp: ~10:45 UTC
Timeframe: 15m
Prediction horizon: 6 hours
Model output:
Central estimate (blue line): -118,306
Represents the AI’s best estimate of BTC’s near-term price direction.
80% confidence band (light blue): 118,086 – 118,670
The light blue zone marks the 80% confidence range — the most likely area for price to close
40% confidence band (dark blue): 117,520 – 119,603
The dark blue zone shows the narrower 40% confidence range, where price is expected to stay with higher concentration
Volume on signal bar: 80.50
This chart shows a short-term Bitcoin price forecast using AI-generated confidence zones.
Candlesticks reflect actual BTC/USDT price action in 15-minute intervals.
This helps visualize expected volatility and potential price zones in the short term.
