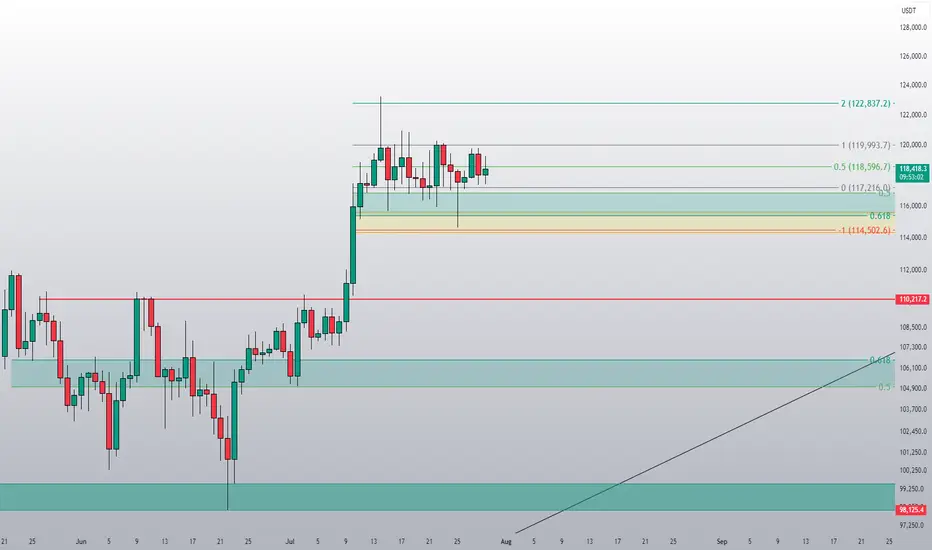
BTCUSD : Key levelsI added meaningful levels to my past forecast (I can't add a link to my last forecast by the way, because as it turns out I have to actively participate in other people's discussions, which I am unlikely to do. And if I do, then to be able to add links to my predictions. So you have to check my prev forecast in the my profile overview).
So far, all levels are inactive except for the ~116,600 level. It's still in play.
USDTBTC trade ideas

TradeCityPro | Bitcoin Daily Analysis #139Welcome to TradeCity Pro!
Let's go over Bitcoin's analysis. Today, Bitcoin is showing some signs regarding its next move, and today could be a critical day — especially considering that U.S. interest rate data is set to be released tomorrow.
4-Hour Timeframe
Today, there’s no need to switch to other timeframes — this 4-hour chart tells us everything.
Yesterday, the price was moving toward the 120041 area, which we intended to use as a long trigger, but that didn’t happen. The price failed to stabilize above this level, and RSI was rejected from the 61.67 zone.
Currently, the price has formed a lower high compared to 120041 and is now moving toward the support area around 116000.
Selling volume has significantly increased, which is not good for the bullish trend. If this support level breaks, deeper corrections to the 0.618 or even 0.786 Fibonacci levels could occur.
I’ll take profit on my long position that I opened from below 110000 if the price stabilizes below this zone, but I absolutely won’t open any short positions for now.
In my opinion, as long as the price is above 110000, any drop or correction is simply a better entry point for a long position. However, we shouldn’t buy during a falling market — we must wait for our triggers to activate.
Bitcoin is testing the boundaries of the triangle ┆ HolderStatBINANCE:BTCUSDT is printing higher lows along trendline support near $67,800. The price is compressing into a wedge below $69,000 resistance. A breakout would confirm continuation toward $71,000–$72,000. Momentum remains intact unless $67.5k is broken. The market is building pressure for the next impulsive move.
Bitcoin in 15minCaption important🛑🛑🛑
Hello to all traders. 😎😎
I hope all your deals will hit their targets. 🎉🎉
I’m opening a short position on Bitcoin from the current level, targeting $118,200 as the first take-profit, and $117,600 as the second target.
⚠️ This is a high-risk trade, so make sure to apply proper risk management.
What Do You Think?
Which scenario do you think is more likely to happen? **Share your thoughts!** ⬇️
Don't forget that this is just an analysis to give you an idea and trade with your own strategy. And don't forget the stop loss🛑🛑🛑
❤️❤️❤️The only friend you have in financial markets is your stop loss❤️❤️❤️
Please support me with your ✅' like'✅ and comments to motivate me to share more analysis with you and share your opinion about the possible trend of this chart with me 🙏😊
Be Happy , Ali Jamali

BTC/USDT Analysis — Potential Sideways Range
Hello everyone! This is the daily analysis from the CryptoRobotics trading analyst.
Yesterday, Bitcoin experienced a local reversal. At this point, two zones previously marked by us have been worked out:
Buy zone — $118,300–$117,300
Sell zone — $119,500–$119,000
We now expect continued rotation within the $117,400–$119,800 range, with potential expansion in both directions. The overall context remains positive, so a full breakout to the upside could occur in the near future.
Buy zones:
$116,200–$115,000 (volume anomalies)
$110,000–$107,000 (accumulated volume)
This publication is not financial advice.

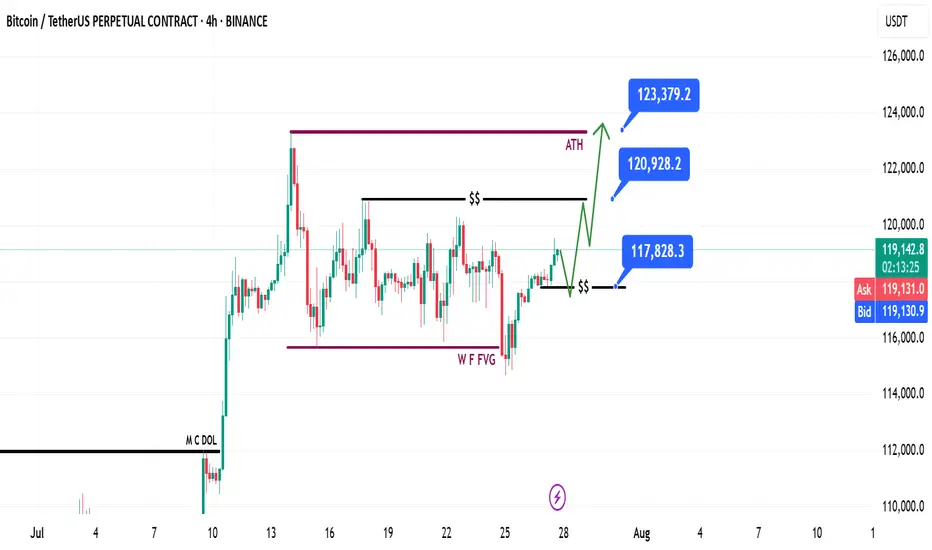
Bitcoin Weekly Recap & Gameplan | 27.07.2025📈 Market Context:
Bitcoin maintained its bullish momentum, driven by continued institutional demand and a supportive U.S. policy backdrop.
Last week’s gameplan played out well — solid profits were captured (see linked chart below).
🧾 Weekly Recap:
• Price made a bullish retracement into the Weekly FVG (purple line) exactly as projected in last week's post.
• From here, I expect continuation toward new all-time highs.
📌 Technical Outlook:
→ First, I expect a short retracement and a 4H swing liquidity grab at 117,828$.
→ Then, a strong continuation move toward ATH targets.
🎯 Setup Trigger:
Watch for:
✅ 4H liquidity sweep
✅ 15M–30M bullish break of structure (BOS)
This is the confirmation zone for potential long setups.
📋 Trade Management:
• Stoploss: Below confirmation swing low
• Targets:
– 120,938$
– 123,400$
💬 Like, follow, and drop a comment if this outlook helped — and stay tuned for more setups each week!
BTC/USDTWe are approaching the end of the Bitcoin bullish cycle, and the trend will change between $125k and $130k, and there will be a downward trend for several months.

The trend is your friend...BTC is moving within a clear range on the daily timeframe. Since we are in an underlying uptrend, the current range is bullish. A downside fakeout would be typical and could potentially fill the CME gap, but we would remain bullish.
BTCUSDT-4H {Now Eyes on the Buy-Side Sweep}BTC on the 4H chart just executed a classic liquidity grab at support, followed by a strong bullish push.
🔹 Descending trendline tapped multiple times (indicating compression)
🔹 Entry zone forming on retest of previous demand
🔹 Target: Buy-side liquidity above $123K
🔹 Volume + RSI divergence supports the bullish bias

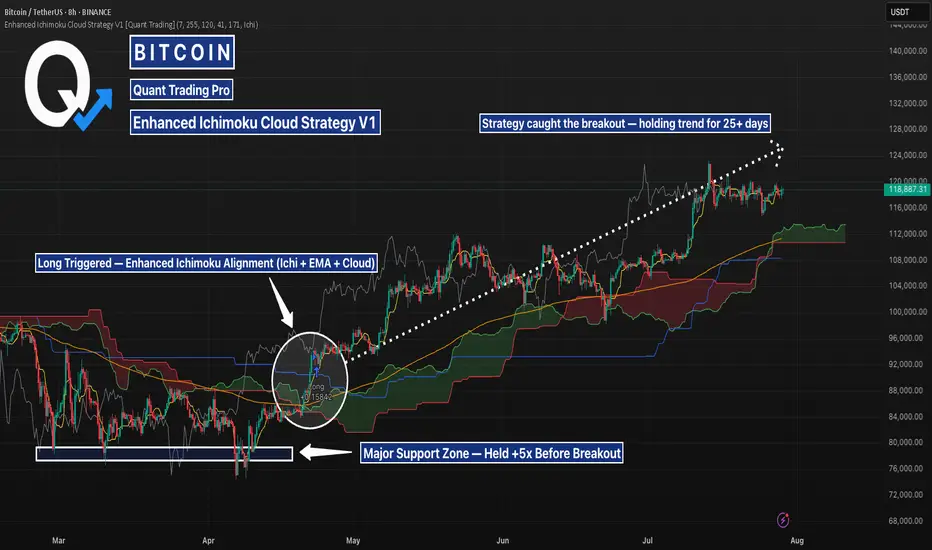
BTCUSD 8H – Long Triggered on Cloud Flip, Can This Trend Keep?This BTC 8H setup highlights how the Enhanced Ichimoku Cloud Strategy V1 caught a +27% move using clean trend confirmation and a low-noise entry.
📊 Setup Breakdown:
Major Support Zone held 5+ times between March and April — confirming buyer interest.
Entry triggered once:
Ichimoku Cloud flipped bullish
Price crossed the 171 EMA
Strategy alignment confirmed by Ichi + EMA + Cloud filters
Entry candle: ~$93,400
Current price: ~$119,000 → +27% trend continuation.
📈 Strategy Logic:
This system combines:
Custom Ichimoku (7 / 255 / 120 / 41) for cloud confirmation
A 171 EMA filter to block noise
A trend-following “state memory” logic to avoid premature reversals
This BTC move is a textbook example of how the strategy avoids second-guessing and holds strong trends without constant recalibration.
⚠️ What to Watch Next:
Price is currently ranging near prior highs
Cloud remains bullish, but RSI and momentum divergence should be monitored
If support holds above ~112K, continuation is likely — break below could shift structure
✅ Backtest this strategy on your charts to see how it handles your favorite assets.
It’s best used on high-timeframe trends where precision and conviction matter most.
Bitcoin (BTC): Aiming For Re-Test of ATH | $123KBitcoin is back in the bullish zone, where we had a good bounce from $115K, where we had a huge order sitting and since then we have been seeing continuous movement to upper zones.
We are looking for further movement from here towards the ATH zone, where we then expect some huge volatility to occur!
Swallow Academy

its not about historic, its just analysing of weekly behaviour hwhy both elips areas have same pattren
but first one use to liq longs & 2nd one use to sqeez shorts !
kindf rising wedge !
iits horrified!
134 & 139k heavy selling
Weekly trading plan for BitcoinLast week price followed our orange scenario. Right now, we're stuck in a sideways correction, and here's what matters:
1. $118K is the big level this week
Stay above it? Good chance we retest ATH
Break below with no recovery? That's trouble
2. If we lose $116,780 next → $112K becomes the target
I've got all the charts and details covered in this video idea—check it out for the full picture!

BITCOIN PREDICTION - MASSIVE CANDLE INCOMING!!! (WARNING) Watch this Bitcoin Prediction video now, you will love it!
Yello, Paradisers! Big warning sign: #Bitcoin is about to liquidate more traders soon if we get these confirmations that I'm sharing with you in this video. Loads of people will get wrecked again. Be careful not to get trapped into fakeouts.
In this video, I'm describing exactly what I'm seeing on Bitcoin, what patterns I'm waiting to form, and what confirmations I want to see before being able to say with 100% accuracy guaranteed that MARKETSCOM:BITCOIN is moving in that direction.
I'm sharing with you all the important targets and also how professional trading works: how risk-reward proper ratio trading works, and how high-probability trading depends a lot on how you choose to create your trades.
Watch this Bitcoin prediction to understand what I'm seeing right now on the chart and how I'm acting and making my decisions.

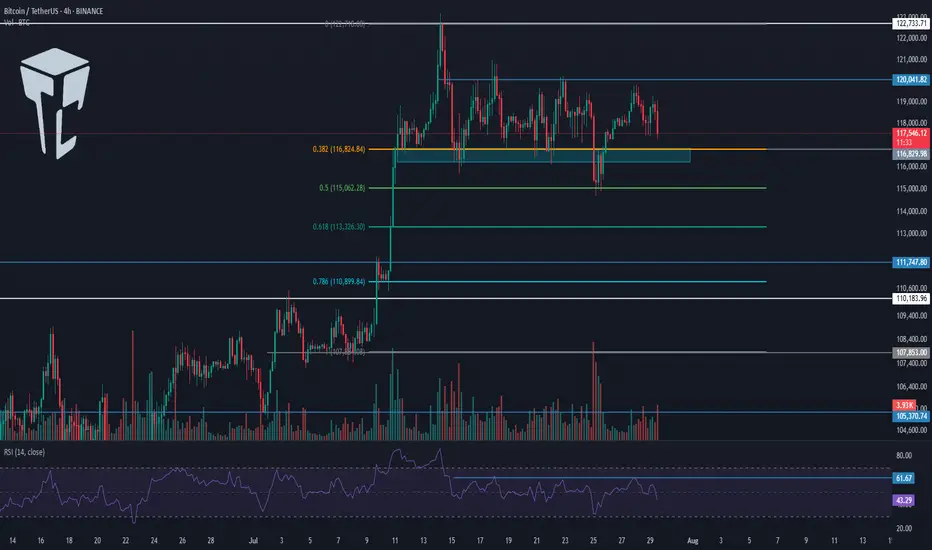
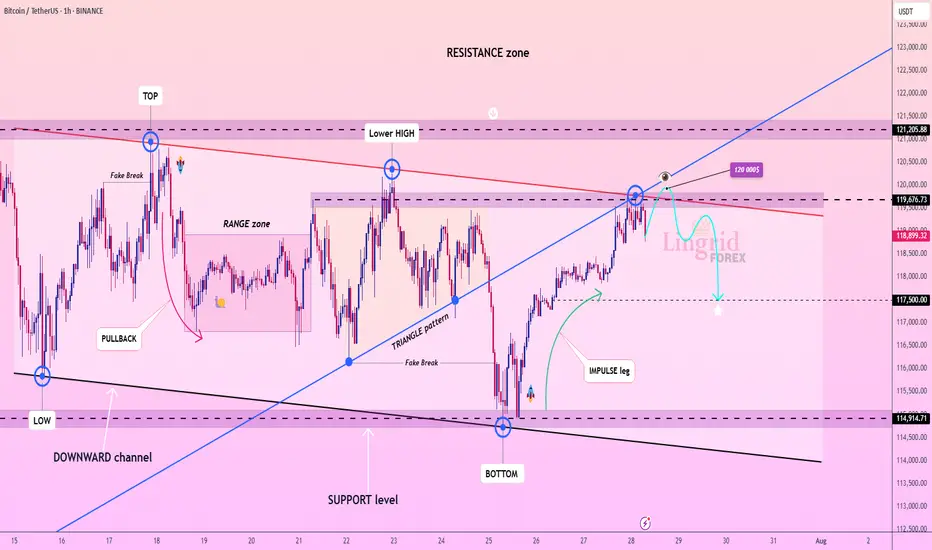
Lingrid | BTCUSDT Range-Bound Market: Short-Term Bearish MoveBINANCE:BTCUSDT has failed to break through the descending resistance near 120,000 and is now forming a lower high within the broader resistance zone. The price action follows an impulsive leg up and is currently tracing a potential reversal pattern under key structural resistance. As long as the market remains capped below 120,000, continuation toward 117,500 is likely. The downward bias is supported by weakening momentum after the bull trap and resistance rejection.
📉 Key Levels
Sell trigger: Breakdown below 119,000
Sell zone: 119,400 – 120,000
Target: 117,500
Invalidation: Break and close above 120,500
💡 Risks
Sudden bounce from the 119,000 handle could trap late sellers
Breakout above 120,000 would shift structure to bullish
Support near 117,500 may slow or reverse bearish pressure
If this idea resonates with you or you have your own opinion, traders, hit the comments. I’m excited to read your thoughts!
Multi-timeframe analysis, strong momentum, FOMC risk/reward plan__________________________________________________________________________________
Technical Overview – Summary Points
__________________________________________________________________________________
Strong momentum and bullish consensus confirmed across all timeframes.
Key support/resistance : 114k–116k (critical support), 123k (major pivot).
Healthy organic volume , no extreme peaks except isolated moments (30min/15min).
Risk On / Risk Off Indicator : Dominant bullish signal, neutral only on 15min.
Multi-timeframe structure : Perfect alignment daily/4H/2H/1H, caution on 15/30min (slight inflection but no abnormal divergence).
__________________________________________________________________________________
Strategic Summary
__________________________________________________________________________________
Global bias : Structural bull market, intact dynamic.
Opportunities : Tactical buys on pullbacks (114–116k), swing on breakout 123k.
Risk areas : Below 114k = risk of invalidation, targets 111k–105k.
Macro catalysts : FOMC imminent (high volatility expected), watch geopolitical tensions.
Action plan : Favor swing/cautious trading ahead of FOMC, dynamic stops, act on first post-Powell trigger.
__________________________________________________________________________________
Multi-Timeframe Analysis
__________________________________________________________________________________
1D : Active range 114k–123k; strong supports, momentum maintained; Risk On / Risk Off Indicator strongly bullish.
12H/6H/4H : Clean bullish structure, no excesses or divergence; price sits within major horizontal clusters.
2H/1H : Healthy impulse/correction phases; key intermediate supports 114.6k, 117.5k to watch.
30min/15min : Slightly weaker momentum but constructive microstructure, no immediate sell threat; localized volume spikes on support reactions.
ISPD DIV : No behavioral stress observed throughout.
Cross-timeframe summary : Bullish confluence dominant; caution on short-term reversals tied to FOMC and on-chain volatility spikes.
__________________________________________________________________________________
Multi-timeframe Cross Analysis & Decisional Rationale
__________________________________________________________________________________
As long as BTC > 114k = bullish bias, buying pullbacks, swing target 123k.
Active management post-FOMC strongly advised (enter/reduce after first H4 close).
Increased volatility risk in case of Fed/geopolitical shock; mandatory stops.
Sector momentum (Risk On / Risk Off Indicator) and volume underpin the bullish case unless exogenous alert.
Invalidation below 114k = prudent, neutral, or tactical shorts towards 111k–105k.
__________________________________________________________________________________
Macro, On-chain & Economic Calendar
__________________________________________________________________________________
FOMC July 29th : pivotal event, any surprise = strong intraday move (BTC sensitive to Powell speech).
US Macro: strong fundamentals but caution on trade war, inflation "contained."
On-chain : realized cap BTC >$1T, high open interest in derivatives = leveraged risk, beware speculative altcoin excess.
Global risk : market remains buyer until bearish Fed/geopolitical shock; swing trading favored, tight stops recommended.
__________________________________________________________________________________
Action plan
__________________________________________________________________________________
Favor buying/reloading on pullbacks to 114.6k–116k (stop <114k).
Break above 123k = bull confirmation, further extension likely to 126–128k depending on FOMC outcome.
Prioritize strict risk management; monitor liquidity/supports on macro/on-chain volatility peaks.
__________________________________________________________________________________

Daily BTC, ETH & Market Index Analysis💎🔥 Daily BTC, ETH & Market Index Analysis & What Comes Next? 🔥💎
Smash the 🚀, FOLLOW for daily updates, and drop your thoughts in the comments!📈💬
♦️ Hello everyone!
Here’s what you can expect from this page:
🟡 Every Day: BTC & ETH analysis + complete market index overview
🟡 Every Sunday: Top 10 Altcoin breakdown (excluding BTC & ETH)
🟡 🆕 Coming soon: Weekly Watchlist every Sunday!
💛Your likes and follows are what keep this crypto routine going 💛
⭕️ 24-Hour Market Crash – Summary for Crypto Traders
Let’s break down what happened 👇
1️⃣ A massive wave of liquidations in futures and derivatives triggered heavy selling pressure.
2️⃣ BTC Dominance dropped, but capital also exited altcoins and flowed into BTC – a clear fear response and move toward safer assets.
3️⃣ Institutional players reduced exposure to altcoins to limit risk, causing deeper price drops.
4️⃣ On Ethereum, over $2.3B ETH is queued for unstaking, raising the chance of near-term sell pressure.
5️⃣ Ongoing pressure from investor sentiment shifts and global uncertainty is pushing money out of high-risk assets like crypto.
6️⃣ ⚠️ But this is a technical correction, not a fundamental collapse. For long-term thinkers, this could be a buy-the-dip opportunity.
🔥❗️Heavy Crypto Sentiment Week Ahead
As mentioned yesterday, we’re at a critical point across key crypto indexes:
♦️ BTC, ETH, major altcoins, and indexes like BTC.D, USDT.D, TOTAL, TOTAL2, TOTAL3.
🚨 Tomorrow brings a major crypto-impacting event — the Fed interest rate decision.
Most forecasts suggest no change. However, with rising stock indexes, there’s no clear pressure to cut inflation.
Any unexpected comments or decisions by Powell may drive new waves in the crypto space.
♦️ BTC
🗓 Monthly candle closes in 2 days — be cautious around this point.
🔑 $120,300 is still the main breakout level.
If it breaks with BTC Dominance rising, altcoins may stall (unless paired bullishly with BTC).
If it breaks while BTC.D drops, expect strong altcoin momentum.
⚔️ Two scenarios for entries:
1️⃣ Entry at $119,500 – higher risk of getting stopped out but tighter SL.
2️⃣ Entry above $120,300 – more reliable but wider stop due to breakout wick.
🟡 Key Support: $115K–$117.3K – still valid, but repeated testing weakens the zone.
❗️❓️Why does it get weaker?
Because each test drains buy orders. Sellers eventually overwhelm this level as buyers lose firepower.
♦️ BTC Dominance (BTC.D)
Trend isn't clearly bullish yet, but the recent drop has slowed down.
Structure is shifting – two key levels to watch:
1️⃣ 60.83 – rejected yesterday.
2️⃣ 60.42 – if this breaks down, alts may push higher.
♦️ TOTAL (Crypto Market Cap)
Stuck at the $3.91T resistance.
💥 Breakout = strong volume and momentum injection. Be positioned accordingly.
♦️ TOTAL2 (Altcoins excl. BTC)
At the $1.53T key level – breakout or rejection will shape altcoin direction.
♦️ TOTAL3 (Altcoins excl. BTC & ETH)
Still eyeing the $1.08T resistance zone.
♦️ USDT Dominance (USDT.D)
If 4.44% breaks and holds – bullish structure in BTC & alts will be in danger.
Until then, focus on long setups.
📌 Make sure you’re positioned before 4.13% breaks — alts typically begin moving before that confirmation.
♦️ ETH/USDT
If ETH closes below $3,480, expect extended correction or range.
♦️ Trading Outlook
1️⃣ Today may be quiet – market awaits reaction to tomorrow’s index events (Fed, BOJ, Powell).
2️⃣ These updates can create new moves or shift bias toward short setups.
💎 If this helped your crypto planning, hit the 🚀, FOLLOW for more daily setups, and share your thoughts in the comments! 🔥📊

BTC Accumulation, Bullish Breakout Signs💎 BTC PLAN UPDATE
1. Key Chart Features:
Currently, the BTC/USD price is at $118,893.
The chart shows a strong upward trend recently, and we are seeing accumulation with short-term corrections.
2. Fibonacci Levels:
The Fibonacci retracement levels are drawn from the lowest point ($114,460) to the highest point ($119,809).
At the moment, the price is hovering near the 0.5 retracement level ($113,000), which is a key support level.
If the price holds above this level, a rebound is likely.
3. Trendlines and Price Patterns:
The trendlines (dashed blue lines) are indicating a descending triangle pattern, which could lead to a breakout if the price surpasses resistance levels.
A potential Head and Shoulders pattern might be forming, though it is not yet clear and needs confirmation by breaking key resistance.
4. Breakout and Retest Zone:
The breakout zone (red area) is around $119,000.
If the price breaks and holds above this level, we may see a continuation of the uptrend toward the next target around $122,792 (Fibonacci 1.618 level).
After the breakout, the price might retouch (retest) this support area before resuming the upward movement.
5. Technical Indicators:
• Moving Averages (MA):
• The red MA (long-term) is below the current price, indicating a strong uptrend.
• The yellow MA (medium-term) is near the current price, providing support for the uptrend if it holds.
• RSI Indicator:
The RSI has not yet reached overbought levels, suggesting that the market still has potential to rise without being overheated.
6. Conclusion:
If the price breaks above the $119,000 resistance and maintains that level, BTC/USD could continue its strong bullish trend, potentially targeting $122,792 or even $127,941.
Note: If the price fails to hold above $119,000 and drops back below, a pullback to the nearest support level at $114,460 may occur.
BTC AI Prediction Dashboard - 6h Price Path (29.07.25)
Prediction made using Crypticorn AI Prediction Dashboard
Link in bio
BTCUSDT Forecast:
Crypticorn AI Prediction Dashboard Projects 6h Price Path (Forward-Only)
Forecast timestamp: ~09:00 UTC
Timeframe: 15m
Prediction horizon: 6 hours
Model output:
Central estimate (blue line): -118,729
Represents the AI’s best estimate of BTC’s near-term price direction.
80% confidence band (light blue): 118,724 – 119,346
The light blue zone marks the 80% confidence range — the most likely area for price to close
40% confidence band (dark blue): 118,151 – 119,894
The dark blue zone shows the narrower 40% confidence range, where price is expected to stay with higher concentration
Volume on signal bar: 95.57
This chart shows a short-term Bitcoin price forecast using AI-generated confidence zones.
Candlesticks reflect actual BTC/USDT price action in 15-minute intervals.
This helps visualize expected volatility and potential price zones in the short term.

BTC Trade Plan: Watching for Break and Retest Above Daily Range🟠 Bitcoin (BTC) is currently trading range-bound on the daily timeframe ⏳📉📈. I’m monitoring price action for a bullish break and retest 🔓🔁 of the current range to confirm a potential long entry 🎯.
📍 Key levels are already marked on the chart 🗺️—
🛑 Stop-loss would sit just below the previous swing low,
🎯 Target aligns with the higher price zone marked out to the left of the chart 🔼👈.
This is a classic range breakout setup—patience and precision are key.
🧠 As always, this is not financial advice.

Hunting for liquidity. Retest resistance before a fallBitcoin is still in correction, but is rebounding from the local low of 117.4, formed during the pullback, and is heading back up towards the zone of interest at 119.8-120.1, which it did not reach during the main upward movement. I see no fundamental or technical reasons for the correction to end and for growth beyond 121K. I expect a rebound from the resistance zone towards 115-114K. However, in the medium term, I expect the market to attempt to close half or all of the gap between 112K and 114.8K, thereby expanding the key trading range.
Resistance levels: 119.77, 120.1K, 120.8K
Support levels: 117.4, 116.37, 115.68
Technically, a false breakout (liquidity capture) of key resistance and price consolidation in the selling zone could trigger bearish pressure on the market, which in turn would lead to a correction.

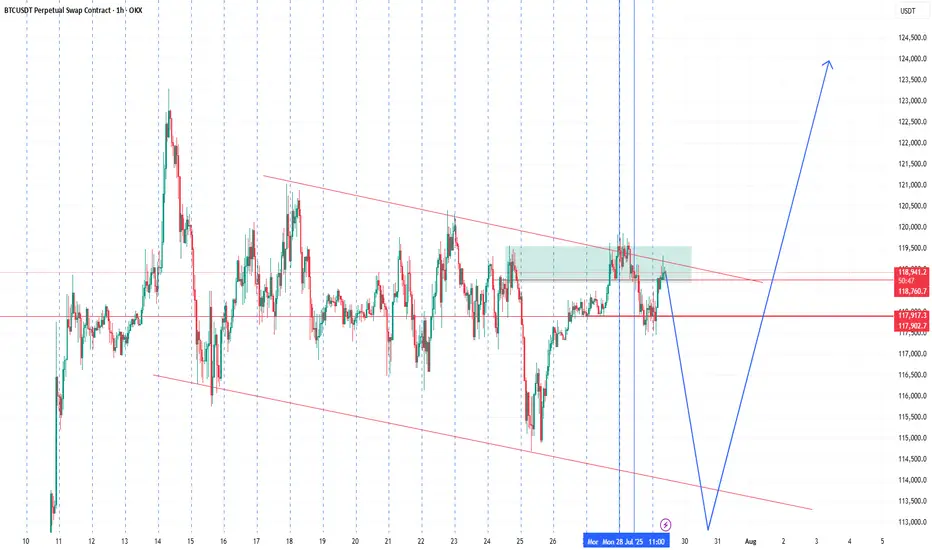
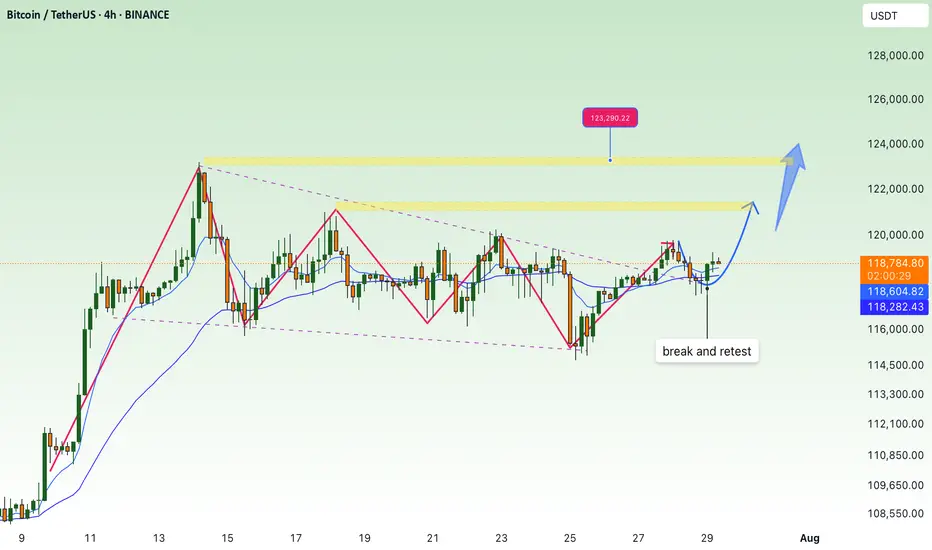
#BTC Update #11 – July 29, 2025#BTC Update #11 – July 29, 2025
Bitcoin continues to move within the channel and has completed several corrections of its last impulsive move. It is currently undergoing a correction within a correction. There was a liquidation zone around the $117,000 level, which was mostly filled, triggering a reaction.
From what we can observe now, Bitcoin is facing rejection from the upper boundary of the channel. If it manages to break out of the channel and continue its climb, I believe it will target the high liquidity zone near $122,000.
At this stage, Bitcoin is not in a suitable position for either long or short trades.

BTC OUTLOOK Bitcoin returns to $119,000 after a CME gap fill as new Galaxy Digital exchange transactions fail to sway the market mood.
Nerves over “OG” BTC sales seem to have passed after last week’s 80,000 BTC transaction.
Trading circles still see the potential for another BTC price dip.