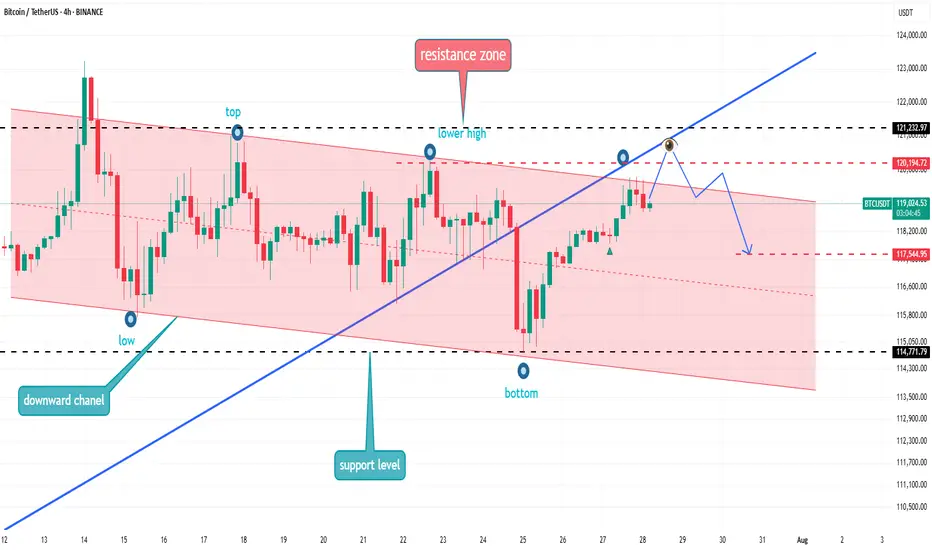
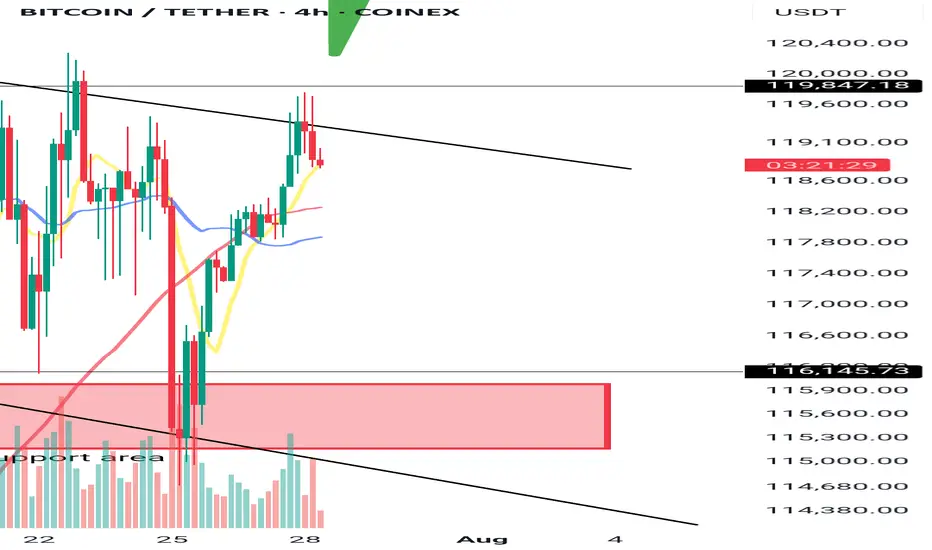
BTCUSDT 4H Chart UpdateBitcoin has successfully broken out of the descending wedge, retested the support zone near $117K, and is now showing signs of a bullish continuation.
If momentum holds, price could aim for the $122K–$124K range next.
Structure remains bullish as long as it stays above the retest zone.
USDTBTC trade ideas

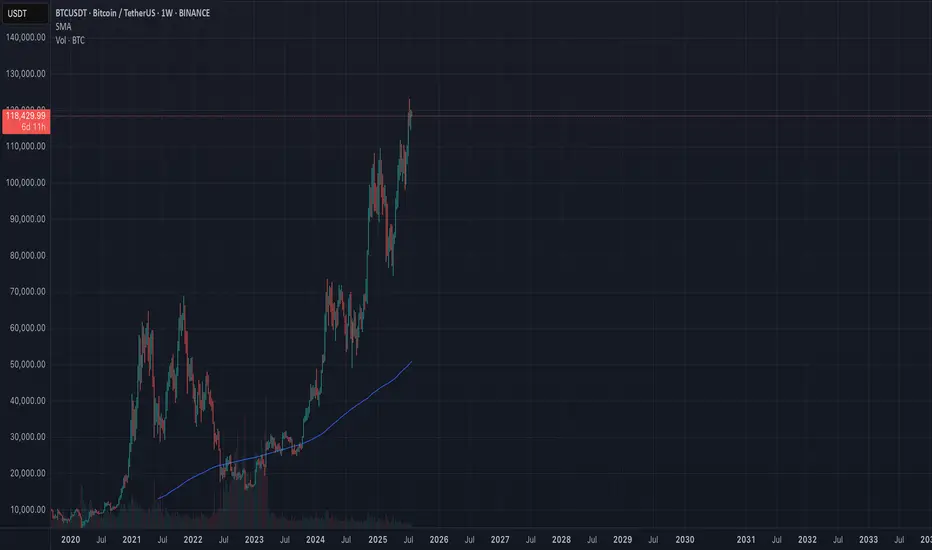
BTC 1W – Macro Trend with MA200Weekly chart of BTCUSDT showing long-term macro trend. MA200 helps identify bull vs bear market phases.
BTC Macro Trend ViewDaily chart of BTCUSDT with MA200 and volume. Used to monitor short-term market structure and trend support.

BTCUSDT LongAfter respecting the 200EMA i´m exspecting more bullish momentum. My TP will be around 119.000 and I will adjust the SL as soon, as we reach this target and let the trade take its way

BTC setup projection🚨 BTCUSD Trade Setup – 5M Chart
📉 Entry Zone: 118,950–119,000
🎯 Target 1: 120,280
🎯 Target 2: 120,779
🎯 Final TP: 123,221
🛡️ SL Zone: Below 118,447
✅Confidence level 7.5/10
Bias: Bullish 📈 – anticipating a reversal from the demand zone with clean upside liquidity targets.
Stay patient, wait for confirmation before entry. Let the setup come to you.
As always, manage risk. Risk what you’re okay to lose. 💼

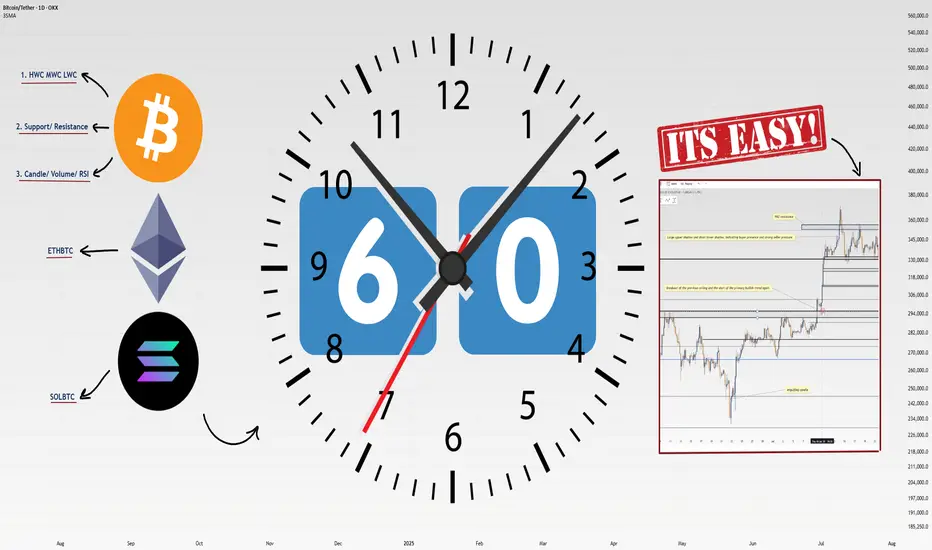
How I Analyze Any Coin in 60 Seconds: 4-Step Masterclass!Heyy traders, it’s Skeptic from Skeptic Lab! 🩵 I’m breaking down my lightning-fast method to analyze any coin in just 60 seconds . This 4-step process is how I spot long/short triggers like a pro. Buckle up, let’s dive in:
✔️ Step 1: Identify HWC/MWC/LWC (10 seconds)
Nature’s got a cool vibe—bet a lot of you hit the outdoors on weekends. When I see an apple tree from afar, it’s majestic, but up close, I spot branches and worm-eaten fruit. From a distance, I miss the details; up close, I lose the tree’s grandeur. Markets work the same. You need different timeframes to grasp the market structure. With practice in Dow Theory, trends, and tools, spotting HWC (Higher Wave Cycle), MWC (Mid Wave Cycle), and LWC (Lower Wave Cycle) becomes second nature. For me, this takes 10 seconds.
Want a full HWC/MWC/LWC guide? Check my free article I wrote a while back—it’s a hands-on tutorial ( link Cycle Mastery ).
📊 Step 2: Draw Support/Resistance Lines (20–30 seconds)
I start with higher timeframes: Monthly, then Weekly, then Daily. Once I’ve drawn lines up to Daily, I don’t always redraw for lower timeframes—often, I just adjust them.
Pro tip : Give more weight to the right side of the (recent data) since it’s fresher and more valuable. I change line colors for 4-hour lines, so I know they’re less critical than Daily. I don’t draw lines below 4-hour, but if you’re a scalper, tweak this to your strategy. This step takes me 20–30 seconds, the longest part.
📉 Step 3: Analyze Candles, Volume, Oscillators, and Indicators (10–15 seconds)
Here, I check everything I can: candles, volume, oscillators, and indicators . The goal? Stack confirmations for my triggers. Think RSI hitting overbought, volume spikes, larger candle sizes, or momentum surges—you get the vibe. This step’s length depends on your tool mastery. For me, it’s quick because I know what to look for.
🔔 Step 4: Check Coin Dominance (5–10 seconds)
This is the most critical yet simplest step. We need to track where liquidity’s flowing . For example, if SOL/BTC is bearish, I skip buying Solana—liquidity’s exiting. BTC.D (Bitcoin Dominance) is also key. The relationships dominance creates are complex and don’t fit in one analysis, but if you want a full dominance tutorial, drop it in the comments!
🔼 Key Takeaway: Using these 4 steps—HWC/MWC/LWC, support/resistance, candles/indicators, and dominance—I analyze any coin in 60 seconds. Your speed depends on experience and knowledge. If you’re new, this might take 60 minutes per coin, but don’t sweat it— practice makes you lightning-fast . Thanks for vibing with this educational idea! <3 I’ll catch you in the next one—good luck, fam!
💬 Let’s Talk!
Want a dominance tutorial or more tips? Hit the comments, and let’s crush it together! 😊 If this guide lit your fire, smash that boost—it fuels my mission! ✌️
BITCOIN PREDICTION: HUGE BREAKOUT SOON!! (watch this level) Yello Paradisers! I'm sharing with you multi-timeframe analysis on Bitcoin, levels to watch out for, confirmations we are waiting for, and everything needed for successful professional trading that is being profitable in the long run.
I'm sharing with you zig-zag from the Elliot Wave pattern formation. I'm also sharing a possible impulse we are going through, a head and shoulders pattern and its target, and the next major resistance and support levels.
I'm sharing with you a contracting triangle setup and how to trade it, along with an ending diagonal setup and how to trade it. Watch out for confirmations and how the price is developing based on what I have been talking about in this video, then trade it as a professional trader should.
Make sure that you have a great risk management, trading strategy, and tactic for entering the trades. I have explained some tactics that I'm watching for in this video, but make sure that all these tactics are well within your larger trading strategy and that you're approaching the market professionally. Don't try to get rich quick.
Make sure that you are focusing on long-term profitability and survival. This is the only way you can make it in crypto trading!

Bitcoin Correction Maturing – Long Setup Brewing!Bitcoin ( BINANCE:BTCUSDT ) has fallen by more than -4% over the past day.
Let's take a look at the reasons for the decline.
One of the key reasons behind Bitcoin’s decline in the past 24 hours ( July 25 ) could be the reduced likelihood of Jerome Powell being replaced as Chair of the Federal Reserve.
In recent days, market participants were speculating that Donald Trump might replace Powell — a scenario that was considered bullish for risk assets like Bitcoin. However, recent reports of a meeting between Trump and Powell, and signs that Powell might not be dismissed, have weakened this fundamental narrative.
This meeting may signal a truce or reduced tension between Trump’s team and Powell , which could imply a continuation of current Fed policies. That’s bad news for Bitcoin, as it removes a potential psychological tailwind from the market and dampens speculative sentiment.
As a result:
Over $500 million in liquidations(Long Positions) occurred
Weak inflows into Bitcoin ETFs
A stronger U.S. Dollar Index ( TVC:DXY )
And declining Gold( OANDA:XAUUSD ) prices over the past two days
all added additional selling pressure on BTC. Now let's take a look at Bitcoin's conditions on the 4-hour time frame .
Bitcoin currently appears to have broken the Support zone($116,900-$115,730) , Support lines , 100_SMA(4-hour TF) , and the lower line of the Symmetrical Triangle Pattern with a bearish Marubozu candle .
Note : In general, trading was difficult when Bitcoin was inside a symmetrical triangle (about 10 days).
It also seems that the pullback to these zones has ended and Bitcoin is waiting for the next decline .
In terms of Elliott Wave theory , Bitcoin appears to be completing microwave 5 of microwave C of major wave 4 . There is a possibility that main wave 4 will create a descending channel and complete at the bottom of the descending channel (at Potential Reversal Zone(PRZ) ).
I expect Bitcoin to start rising again after completing the CME Gap($115,060-$114,947) from Cumulative Long Liquidation Leverage($114,480-$114,000) or Cumulative Long Liquidation Leverage($113,284-$112,603) near the PRZ and Heavy Support zone($111,980-$105,820) .
Cumulative Short Liquidation Leverage: $117,904-$116,665
Cumulative Short Liquidation Leverage: $121,046-$119,761
Do you think Bitcoin has entered a major correction, or does it still have a chance to create a new ATH?
Please respect each other's ideas and express them politely if you agree or disagree.
Bitcoin Analyze (BTCUSDT), 4-hour time frame.
Be sure to follow the updated ideas.
Do not forget to put a Stop loss for your positions (For every position you want to open).
Please follow your strategy and updates; this is just my Idea, and I will gladly see your ideas in this post.
Please do not forget the ✅' like '✅ button 🙏😊 & Share it with your friends; thanks, and Trade safe.
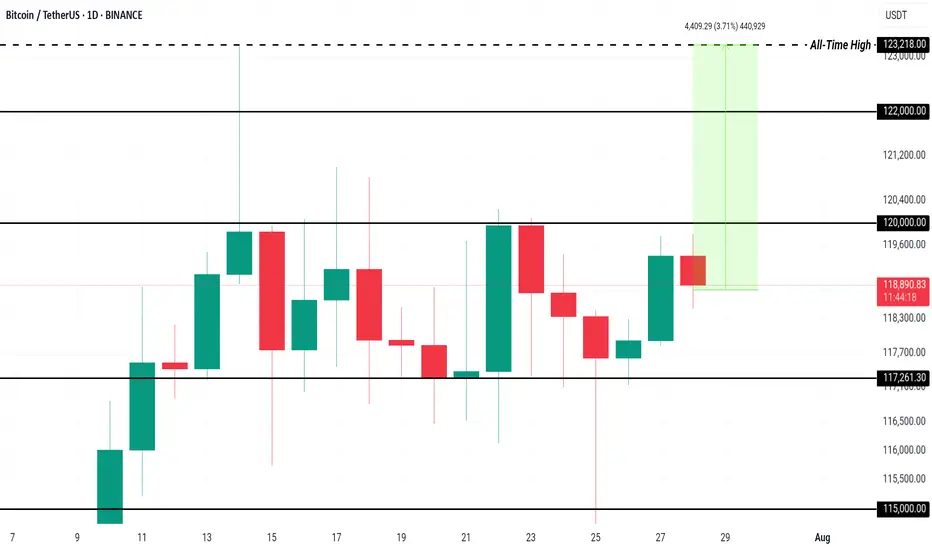
Here’s Why Bitcoin Price Could Rewrite History in AugustBINANCE:BTCUSDT price is currently hovering at $118,938, within a consolidation range between $117,261 and $120,000 . While this range has held steady, the possibility of breaking through $120,000 is high if investor sentiment remains strong.
The current sell-side risk ratio for BINANCE:BTCUSDT is at 0.24, well below the neutral threshold of 0.4 and closer to the low-value realization threshold of 0.1. This suggests that the market is experiencing consolidation, with investor behavior indicating a pause in large sell-offs.
Historically, August has been a bearish month for BINANCE:BTCUSDT , with the median monthly return sitting at -8.3%. However, given the current accumulation trend and the low sell-side risk, Bitcoin may defy its historical trend this year. If Bitcoin can secure $120,000 as support, it would likely push past $122,000 and move toward the ATH .
However, there remains a risk that the market could turn bearish if investors shift their stance due to unforeseen market factors. In this case, BINANCE:BTCUSDT could lose support at $117,261 and slide to $115,000, reversing the bullish thesis.
Strategic Multi-Swing Analysis – Pivots and Post-FOMC Outlook__________________________________________________________________________________
Technical Overview – Summary Points
➤ Sustained bullish momentum on BTCUSDT across all swing timeframes.
➤ Key supports: 116400–117400 (likely rebound), major supports: 105047–114674.
➤ Main resistances: 119000–120000 (short term), major ceiling at 123240 (1D/12H).
➤ Risk On / Risk Off Indicator: "Strong Buy" signal – tech sector leadership confirmed.
➤ Volumes normal to moderately elevated, no excess or behavioral anomaly (ISPD "Neutral").
➤ No euphoria or capitulation flags; general wait-and-see attitude, FOMC event ahead.
__________________________________________________________________________________
Strategic Summary
➤ Strategic bullish bias remains as long as 116400/117400 supports hold.
➤ Opportunity window: buy pullbacks towards 117400–116400 with tight stops; clear invalidation below 115900.
➤ Risks: FOMC-induced volatility, increased leverage on alts, potential capitulation if key support breaks.
➤ Catalysts: FOMC communication, geopolitical context (no immediate threat), background risk-off climate not yet triggered.
➤ Action plan: Prioritize post-event reaction over anticipation; maintain strict technical protection.
__________________________________________________________________________________
Multi-Timeframe Analysis
1D: Uptrend confirmed. Price above all major supports. Strong resistance at 123240, key support at 105047, normal volumes, Risk On / Risk Off Indicator "Strong Buy", ISPD "Neutral".
12H: Bullish bias. Resistance cluster 120002–123240. Intermediate supports 114674/111949. Momentum/volume supported, no excesses.
6H: Bullish near range top, supports at 114674/111949, ceiling at 120002–123240. Solid Risk On / Risk Off Indicator.
4H–2H: Up momentum, resistance 119003–120002–123240, supports 116474/117800. Moderate/normal volumes.
1H: Strong uptrend, thick resistance at 119000–120000, immediate supports 117800/116474. Slight volume uptick ahead of FOMC.
30min–15min: Resistance 119003–120000 (~H4 pivot). Intraday support 117400–117800/118200. Both Risk On / Risk Off Indicator and ISPD neutral, normal volumes, bullish as long as 116474 holds.
SYNTHESIS: Broad bullish confluence on MTFTI from 1H to 1D/W.
Supports at 116474/117400 are key pivots for maintaining bullish swing view.
No behavioral alerts or extreme volumes.
Consolidation/waiting likely before FOMC release – monitor reactions at pivot zones.
__________________________________________________________________________________
Strategic decision & macro
Opportunities: Swing bullish scenario favored as long as key supports hold, buy strategic pullbacks, reverse on clear break.
Main risk: FOMC volatility, altcoin excesses, possible post-announcement fake moves. Active monitoring essential.
Macro/on-chain: No excess, BTC realized cap > $1T; aggressive rotation into alts, high open interest. No capitulation. Major on-chain & technical support aligned at 114500–118000.
Action plan: Favor reactivity (post-FOMC), tight stops, progressive take profits at 119500–123240 resistance. No aggressive pre-positioning.
__________________________________________________________________________________
Macro catalysts overview
FOMC expected: status quo, market sensitive to any Powell tone shift.
Global macro: latent risk-off, geopolitical drivers closely watched.
BTC stable, no technical disruptor in the immediate term.
__________________________________________________________________________________
Final Decision Summary
Robust technical setup with a clear bullish bias. Optimal entries on 117400-116400 pullbacks, stops below support, active management needed during FOMC. No on-chain excess; constructive background unless exogenous shock or resistance failure (119000–123240). Stay alert for breakout/reject pivot.
__________________________________________________________________________________

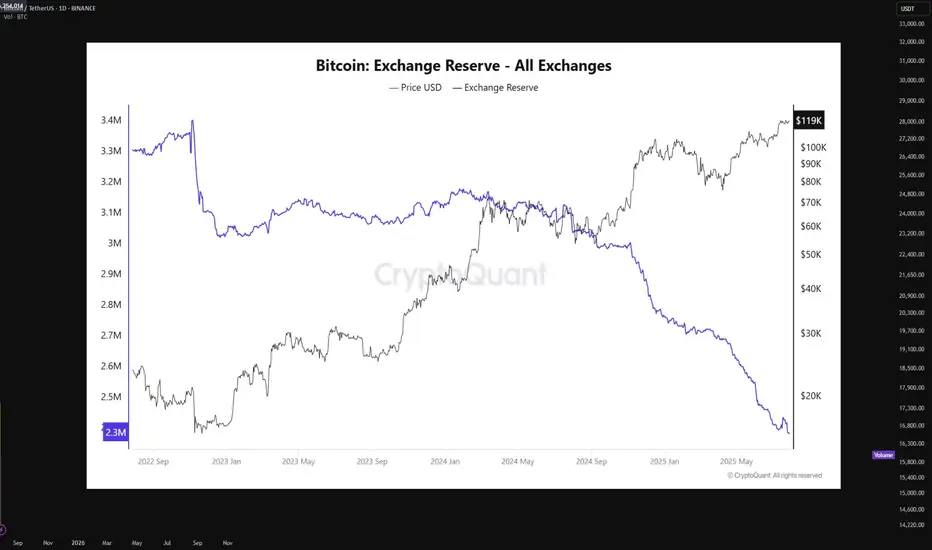
Bitcoin supply on exchanges is at an all-time lowBitcoin is currently undergoing a textbook supply-side shock, a rare phenomenon that historically precedes vertical price expansion. The latest on-chain data from CryptoQuant shows that BTC exchange reserves have declined to an all-time low of just 2.3 million BTC, down from approximately 3.3 million BTC in mid-2022. This marks a 27% drop in immediately sellable supply — a net outflow of over 900,000 BTC from centralized exchanges.
This trend signifies that a substantial portion of BTC holders have opted for long-term self-custody, indicating growing conviction among market participants. When coins leave exchanges, they are typically sent to cold wallets for long-term storage, effectively removing them from the liquid supply pool. This restricts the ability for large-volume sell orders to materialize, especially during rapid price appreciation, thereby creating a supply squeeze.
In parallel, the price of Bitcoin has risen steadily, now trading around $119,000, with a clear break above prior resistance clusters in the $75K–$85K zone. The price has shown strong momentum divergence against exchange reserves, with reserves falling while price rallies, a bullish continuation signal. This decoupling indicates aggressive spot accumulation in the background, often a signal of institutional or whale-level interest.
Technically, BTC is also showing signs of a parabolic structure forming, supported by rising volume on upward moves and decreasing volume on retracements — confirming bullish market structure. Price action has respected key Fibonacci levels throughout the rally, and is currently pressing into a price discovery phase with minimal historical resistance above.
The macro backdrop further supports this narrative. With Bitcoin ETFs now live and facilitating regulated inflows, capital has increasingly favored BTC as a store-of-value hedge amid fiat debasement and monetary policy uncertainty. Combined with the 2024 halving, which cut block rewards from 6.25 to 3.125 BTC per block, new supply issuance has halved, while demand remains elevated.
When supply dries up — as it clearly is — and demand persists or increases, price must equilibrate higher. This is a fundamental economic principle now playing out in real-time. The current environment mirrors late 2020 to early 2021, when a similar supply drop from exchanges preceded Bitcoin’s rally from $20K to $64K.
In summary, Bitcoin is entering a phase of constrained supply coupled with aggressive demand, pushing the asset toward price discovery territory. With on-chain reserves at historic lows, minimal overhead resistance, and strong macro alignment, the technicals now point to a structurally bullish setup.
If this trend persists, a sustained breakout beyond $120K could trigger a feedback loop of FOMO-driven spot bids, further deepening the supply shock and accelerating the next leg of the bull cycle.
Market overview
📈 WHAT HAPPENED?
Last week, a less priority but expected scenario was realized for Bitcoin. We broke through the sideways in a downward direction and fell to the area of pushing volumes ~$115,000. At this level, strong volume anomalies were recorded, and a rebound occurred.
On Friday, the daily analysis on TradingView indicated a point to join the long movement, which confirmed its accuracy. The price reached the accumulated volume zone of the sideways at $117,600-$119,200 and was able to consolidate above without any significant reaction, which strengthens the buyers' position.
💼 WHAT WILL HAPPEN: OR NOT?
At the moment, the first protection from sellers has appeared. Let's consider possible scenarios:
1. A decline to the mirror zone of $118,300-$117,300, from which, if the buyers' reaction is confirmed, buys are expected to resume.
Next, a narrow sideways formation within the mentioned zone and a local sell zone of $119,500-$119,000 is possible, followed by a long position.
Another option is to develop a further long divergence from the current levels. In this case, the local sell zone of $119,000-$119,500 will provide additional support.
2. A less priority scenario is a decline to the volume anomaly zone of $116,200-$115,000, with a test of the local minimum. In this case, the recovery will take longer.
Buy Zones:
$118,300–$117,300 (mirror volume zone)
$116,200–$115,000 (volume anomalies)
$110,000–$107,000 (accumulated volumes)
Sell Zone:
$119,500–$119,000 (potential resistance if a correction develops)
📰 IMPORTANT DATES
Macroeconomic events this week:
• July 29, Tuesday, 14:00 (UTC) - publication of the US Consumer Confidence Index from CB for July;
• July 29, Tuesday, 14:00 (UTC) - publication of the US Job Openings and Labor Turnover (JOLTS) for June;
• July 30, Wednesday, 08:00 (UTC) - publication of Germany's GDP for the second quarter of 2025;
• July 30, Wednesday, 12:15 (UTC) — ADP's July change in the number of non-agricultural employees in the United States;
• July 30, Wednesday, 12:30 (UTC) — U.S. GDP for the second quarter of 2025;
• July 30, Wednesday, 13:45 (UTC) — Canada's interest rate decision;
• July 30, Wednesday, 18:00 (UTC) — US FOMC statement and announcement of the US Federal Reserve interest rate decision;
•July 30, Wednesday, 18:30 (UTC) — US FOMC press Conference;
• July 31, Thursday, 01:30 (UTC) — publication of the Chinese Manufacturing PMI for July;
•July 31, Thursday, 03:00 (UTC) — announcement of Japan's interest rate decision;
• July 31, Thursday, 12:00 (UTC) — publication of Germany's July Consumer Price Index (CPI);
• July 31, Thursday, 12:30 (UTC) — publication of the United States' June Personal Consumption Expenditure Price Index and Initial Jobless Claims;
• August 1, Friday, 09:00 (UTC) — publication of the Eurozone Consumer Price Index (CPI) for July;
• August 1, Friday, 12:30 (UTC) — publication of the average hourly wage, changes in the number of employees in the non-agricultural sector, and the unemployment rate in the United States for July;
• August 1, Friday, 13:45 (UTC) — publication of the U.S. Manufacturing Purchasing Managers' Index (PMI) for July.
*This post is not a financial recommendation. Make decisions based on your own experience.
#analytics
Understanding Wedge Patterns - A Real Bitcoin Case Study🎓📊 Understanding Wedge Patterns - A Real Bitcoin Case Study 🧠📈
Hi everyone, FXPROFESSOR here 👨🏫
From this moment forward, I will no longer be posting targets or trade setups here on TradingView. Instead, I’ll be focusing 100% on education only for here in Tradinfview.
Why? Because over time I’ve learned that even when traders receive the right charts, most still struggle to trade them effectively. So, from now on, FX Professor Crypto content here will be strictly educational — designed to teach you how to read and react to the markets like a professional. Unfortunately I cannot be posting on Tradingview frequent updates like I do all day. Education is always better for you guys. And i am very happy to share here with you what matters the most.
🧩 In today’s post, we dive into one of the most misunderstood formations: the wedge pattern.
Most resources show wedges breaking cleanly up or down — but real price action is messier.
🎥 I recorded a video a few days ago showing exactly how BTC respected a wedge formation.
⚠️ Note: Unfortunately, TradingView doesn’t play the audio of that clip — apologies that you can’t hear the live commentary — but the visuals are clear enough to follow the logic. (there is no advertising of any kind on the video so i hope i don't get banned again - i did make a mistake the last time and will avoid it-the community here is awesome and needs to stay clean and within the rules of TV).
Here’s what happened:
🔸 A clean wedge formed over several days
🔸 We anticipated a fake move to the downside, grabbing liquidity
🔸 BTC rebounded off support around a level marked in advance
🔸 Then price re-entered the wedge, flipping support into resistance
The lesson?
📉 Often price will exit the wedge in the wrong direction first — trapping retail traders — before making the real move. This is a classic liquidity trap strategy, exercised by the 'market'.
💡 Remember:
Wedges often compress price until it "runs out of space"
The initial breakout is often a trap
The true move tends to come after liquidity is taken
The timing of the 'exit' has a lot to do with the direction. In the future we will cover more examples so pay attention.
I stayed long throughout this move because the overall market context remained bullish — and patience paid off.
Let this be a reminder: it’s not about guessing the direction — it’s about understanding the mechanics.
More educational breakdowns to come — keep learning, keep growing.
One Love,
The FX PROFESSOR 💙
Disclosure: I am happy to be part of the Trade Nation's Influencer program and receive a monthly fee for using their TradingView charts in my analysis. Awesome broker, where the trader really comes first! 🌟🤝📈

BTC poised to rise further! Market volume remains the problemBTC poised to rise further! Market volume remains the problem
From our chart we can see that BTC likes to make big corrections before moving higher. Over the weekend, BTC transformed from a bearish picture to a clear bullish triangle with a bullish breakout.
The prevailing trend should push BTC higher as shown in the chart, but again the problem is with the volume.
Suppose BTC has not accumulated enough volume during the development of the pattern. In that case, it is very likely that it will fall even further to develop an even larger pattern like the previous one that we can see at the end of the wave.
However, at the moment, BTC has a bullish pattern and the scenario could develop in the way shown in the chart. We cannot assume further transformations at the moment.
You may find more details in the chart!
Thank you and Good Luck!
PS: Please support with a like or comment if you find this analysis useful for your trading day

Bitcoin Next Leg Incoming? Targets $134K from Bullish WedgeBTCUSDT is consolidating within a descending wedge right above a critical demand zone, following a impulsive breakout from its prior range structure. This current setup suggests another potential bullish continuation, especially as price continues to respect both the wedge support and internal demand.
With the higher timeframe structure favoring bulls and previous demand zones holding firm, the projected breakout targets align with $123,218 and $134,446 respectively.
A clean invalidation would only be confirmed on a sustained break below the wedge and loss of the strong support area near $110K.
All eyes on the wedge apex as BTC prepares for its next major leg.

BTC Price Prediction and Elliott Wave AnalysisHello friends,
>> Thank you for joining me in my analysis. I think we will finish the 1st wave A in pink X wave as Gray ABCm. I am waiting for its confirmation.
>> Reminder about our previous confirmations:
* Day TF: Breaking 118451 for today and the next couple of days, and keep on above it, leads to ending the B wave successfully.
* 4Hr TF: Breaking 118451 for the past hours and keep on above it, we ended W wave successfully ( maybe also B ?)
Keep liking and supporting me to continue. See you soon!
Thanks, Bros

Consistency and reliable performance with real time validationMy cutting edge tech has been put to the test with daily real time validation
It's been correct for over 4 weeks
It's been my mission to defy market odds and revolutionize trading, and with thanks to AI my mission is being fulfilled
I would love to hear your thoughts...or if not, I hope you're getting really excited by what you see

BTCUSDT Range-Bound Market: Short-Term Bearish MoveBTCUSDT
has failed to break through the descending resistance near 120,000 and is now forming a lower high within the broader resistance zone. The price action follows an impulsive leg up and is currently tracing a potential reversal pattern under key structural resistance. As long as the market remains capped below 120,000, continuation toward 117,500 is likely. The downward bias is supported by weakening momentum after the bull trap and resistance rejection.
📉 Key Levels
Sell trigger: Breakdown below 119,000
Sell zone: 119,400 – 120,000
Target: 117,500
Invalidation: Break and close above 120,500
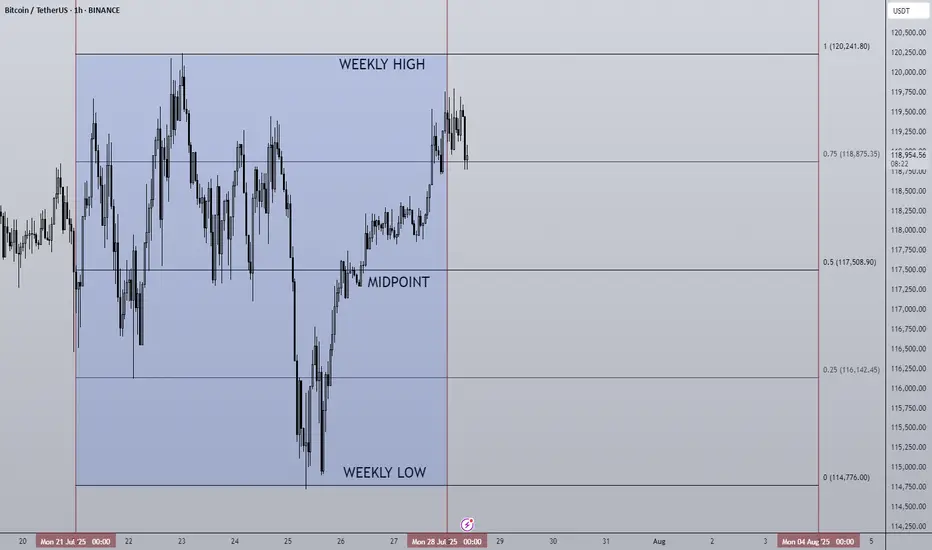
28/07/25 Weekly OutlookLast weeks high: $120,241.80
Last weeks low: $114,776.00
Midpoint: $117,508.90
As we approach the end of the month BTC continues to trade sideways during a cooling off period as altcoins finally take the stage. Last week Bitcoin saw a relatively flat net inflow via ETFs of $72m, ETH on the other hand posted the second largest net inflow week ever at $1.85B! The concentration has certainly shifted...
This IMO is still a very bullish structure for BTC, very shallow pullbacks being bought up/absorbed by still happy to purchase at these levels. As long as this continues altcoins have a strong base to continue growing on, if BTC breaks structure and price accepts below ~$110,000 then the altcoin rally will be over for now I believe.
This week some major altcoins are set to reach HTF resistance areas, ETH has already tagged $4,000 which looks to be a battleground level of major importance.
TOTAL2 which is the combined market cap of all altcoins is currently ~8% from the highs, keeping this in mind for where altcoins may run out of steam...
Good luck this week everybody!
Daily Market Analysis – BTC, ETH, and Key Indexes
💎🔥 Daily Market Analysis – BTC, ETH, and Key Indexes 🔥💎
🚀 Don’t forget to FOLLOW & smash the ROCKET 🚀 button if this helped you!
💬 Drop your thoughts in the comments
♦️ Hello everyone!
On this page, we follow a daily and weekly crypto routine:
🟡 Daily:
• Structural and technical analysis of BTC, ETH, and overall market indexes.
🟡 Every Sunday:
• Analysis of the Top 10 Altcoins (excluding BTC & ETH)
• 🆕 Weekly Watchlist to be introduced soon!
💛Your likes and follows are my fuel to keep posting daily insights 💛
⭕️ We’re currently in a super critical zone across all markets:
• BTC, ETH, major Altcoins
• Key indexes like BTC Dominance (BTC.D), USDT Dominance (USDT.D), TOTAL, TOTAL2, and TOTAL3
All are at major turning points.
❗️Also, this week brings critical macro news:
• U.S. Interest Rate decision – expected to remain unchanged,
but political pressure may push Powell to surprise the markets.
• Reports on U.S. GDP, Japanese Yen interest rate, and Canadian Dollar are also coming.
⚠️ This is a HIGH-IMPACT WEEK – stay alert. We might even be at the edge of a bull run.
♦️ BTC
As mentioned yesterday, to confirm long positions on altcoins and restart their rally,
we need a breakout above 120,300 on BTC and a drop in BTC.D.
✅ Break of 120,300 would inject strong bullish sentiment and possibly trigger high momentum.
🚫 Until then, my focus is strictly on bullish setups only.
📌 If BTC ranges before the U.S. session opens, the entry triggers shared in yesterday's watchlist will be ideal to activate.
♦️ BTC Dominance (BTC.D)
While BTC price rises, BTC.D is dropping – a great signal for altcoin entries.
BTC.D is testing two key levels:
1️⃣ 60.83
2️⃣ 60.42
📉 A full breakdown of 60.83 would be the first signal of an altcoin reversal.
❗️If 60.42 breaks too – do NOT stay out of altcoins!
♦️ TOTAL (Market Cap)
Currently struggling with the 3.91T level.
A clean break here could bring in serious volume and momentum.
💡 Missed some entries from the watchlist? Look for major breakout levels on other coins.
♦️ TOTAL2 (Altcoin Cap excl. BTC)
Also testing its key level of 1.48T. Breakout = confirmation of altcoin strength.
♦️ TOTAL3 (Altcoin Cap excl. BTC & ETH)
Yesterday, gave us its first bullish signal breaking above 1.03T.
Because ETH has moved already, TOTAL2 reacted faster.
⏳ That means: we still have time for altcoin setups (excluding BTC & ETH).
♦️ USDT Dominance (USDT.D)
Broke 4.23% – which was the first early sign of a bullish shift.
Before it breaks 4.13%, we should already be in long positions on BTC and alts.
⚠️ Once 4.13% breaks, sharp altcoin rallies may happen quickly – entry opportunities may disappear.
♦️ ETH/USDT
Although ETH has bullish candles, volume and trend strength are weak.
My preferred entry was around $3,750 – that would give us room toward the $4,000 resistance.
Right now, no valid entry trigger in ETH.
If it reacts to $4,000 and forms a lower low, then we might scout for bullish setups.
⛔️ $4,000 is likely to cause some chop – which is why $3,750 was a better buy zone.
♦️ Outlook & Strategy ♦️
1️⃣ Consider the chance that all coins may bounce exactly from current levels – that's what I’m personally positioning for, accepting the risk.
2️⃣ If BTC and ETH break 120K and 4K then consolidate, and BTC.D continues to drop —
➡️ Get ready for an Altcoin Party.
3️⃣ Monitor the daily watchlist triggers closely.
4️⃣ If BTC fails to break 120.3K, we won’t get the explosive rally.
5️⃣ If BTC ranges while BTC.D continues dropping, alts will still perform —
⚠️ But not as strong as a full bull run.
🚀 Hit the ROCKET if this helped you stay ahead of the market!
🟡 Follow me for daily BTC, ETH & index updates.
💬 Let me know your market view in the comments!
BTC roadmap to new ATHBTC roadmap to new ATH
We're in a bullish flag pattern. Might chop around here for the next few days before we get the breakout, re-test, then make our way to test the last ATH.
I'm going to trade the flag hi/low until we get a break.

BitCoin BUY OfferAfter previous signal which have given us a good profit (more than 1:10 Risk to Reward), There is another chance for one more Buy position in specified are (117,500-118,200).
Attention : In my chart areas Stop Loss would be under the area (Over the area in Sell positions) and first Take Profit sets for at least R:R = 1:1
Let's see what will happen...
BTCUSDT analysis – 1H & 4H OB setups✅ The overall market trend is still bullish on the 1H and 4H timeframes. However, we’re watching the red 4H supply zone (around 122,000) closely for a possible short-term sell setup.
🟥 If price reaches this red OB, we’ll look for a light short position only with confirmation on the 5M or 3M timeframe.
🟩 On the downside, we are mainly interested in buy setups from the following key green OB zones:
🔹 OB 1H around 115,000
🔹 OB 4H around 111,000
🔹 OB 4H around 108,000
📌 Possible scenarios:
1️⃣ Price reaches the red OB → short with confirmation
2️⃣ Price pulls back to lower green OB zones → long with confirmation
3️⃣ Market bias remains bullish unless proven otherwise.
❌ No entry without confirmation.
