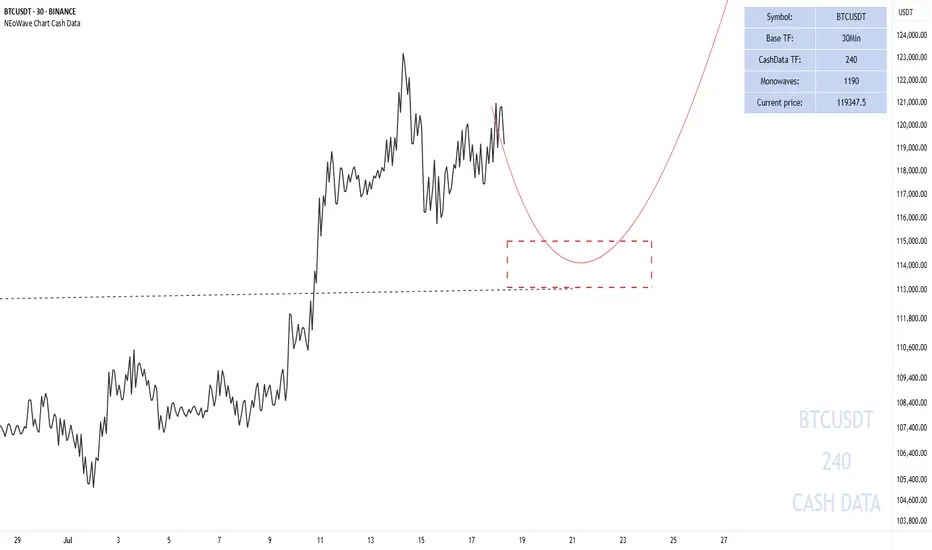
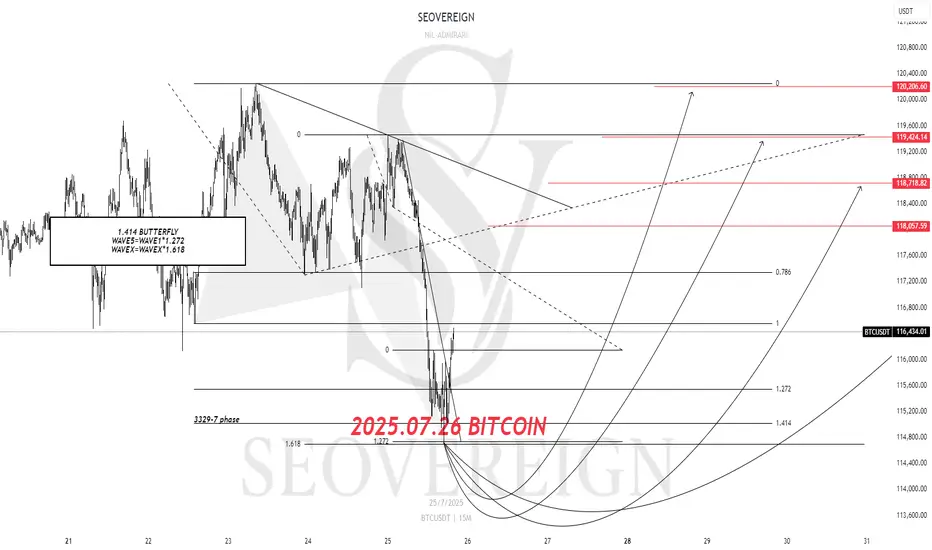
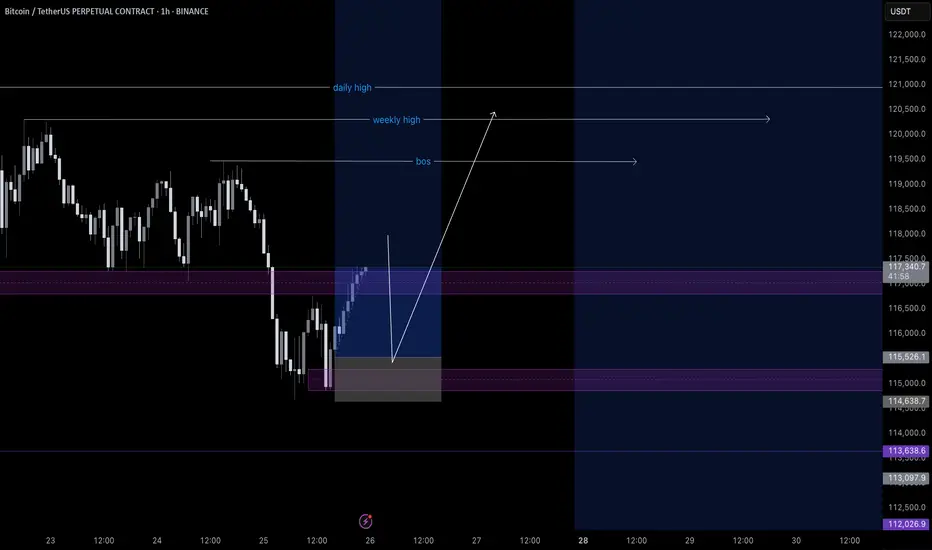
[SeoVereign] BITCOIN BULLISH Outlook – July 26, 2025The previous idea did touch the average TP price, but showed a rather disappointing rebound, so I will once again attempt to capture the starting point of the rebound. It is still considered that one more upward wave remains.
Accordingly, the TP is suggested at 118,057 USDT.
As always, I will carefully observe how the chart develops over time and update this idea with further explanations by organically integrating its specific interpretations and underlying rationale.
Thank you.
USDTBTC trade ideas
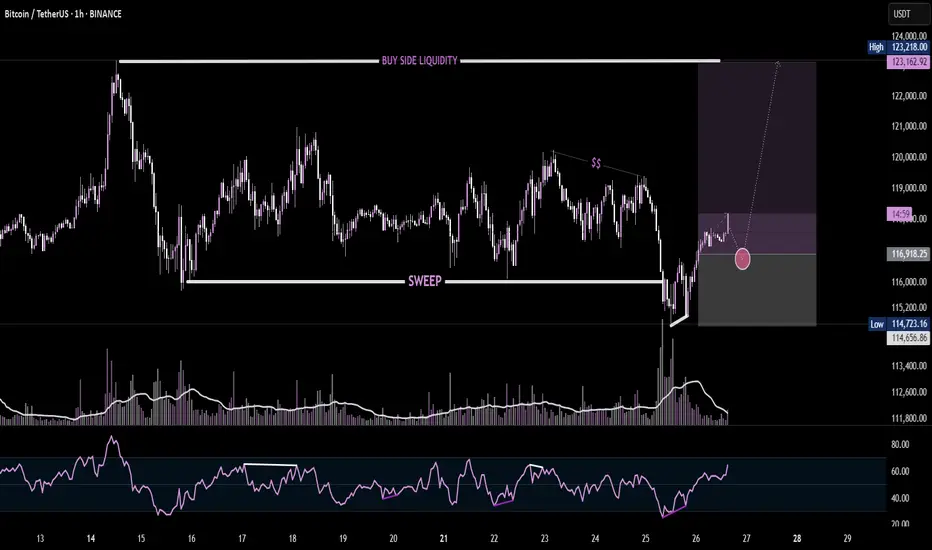
BTC Liquidity Grab + BounceBitcoin just completed a liquidity sweep below the recent low, grabbing stop-losses before reversing sharply. This move often signals smart money accumulation, as shown by the strong bullish reaction off the demand zone. Aiming for the Buy-Side Liquidity (BSL) above $123K. Volume spike and RSI divergence further validate the bullish narrative.
Bitcoin Prediction UpdateI've just modified the wave count and still the previous analysis is valid...
I'm not sure about the target of the last wave (the 5th of 5th wave) because it can be an extended wave...
The shown box is where I'll investigate to find any ending pattern...
Wyckoff ReaccumulationCurrent range looks like another reaccumulation range. Spring has just occurred and looking for a move back and then above the top of the range.
Bearish if we breakout then retrace forming an upthrust after distribution (UTAD).

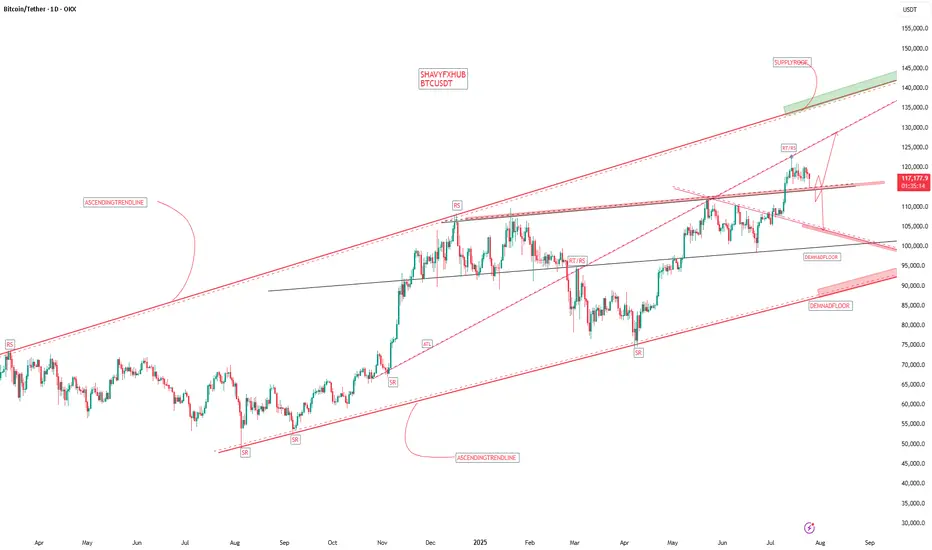
BTCUSDT ready to march towards 140k zoneHere is once again a view of what I had shared when BTCUSDT was trading around 95k in may 2025.
The price action has been similar to our expectation. A push towards 106k-110k and then drop around 95k-98k before boucing towards 137k.
So the next stop for the current upward move is 137k. The push from 98k has brought us into 120k zone and currently we were holding in that range from 114k-120k for a while.
However, this is going to change now. I believe the last drop towards 114k was a false breakdown from 4h support 4HS1 since the price quickly grabbed this region again by moving towards 117k.
I believe the path to 137k-144k is clear now and we see that in coming weeks. After that we shall likely see a correction towards 120k area before move to the target around 150k.
Lets see how the price moves. We will keep monitoring it time to time and I will provide updates. But till now it has been moving according to the plan.
#BTC #BTCUSD #BTCUSDT #BITCOIN #CRYPTO CRYPTOCAP:BTC $crypto

BTC - Trap, Tap, and Blast Off!BTC has been overall bullish, trading within the rising blue channel (1). After reaching a local high, it entered a short-term correction, forming a falling red channel (2).
👀All eyes are now on the key demand zone (3), which aligns with the lower bound of both the red channel and the rising blue structure.
🔎As long as this confluence holds, we anticipate a potential bullish impulse in August.
A retest of the $111,500–$112,000 zone could serve as the trigger for the next leg toward $128,000. Let’s see if BTC is gearing up for another breakout or if a deeper correction is in play.
🔔 Disclaimer: This analysis is for educational and informational purposes only. It does not constitute financial advice or a recommendation to buy or sell any asset. Always do your own research and manage your risk accordingly.
📚 Always follow your trading plan => including entry, risk management, and trade execution.
Good luck!
All strategies are good, if managed properly.
~ Richard Nasr

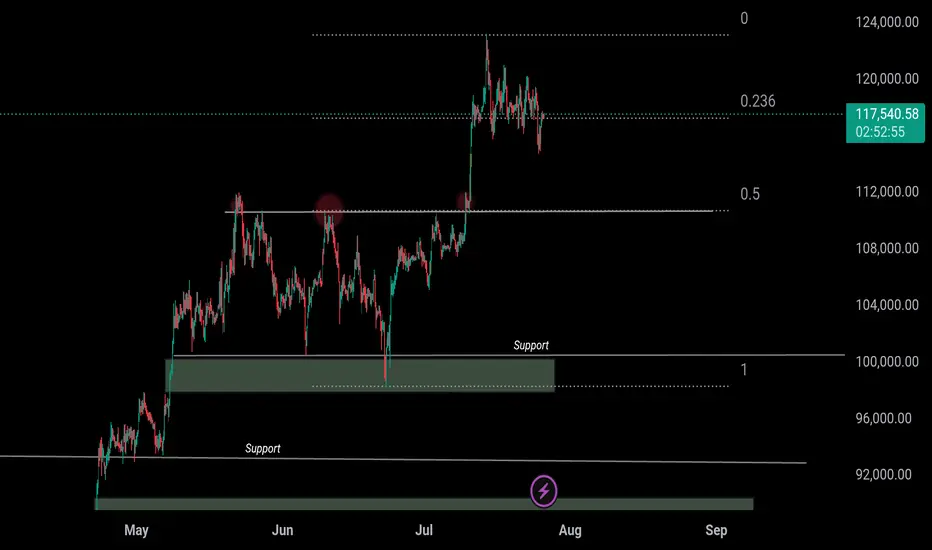
BTC 110k or 150k ??𝗪𝗶𝗹𝗹 CRYPTOCAP:BTC 𝗕𝗼𝘂𝗻𝗰𝗲 𝗮𝘁 $𝟭𝟭𝟬𝗞 𝗼𝗿 𝗖𝗿𝗮𝘀𝗵 𝗕𝗲𝗹𝗼𝘄 $𝟭𝟬𝟬𝗞? ‼️‼️
Breakout rallied from $110,500 → $123,293
Now pulling back toward 0.5 Fib retracement $110K
Retest Scenario:
– Hold above $110K = Bullish continuation toward $150K ATH
– Breakdown below $110K = Risk of deeper correction below $100K
Drop your thoughts below — bounce or breakdown?
CRYPTOCAP:BTC
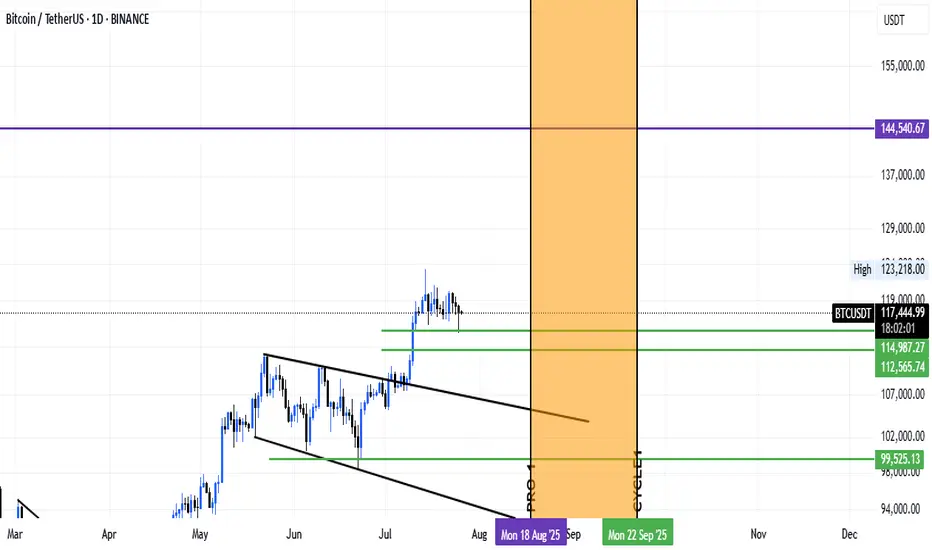
BTCUSDTAccording to previous analysis and its short-term target, Bitcoin has made a correction, and the correction areas, namely $114,000 and $112,000, were the important support areas it saw. However, considering the time, it can be said that the next Bitcoin ceiling will be reached in the period from August 18 to September 22, approximately 35 days.This is a medium-term timeframe on a weekly basis and Bitcoin is expected to reach $144,000 to $148,000 in price. Good luck and be victorious.
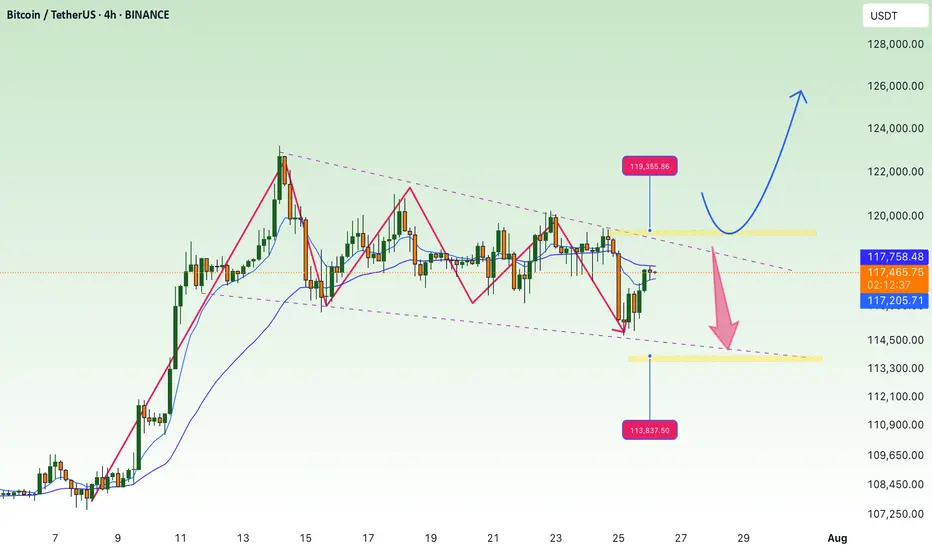
BTC Consolidates Below 119,300 Over the Weekend💎 BTC WEEKEND PLAN UPDATE (26/07)
NOTABLE BTC NEWS
The cryptocurrency market is attempting to stabilize after a wave of sell-offs during Friday’s Asian session, when Bitcoin (BTC) dropped to an intraday low of $114,723. A recovery trend is gradually strengthening, with BTC trading at $115,868 at the time of writing, indicating that buying interest at lower levels may increase in upcoming sessions.
TECHNICAL ANALYSIS PERSPECTIVE
Symmetrical Triangle Pattern
BTC is currently fluctuating within a symmetrical triangle pattern, with converging upper and lower trendlines. This pattern typically signals a strong consolidation phase before a decisive breakout.
Scenario unfolded as planned:
• The price failed to break the resistance zone around $120,000 (previously forecasted as a likely failed breakout zone).
• BTC then dropped sharply to the support zone around $115,000, touching the lower trendline and the potential breakout zone.
• At this level, the price rebounded as expected, indicating strong buying pressure at support.
MA lines supporting the trend:
• The price is currently moving around the 200-day MA (red line), showing that the dynamic support is working effectively.
• The 50-day MA (yellow line) is acting as short-term resistance. If broken, it could support the recovery momentum.
Two potential upcoming scenarios:
🔼 If BTC breaks above the $119,500 – $120,000 zone with strong volume, it may continue to test higher levels around $123,000 – $125,000.
🔽 Conversely, if it faces strong rejection around $119K and turns downward, BTC may retest the support zone at $114,000 – $115,000 once again.
Stay tuned to the channel for the latest and continuous updates on XAUUSD, CURRENCIES, and BTC.
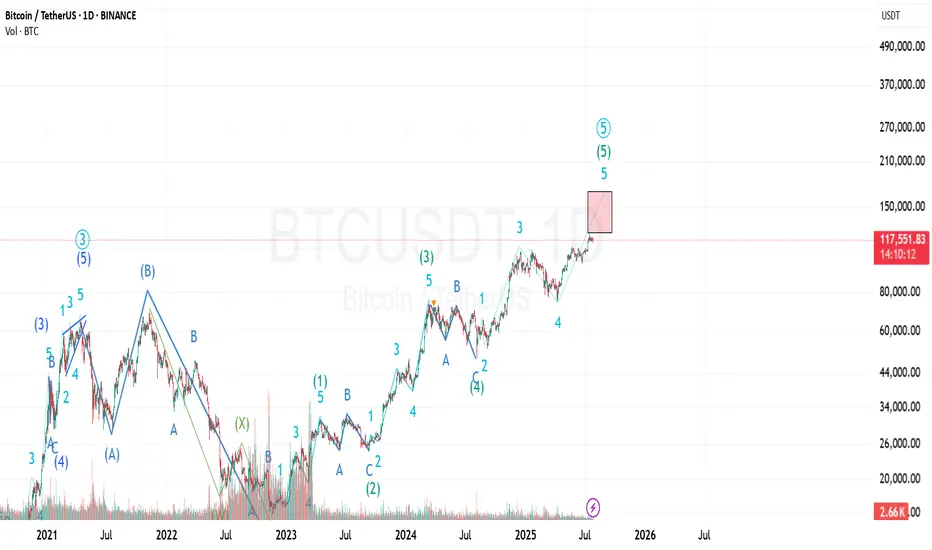
BTC should have one more leg upAccording to Elliot waves BTC should have one more impulse leg up to complete final wave of this cycle. Both daily and weekly RSI charts show bearish divergence, suggesting momentum is weakening even as price attempts to climb. A drop below $110000 would invalidate the current wave count and suggest a shift in market structure.
. Need to watch out reactions at target levels 136-150.

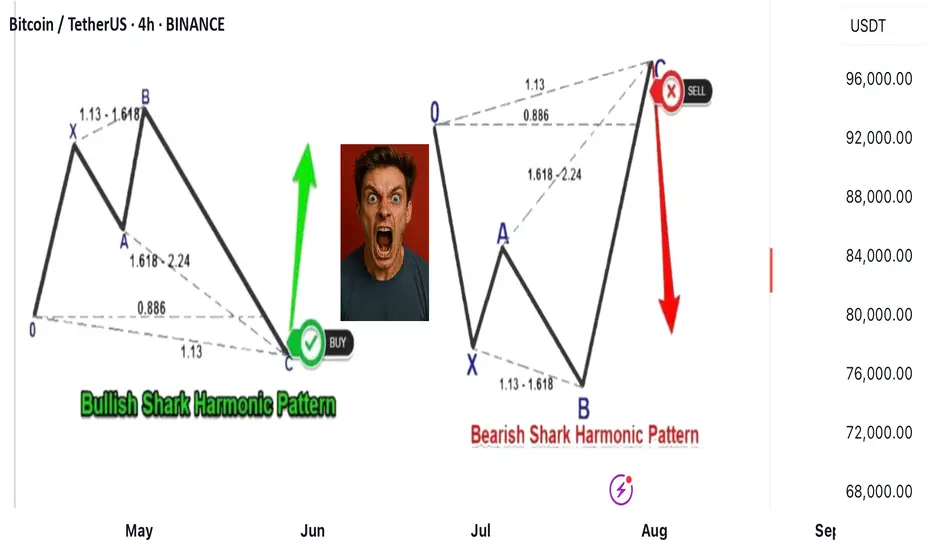
Shark harmonic pattern
---
### 🦈 What Is the Shark Harmonic Pattern?
- **Discovered by**: Scott Carney in 2011
- **Foundation**: Combines **Fibonacci ratios** with **Elliott Wave Theory**
- **Purpose**: Identifies potential **trend reversals** using precise geometric price structures
- **Structure**: Five points labeled **O, X, A, B, C** (not the usual XABCD)
- **Key Feature**: Relies heavily on the **88.6% Fibonacci retracement** and **113% extension**
---
### 📐 Pattern Geometry & Ratios
| Leg | Description | Fibonacci Ratio Range |
|------------|--------------------------------------------------|-------------------------------|
| XA | Initial impulse leg | No specific ratio |
| AB | Extension beyond X | 113% to 161.8% of XA |
| BC | Completion leg | 88.6% to 113% of OX |
| | | 161.8% to 224% of AB |
- **Point B** must **exceed point X**, forming an **Extreme Harmonic Impulse Wave**
- **Point C** is the **Potential Reversal Zone (PRZ)**
---
### 🛒 Buy Setup (Bullish Shark)
1. **No fixed retracement for A**
2. **B extends 113%–161.8% of XA**
3. **C completes at**:
- 88.6%–113% of OX
- 161.8%–224% of AB
📍 **Entry**: Near point C
📍 **Stop Loss**: Below point C
📍 **Target**: Retracement levels of BC (e.g., 50%, 61.8%), or back to point A/B
---
### 📉 Sell Setup (Bearish Shark)
1. **No fixed retracement for A**
2. **B extends 113%–161.8% of XA**
3. **C completes at**:
- 88.6%–113% of OX
- 161.8%–224% of AB
📍 **Entry**: Near point C
📍 **Stop Loss**: Above point C
📍 **Target**: Retracement levels of BC, or back to point A/B
---
### 📊 Real Trade Example & Educational Resources
In the comment
Shark harmonic pattern Absolutely, Amedeo! Here's a detailed and visually engaging breakdown of the **Shark Harmonic Pattern**, including its structure, trading styles, and how it connects Fibonacci ratios with Elliott Wave Theory:
---
### 🦈 What Is the Shark Harmonic Pattern?
- **Discovered by**: Scott Carney in 2011
- **Foundation**: Combines **Fibonacci ratios** with **Elliott Wave Theory**
- **Purpose**: Identifies potential **trend reversals** using precise geometric price structures
- **Structure**: Five points labeled **O, X, A, B, C** (not the usual XABCD)
- **Key Feature**: Relies heavily on the **88.6% Fibonacci retracement** and **113% extension**
---
### 📐 Pattern Geometry & Ratios
| Leg | Description | Fibonacci Ratio Range |
|------------|--------------------------------------------------|-------------------------------|
| XA | Initial impulse leg | No specific ratio |
| AB | Extension beyond X | 113% to 161.8% of XA |
| BC | Completion leg | 88.6% to 113% of OX |
| | | 161.8% to 224% of AB |
- **Point B** must **exceed point X**, forming an **Extreme Harmonic Impulse Wave**
- **Point C** is the **Potential Reversal Zone (PRZ)**
---
### 🛒 Buy Setup (Bullish Shark)
1. **No fixed retracement for A**
2. **B extends 113%–161.8% of XA**
3. **C completes at**:
- 88.6%–113% of OX
- 161.8%–224% of AB
📍 **Entry**: Near point C
📍 **Stop Loss**: Below point C
📍 **Target**: Retracement levels of BC (e.g., 50%, 61.8%), or back to point A/B
---
### 📉 Sell Setup (Bearish Shark)
1. **No fixed retracement for A**
2. **B extends 113%–161.8% of XA**
3. **C completes at**:
- 88.6%–113% of OX
- 161.8%–224% of AB
📍 **Entry**: Near point C
📍 **Stop Loss**: Above point C
📍 **Target**: Retracement levels of BC, or back to point A/B
---
### 📊 Real Trade Example & Educational Resources are in the comment

BTC /USDT : Getting support from FVG BTC Support from FVG - Bullish & Bearish Scenarios:
Bullish Scenario:
BTC is holding support from the FVG. As long as BTC stays above this zone, the market remains bullish. A bounce here could lead to further upside.
Bearish Scenario:
If BTC breaks below the FVG, it signals a potential downtrend. A breakdown may lead to more pain and further declines in the market.
Tips:
1. Wait for Confirmation: Look for a clear candle close above/below FVG for validation.
2. Risk Management: Set stops near the FVG to manage potential losses.
3. Monitor Volume: Strong volume during support retests increases bullish potential.
4. Stay Flexible: Be prepared for a market shift if BTC breaks the FVG support.

Btcusd outlook
Price tapped into our area and showed strong reaction.
Now watching how it behaves around 118.4k and 120.7k.
If bulls stay in control, 122k could be next.
Let’s see how it unfolds. 🔍📈

Bitcoin AnalysisWe have an order block in 1Hour TF, price can retest this before bullish continuation. If it breaks below bearish momentum continues.
A slight pullback to around 112,000 is expected before a bullishThere is a double top on the daily timeframe. It could pull back to the previous support level that I mentioned in the chart. Moreover, there is a healthy trendline support that can help BTC price bounce.

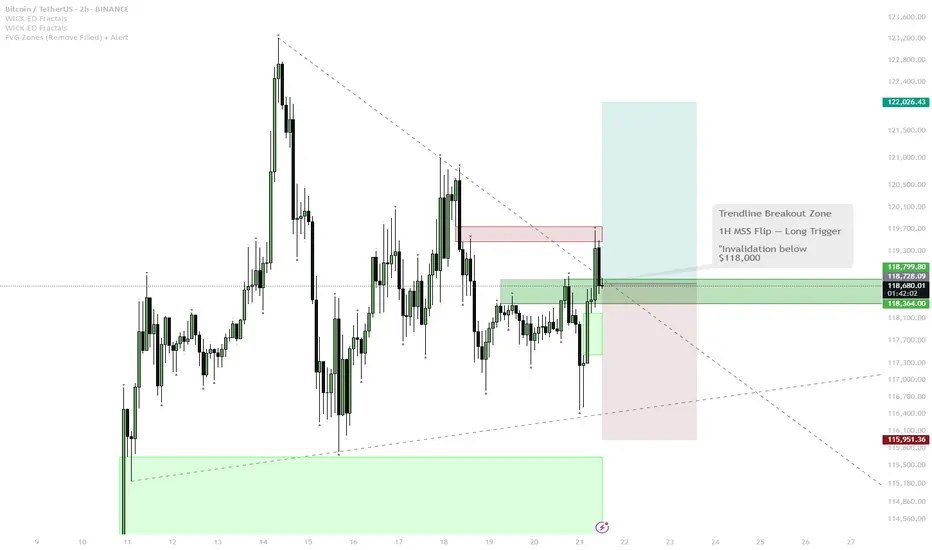
BTC Reloading for Breakout — Watching for 1H MSS Flip
BTC has bounced from local support (green zone) and is challenging the descending trendline.
The price is now testing the red resistance zone and the upper boundary of the 1H MSS (market structure shift) box.
Scenario A (Bullish):
— If BTC cleanly breaks the trendline and flips the 1H MSS box into support (with a strong close above), this is a trigger for a scalp long.
— Target for the move is the upper green box/previous high area near $122,000.
Scenario B (Bearish/Invalidation):
— If price is rejected at the red resistance and falls back below the green support box, risk of deeper pullback toward $116,000 increases.
BTC has shown resilience by quickly reclaiming support after a sweep lower, indicating strong demand. The market looks to be reloading for another push, with liquidity building up just below resistance. The setup favors a breakout if NY Open brings momentum. The flip of the 1H MSS box would confirm bullish intent. However, caution if the breakout fails — structure remains choppy and a failed breakout can trap late buyers.
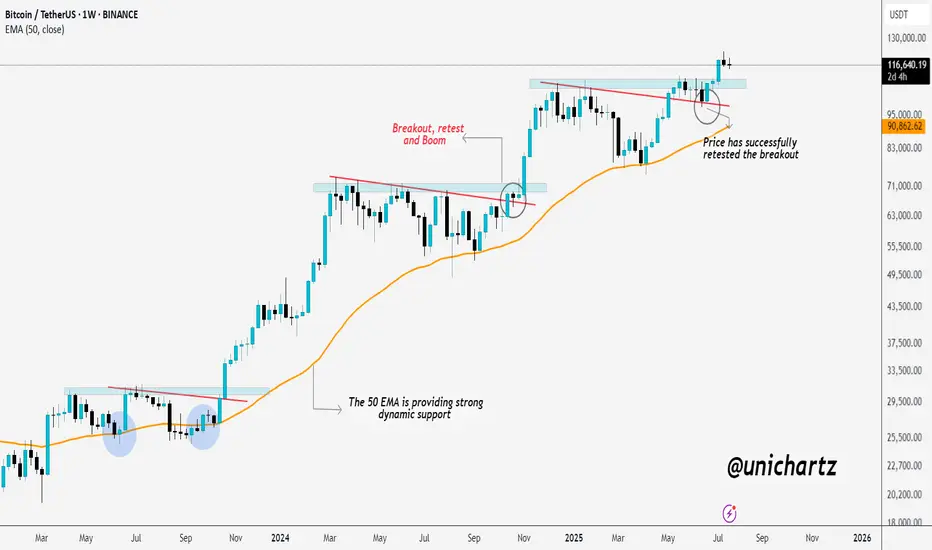
BTC Retested and Ready for the Next Leg Up?This CRYPTOCAP:BTC weekly chart shows a clean pattern of breakout → retest → rally.
The 50 EMA has been acting like a strong dynamic support throughout the uptrend, keeping the structure intact. Every time price broke out of a consolidation or resistance zone, it came back, retested it, and then continued moving higher.
Most recently, BTC broke above a key resistance, pulled back to retest it, and now it looks like the breakout has held. This is a classic bullish continuation setup, and historically, it’s led to strong follow-through moves.
As long as BTC stays above the 50 EMA and holds support, the bullish structure remains intact.
Thanks for reading! Stay sharp and trade safe.
demand and supply strategybuy opportunity setup on BTC
the buyers are taking control in the market and i believe its making a way for a buy opportunity
apply risk management and be safe

BTC update - July 25 2025After hitting 123,000 zone, Bitcoin has started a downward correction. For the past ten days BTC was mainly showing sideways movement until it crossed below the important support zone of 115,000.
As shown on BTC's chart (on the left), we can expect BTC to continue dropping towards 113,000 zone where there's a midterm trendline and also a fib level. Whether weak or strong, an upward reaction is expected when BTC reaches down there.
BTC CME chart (on the right) also shows there is an unfilled gap located in the 114,380 - 115,635 zone which is most probably going to get filled soon. please note that at the moment BTC CME futures price is about 1,000 dollars more than that of BTC so it is probably safe to assume that 114,000 level on CME Futures chart is equivalent to 113,000 level on BTC's chart.

5 Lessons from My First 100 TradesAfter executing and reviewing over 100 real trades in crypto, forex, and gold — I found patterns. Bad patterns. Repeating mistakes. And lessons I wish someone had told me earlier.
So I broke them down into 5 key insights that changed how I trade — and might just save you thousands.
📘 Here’s what’s inside:
1️⃣ Smart Profit-Taking:
How I turned 10 R/R into 32 R/R using a dynamic exit plan.
📘Further resource:
Cycle Mastery (HWC/MWC/LWC)
---
Multi-Timeframe Mastery
2️⃣ The Sleep Edge:
70% of my losing trades happened after bad sleep. Here’s why that matters more than emotions.
3️⃣ No More Blind Stop Orders:
Why I stopped using buy/sell stops without real candle confirmation — and what I do instead.
📘 Further reading:
Breakout Trading Mastery
---
Indecision Candle Strategy
4️⃣ Multi-Layered Setups Win:
How structure, S/R, patterns, and timing stack into high-probability entries.
5️⃣ News Trading? Just Don’t.
The data behind why most of my SLs were hit near news time — and how I avoid the trap.
💡 These aren’t theories. These are real lessons from real trades.
If this video helped you or sparked an “aha” moment, give it a boost, commenting your takeaway, and sharing it with a fellow trader.
lets grow together :)

Short-term BITCOIN analysisShor-term
In my opinion, Bitcoin could make a move towards $113,000-115,000 and then start moving upwards. In any case, according to previous analysis and apart from short-term fluctuations, it could touch the target of $140,000-150,000.
Good luck
NEoWave Chart