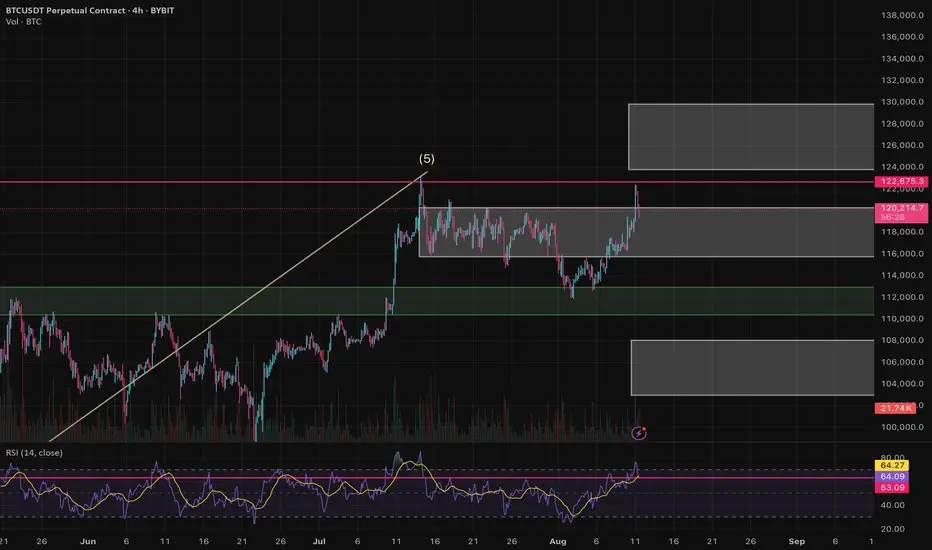
$BTC Weekly Analysis – Big Move Coming?Bitcoin is currently trading near the 122300 resistance zone.
So far it looks more like a false breakout of the 120k level, and on a bigger picture I see the potential for a correction into the 90k–100k range. However, this doesn’t necessarily have to happen in the coming days.
Possible scenarios for the week:
Sideways : accumulation within the 115k–120k range.
Bullish scenario : a daily close above 120500 could open the way for a rally toward the 125k–130k zone.
Bearish scenario : if price drops below 115k, I expect a move toward the 102k–107k area. The green zone (~111k) could provide strong support, as it has previously held the price.
RSI on the daily chart is at 63, very close to the overbought zone. A breakout above 120500 could extend the rally, but the risk of a pullback is high.
Disclaimer: The author’s opinion may not align with yours.
BYBIT:BTCUSDT.P
USDTBTC trade ideas
BTC PA📊 Price Action Analysis
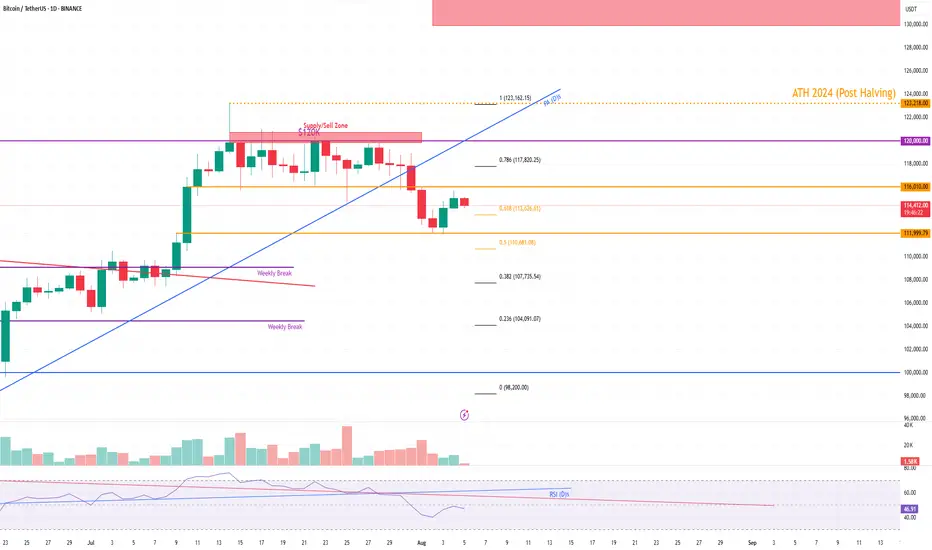
Rejection at Major Supply Zone ($120K)
Price reached a strong supply/sell zone between $120K and $123K, marked in red.
$120,000: Psychological round number — major supply area.
Price got rejected after multiple days of consolidation under this level.
Support, Resistance Levels and Trendlines
$116,010: Horizontal S/R — acted as temporary support, now resistance.
$111,999.79: Key horizontal support.
Blue PA (D)s trendline has been broken bearishly — indicating a change in short-term market structure.
Momentum is currently in a pullback/retracement phase after strong rally from late June to mid-July.
Volume Analysis
Volume is declining during the pullback — typical of retracements and not full-blown reversals.
No major volume spike indicating panic selling.
Fibonacci Retracement Analysis (Recent Swing High to Swing Low)
Key levels:
0.786: $117,820.25 — Rejected here.
0.618: $113,626.61 — Currently testing this level, price slightly above.
0.5: $110,681.08 — Next support if rejection at 0.618 persists.
0.382: $107,735.54
0.236: $104,091.07
0%: $98,200.00 — Full retracement base.
Price is showing hesitation at the 0.618, which is a crucial level in Fibonacci theory. A break and hold below this could accelerate the drop toward $110.6K and beyond.
RSI Analysis (Daily)
RSI is around 46.46 — moving below midline (50), showing weakening momentum.
Bearish divergence confirmed: price made a higher high while RSI made a lower high → bearish reversal signal.
Bullish if:
BTC reclaims $116K, closes above $120K — invalidates rejection.
RSI bounces from current level with volume support.
Bearish Bias:
Currently, structure broke down.
Testing 0.618 Fib level; failure here likely brings price to: $110,681
BTC and correction Bitcoin entered a price correction and after seeing the range ahead, I expect to buy and in this move I expect the risk-free previous purchases to be activated with a medium-term view and I will enter the purchase at cheaper prices.
In every market move, before paying full attention to the analyses of others and prominent people, only pay attention to the reality of the market and the price trend.
Preserving capital is much more important than making profits.
Be with me and grow your account, slowly and steadily.
Boost me and introduce me to your friends so that everyone can profit together.
Bitcoin – Beneath the Dual Gate, Volatility Coiled in Silence.⊣
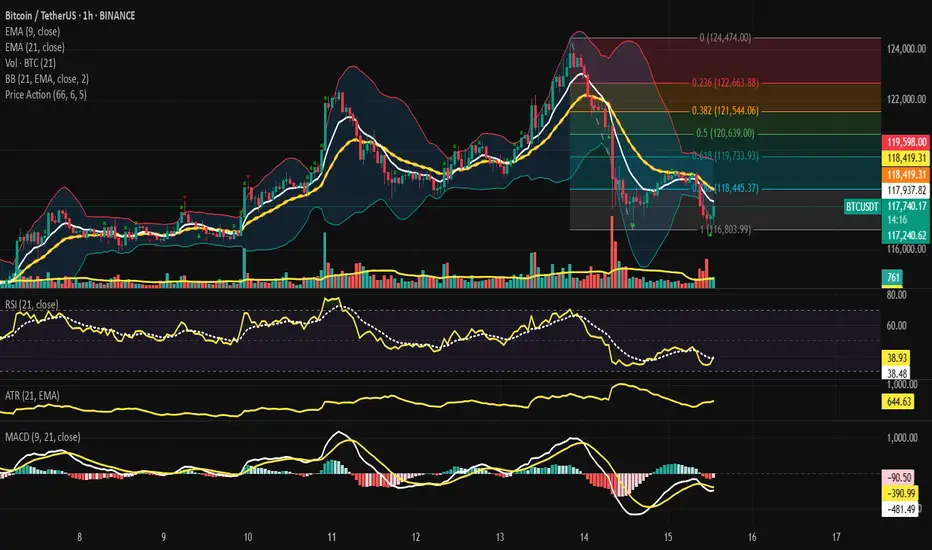
⟁ BTC/USD - BINANCE - (CHART: H1) - (Aug 15, 2025).
◇ Analysis Price: $117,097.61.
⊣
⨀ I. Temporal Axis - Strategic Interval - (H1):
▦ EMA9 - $117,809.31:
∴ Price trades below EMA9, preserving micro‑bearish control and confirming sellers’ initiative;
∴ The slope is negative, indicating persistent downside inertia rather than mere mean reversion;
∴ First tactical recovery requires candle close above EMA9 with follow‑through, otherwise rebounds are fade‑prone.
✴️ Conclusion: EMA9 is the first gate; below it, bears command intraday flow.
⊢
▦ EMA21 - $118,360.89:
∴ EMA21 sits above price and aligns with BB mid‑band, forming a structural ceiling;
∴ The angle remains down, synchronizing with the broader short‑term trend;
∴ Failure to reclaim EMA21 after testing EMA9 typically resets momentum to the downside.
✴️ Conclusion: EMA21 is the primary ceiling for any rebound attempt.
⊢
▦ VOLUME (21) - 146 / 587:
∴ Background participation is muted outside sell‑offs, signaling weak dip‑buying interest;
∴ Climax bars are associated with down candles, not expansions up;
∴ Without buy‑side expansion, momentum reversals tend to be shallow.
✴️ Conclusion: Energy is bear‑weighted; buyers have not stepped in size.
⊢
▦ BB (21, 2) - $119,636.52 / $118,360.89 / $117,085.27:
∴ Price hovers near the lower band, evidencing pressure and travel along the band;
∴ Bands remain expanded after the drop, encoding elevated realized volatility;
∴ Mid‑band = EMA21, thus a confluence cap on rallies.
✴️ Conclusion: Volatility high; equilibrium at the mid‑band acts as resistance.
⊢
▦ RSI (21, 9) - 33.19 / 37.33:
∴ RSI sub‑40 denotes bearish momentum and risk of trend continuation;
∴ No clean bullish divergence vs. recent lows is visible;
∴ Any bounce from 30–35 must couple with price reclaim of EMA9/21 to matter.
✴️ Conclusion: Momentum weak; relief bounces need validation.
⊢
▦ ATR (21) - 591.97:
∴ ATR elevation reflects wide hourly ranges and unstable micro‑regime;
∴ Expansion followed the breakdown, favoring impulsive moves over drift;
∴ Risk management must assume larger stop distances until contraction resumes.
✴️ Conclusion: Tactical caution-range expansion risk remains.
⊢
▦ MACD (9, 21, 9) - (-146.58 / -405.01 / -551.59):
∴ MACD and Signal are well below zero, confirming bear trend state;
∴ Histogram remains negative, indicating ongoing pressure from sellers;
∴ No confirmed bullish cross—only early flattening attempts.
✴️ Conclusion: Bearish momentum dominant; confirmation for bulls is absent.
⊢
▦ Fibonacci Retracement - (High $124,474.00 / Low $116,803.99):
✦ Fibo Framework - (High/Low defined, bias rules):
∴ While price is below 0.786, the retracement ladder acts as stacked resistance;
∴ Each level demands close + acceptance (multiple candles) to unlock the next;
∴ Rejection at any level implies rotation back to prior support with risk to the swing low.
✴️ Conclusion: Framework is bear‑tilted until 0.786 is reclaimed and held.
⊢
✦ Fibo 0.786 - $118,445.37:
∴ Sits just above price and near EMA21/BB mid‑band, forming a triple confluence cap;
∴ First bullish test must be clean breakout + hold above to prevent immediate fade;
∴ Rejection here typically re‑opens a drive toward $117,085 / $116,804.
✴️ Conclusion: Primary gate; breach converts short‑term bias from survival to recovery.
⊢
✦ Fibo 0.618 - $119,733.93:
∴ Traditional “golden” test where failed rallies often reverse;
∴ If price reaches 0.618 with rising volume + RSI > 45, momentum regime improves;
∴ Rejection here frequently leads to lower‑high structures.
✴️ Conclusion: Momentum checkpoint; acceptance upgrades the bounce to trend‑threatening.
⊢
✦ Fibo 0.500 - $120,639.00:
∴ Marks the mid‑retracement; crossing it often flips narrative from counter‑trend to trend‑repair;
∴ Watch for EMA21 flatten → turn up once 0.5 is held;
∴ Failure after tagging 0.5 usually prints a bull trap.
✴️ Conclusion: Structural pivot—hold above = constructive shift.
⊢
✦ Fibo 0.382 - $121,544.06:
∴ The “no‑man’s land” where sellers often defend to keep macro swing intact;
∴ Requires higher highs/higher lows on intraday to persist;
∴ Confluence with prior supply zones strengthens defense.
✴️ Conclusion: Resistance band; acceptance here signals maturing reversal.
⊢
✦ Fibo 0.236 - $122,663.88:
∴ Late‑stage retracement where profit‑taking on longs is common;
∴ If reached quickly with volume, risk of exhaustion wick increases;
∴ Only strong breadth can push a sustained extension.
✴️ Conclusion: Overhead capstone unless momentum surges.
⊢
✦ Fibo 1.000 (Base) - $116,803.99:
∴ Final defensive line for the swing;
∴ A clean hourly close below exposes extension toward measured‑move targets;
∴ Positive response here needs divergence + reclaim of EMA9 to matter.
✴️ Conclusion: Last bastion; loss invites deeper correction.
⊢
🜎 Strategic Insight - Technical Oracle:
∴ The H1 battlefield is etched with a Dual‑Gate Resistance at ($118,360 – $118,445) - (EMA21 + BB mid + Fibo 0.786);
∴ Below it, bears keep initiative; above it, the ladder opens to ($119,734 - $120,639 - $121,544);
∴ Momentum (RSI/MACD) remains bear‑set, and volume does not yet sponsor a reversal;
∴ ATR warns that the next impulse will be forceful: rejection at 0.786 likely revisits ($117,085 - $116,804);
∴ Clean acceptance above 0.786 converts the tape into repair mode, aiming first for 0.618.
⊢
𓂀 Stoic-Structural Interpretation:
∴ The chart does not plead-it states. Bitcoin stands pressed beneath the Seal of Resistance, forged by EMA21, BB mid-band, and Fibo 0.786, a triple convergence that turns each bullish attempt into trial;
∴ Below this seal, the market breathes in short bursts, oscillating between survival near $117,085 and the abyss at $116,804, while the higher rungs of Fibonacci remain untouched fortresses;
∴ RSI lingers near exhaustion, MACD sunk deep in negative terrain-signs of a mind under weight, yet with latent potential should the first gate break;
∴ Volume’s silence betrays the absence of conviction, while ATR whispers of a coiled force, ready to erupt without warning.
⚖️The Stoic mind perceives no chaos here-only order hidden in compression.
∴ To strike prematurely is to feed the opposing force;
∴ To wait for the breach, with discipline, is to act when the veil lifts;
∴ Thus, the practitioner stands patient, knowing that in markets, as in life, the gate opens only when necessity aligns with strength.
⊢
✦ Structure:
∴ Primary Battlefield: ($118,360 – $118,445) - the Dual-Gate Resistance where EMA21, BB mid-band, and Fibo 0.786 converge into a single fortified wall;
∴ Upper Ladder: ($119,734 -> $120,639 -> $121,544 -> $122,663) - sequential Fibonacci rungs, each a higher plane of contest, demanding proof of momentum before ascension;
∴ Lower Bastions: ($117,085 -> $116,804) - defensive stones at the base of the current swing, where loss would confirm structural surrender;
∴ Momentum State: RSI anchored in bearish terrain, MACD submerged, volume muted - signaling that price remains in a defensive stance;
∴ Volatility Field: ATR expanded, forecasting sudden, decisive thrusts once either the upper or lower gates yield.
✴️ Strategic Frame: The structure is one of compression beneath a fortified ceiling, coiled with the energy to either breach into a recovery ladder or cascade into deeper correction. The next movement will not wander-it will strike.
⊢
· Cryptorvm Dominvs · MAGISTER ARCANVM · Vox Primordialis ·
· Dominivm Cardo Gyratio Omnivm · Silence precedes the next force. Structure is sacred ·
⊢
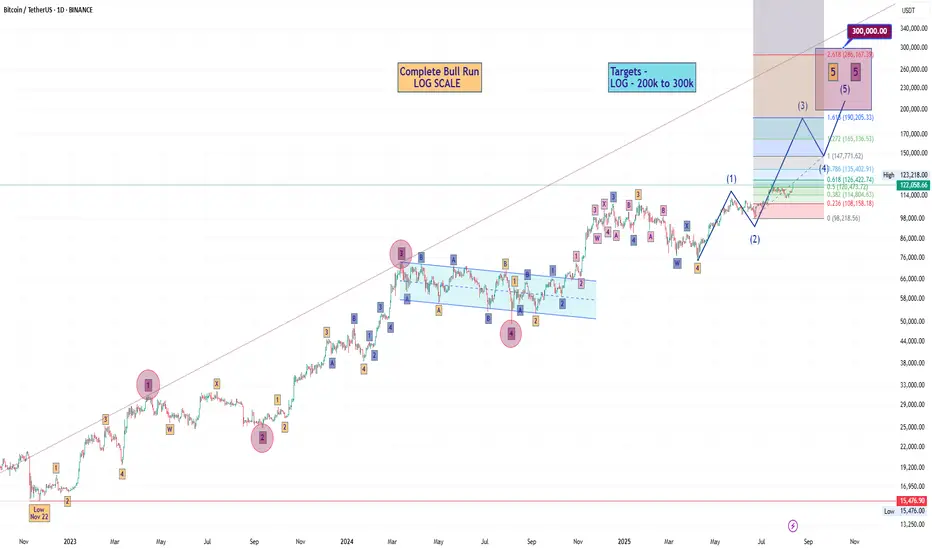
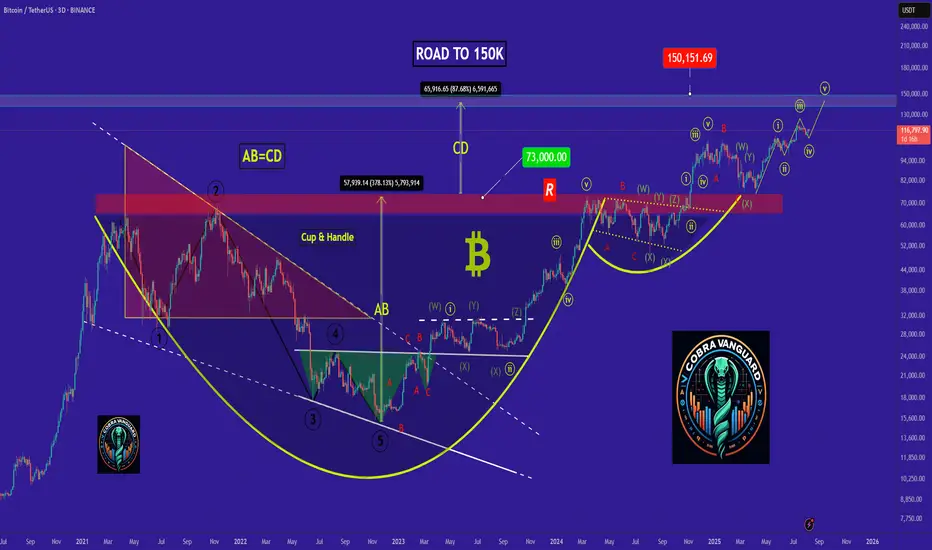
BTC - Full Elliott Wave count for this Bull RunFull BTC Elliott Wave count for this Bull Run
Chart - Bottom left Nov 2022 low of 15k
🔴 Primary waves are circled in red
.......
🔴 Primary waves 1 to 4 are complete
.......
🔴 Primary wave 1 was -
🟧 Intermediate waves 1 to 5
🔴 Primary wave 2 was -
🟧 Intermediate waves WXY
🔴 Primary wave 3 was -
🟧 Intermediate waves 1 to 5
🔴 Primary wave 4 was -
🟧 Intermediate waves ABC
🔴 Primary wave 5 is in play as -
🟧 Intermediate waves 1 to 5
🟧 Intermediate waves 1 to 4 are complete
🟧 Intermediate wave 5 is now in play as -
🟦 5 Minor waves drawn on the chart
Target - 200 to 300k
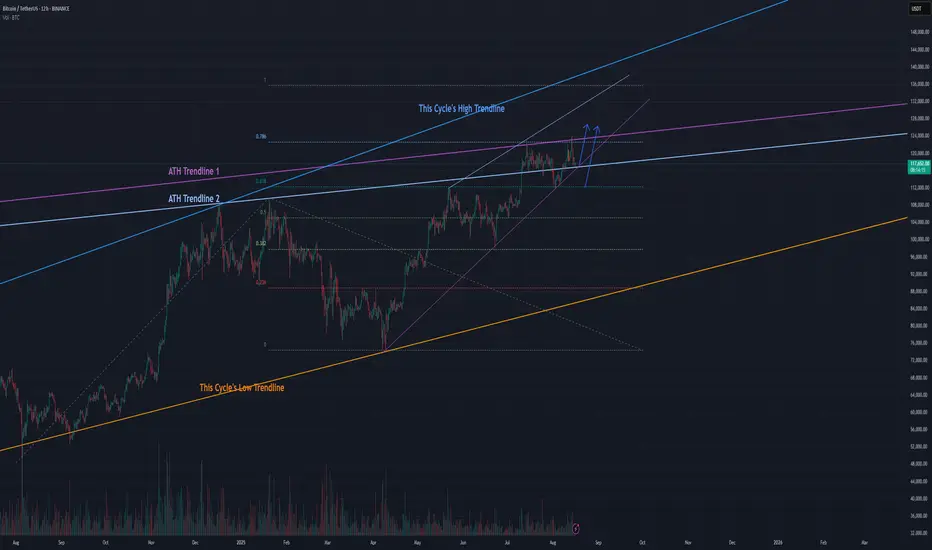
ATH Trendline - Next BITCOIN Levels to WatchThere was a CME Futures gap at just under $117k which Bitcoin came back down to fill. To explain future, the CME Futures market is only open during typical wall street trading hours, so if the Bitcoin price moves outside of that timeframe, there will be a gap in the CME Futures price chart. The gaps almost always get filled and that is what happened this week.
While it hurts to have such a strong pullback just after a new ATH, it is a good thing to have the gap filled now rather than have that waiting to be filled after the price is much higher.
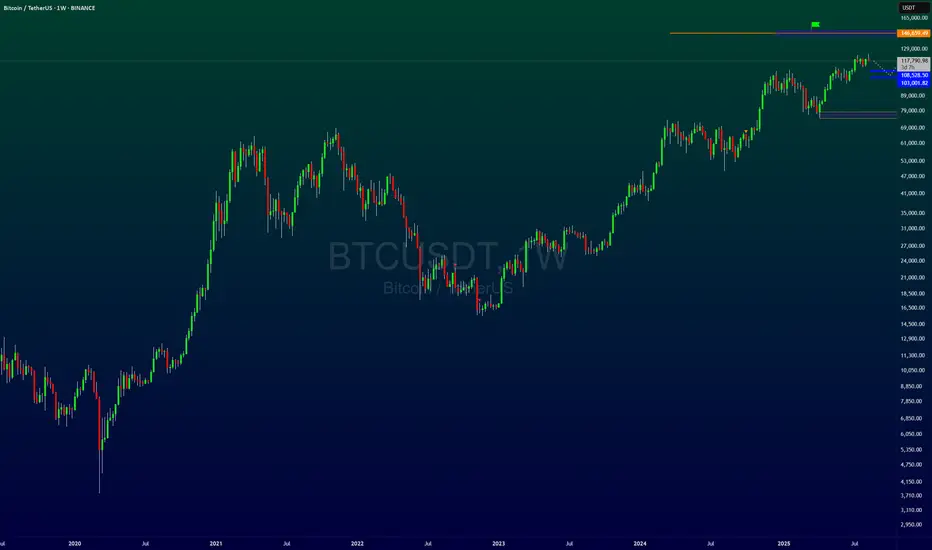
The long term, ATH Trendlines are causing some resistance as well. We'd like to see a monthly candle close above these levels flipping them from resistance into support ("S-R flip") and securing $120k as the new bottom for Bitcoin.
I think price should continue up from here based on the momentum of the new ATH and many other indicators. If price goes lower, I'm still bullish as long as bitcoin can maintain a higher low above $112k.
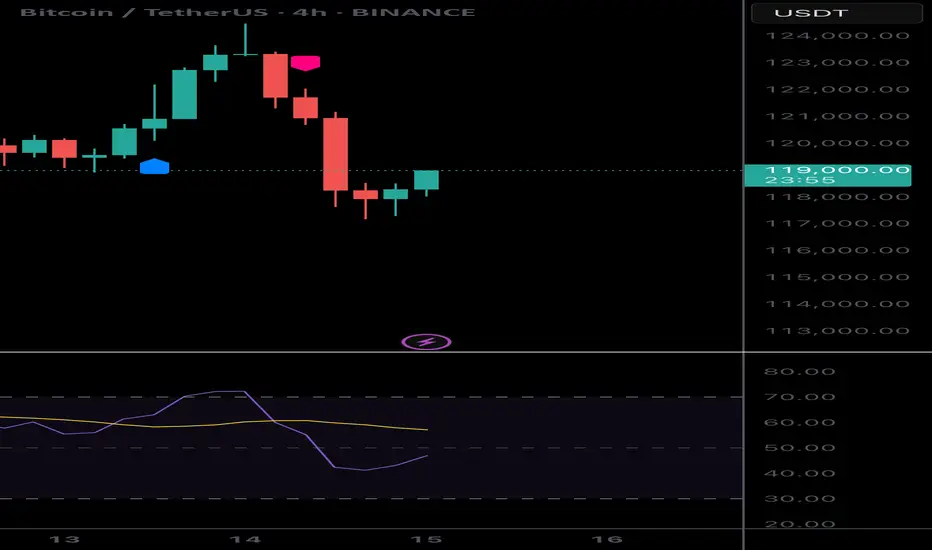
Check the BTC 4H candle right at close • Bull trigger: 4H close > 119,600
• Bear trigger: 4H close < 119,200
• Fib 61.8%: 118,340 — was it lost or reclaimed?
Then report in this format:
trigger:
close:
retest/acceptance:
next targets:
other based details cannot be provided here and that’s it. I hope you have a nice day.
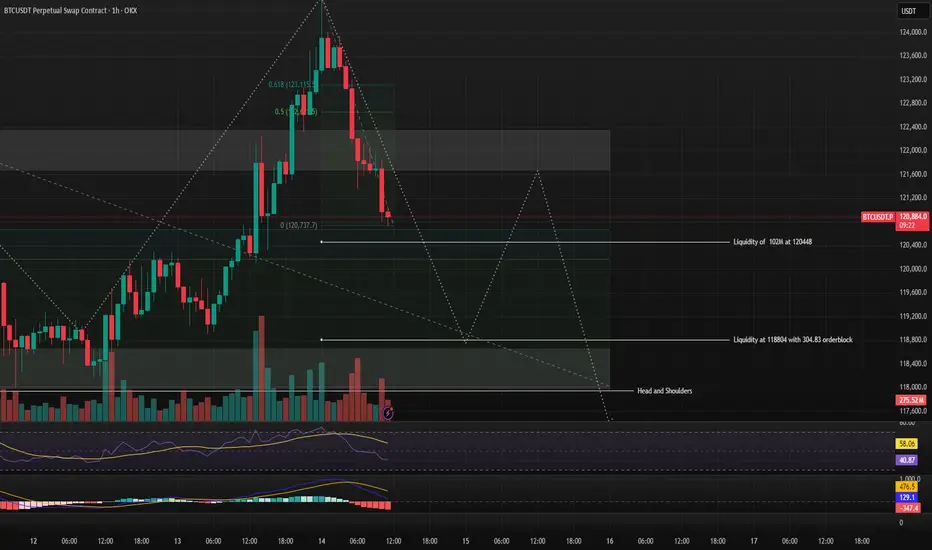
Fibonacci Golden Pocket Reversal Strategy with Liquidity TargetsA confluence-based liquidity grab and reversal strategy using Fibonacci retracement, liquidity pools, and chart patterns to forecast high-probability reversal zones.
The thought process:
- Identify swing high & low → plot Fib retracement.
- Watch for price reaction in the 0.5–0.618 zone (golden pocket).
- Confirm with nearby liquidity pools (where price is likely to be attracted before reversal).
- Add extra confirmation from patterns (like Head and Shoulders).
- Plan for short entries if bearish confluence aligns, or long entries if bullish.
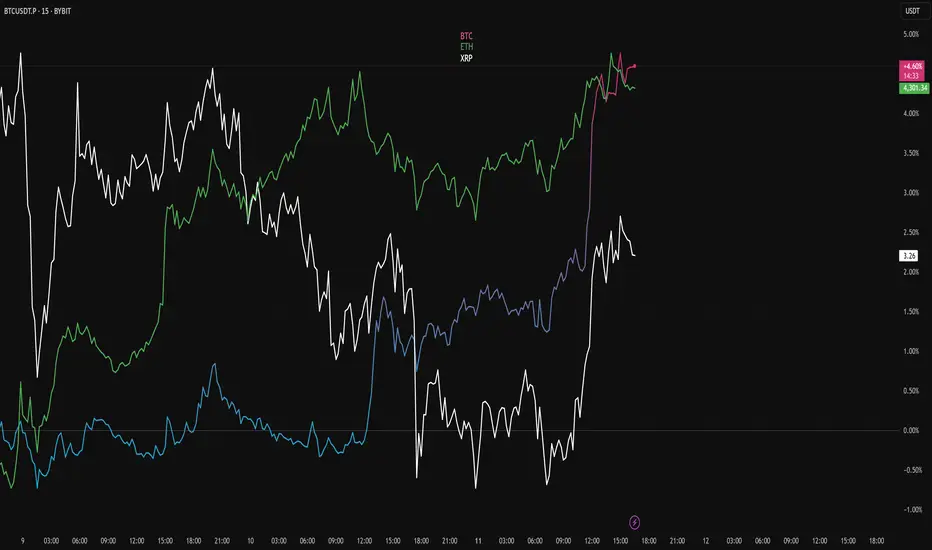
TOP 3 MARKET CAPBTC · ETH · XRP Multi-Chart with RSI Overlay
A clean TradingView setup comparing BTC, ETH, and XRP side-by-side on a % scale, colour-coded for quick correlation tracking:
Orange = BTC
Blue = ETH
Green = XRP
Includes a custom RSI indicator showing all three assets in one pane for instant momentum comparison.
Perfect for spotting divergences, leading moves, and correlation breaks across the majors.
TradeCityPro | Bitcoin Daily Analysis #154👋 Welcome to TradeCity Pro!
Let’s move on to Bitcoin analysis — today I’ll cover the 1-Hour timeframe since Bitcoin is ranging and there isn’t much signal on higher timeframes.
⏳ 1-Hour Timeframe
Currently, Bitcoin is sitting inside its support zone and hasn’t given a confirmed breakdown below this level yet.
📊 However, due to the lack of strong buyers and continuously decreasing volume, it looks like there’s still a chance for deeper corrections.
✔️ Of course, since it’s the weekend, lower volume can be expected. At the start of next week, we’ll need to see which direction price decides to move first.
🥸 Right now, Bitcoin has formed a box structure within the support zone. I believe the breakout of this box will be very important.
If the box breaks to the upside, Bitcoin could head back toward the 122545 resistance level.
If it breaks to the downside, the probability of another move toward 110000 will increase.
🔔 For now, I won’t be opening any new positions until the weekend is over. I’ll wait to see how the market reacts next week. Naturally, I won’t be giving any triggers for new positions until then.
❌ Disclaimer ❌
Trading futures is highly risky and dangerous. If you're not an expert, these triggers may not be suitable for you. You should first learn risk and capital management. You can also use the educational content from this channel.
Finally, these triggers reflect my personal opinions on price action, and the market may move completely against this analysis. So, do your own research before opening any position.
BITCOIN BULLS ARE GONNA DO THIS NOW!!!! (Fakeout Wick) Yello Paradisers! In this video, I've been updating Bitcoin price action and the Elliot Wave theory. I've been doing lots of advanced technical stuff. We've been going through channeling and updating ourselves about the most important support and resistance levels. We've been taking a look at the MACD histogram, the RSI, and the stochastic RSI. We've been professionally analyzing the volume; we've understood who is in power right now and what's going to happen next with the highest probability.
We've also been taking a look at what kind of confirmations we are waiting for in order for us to be able to open long or short positions.
Paradisers, make sure that you are trading with a professional trading strategy. Wait for confirmations, play tactically, and focus on long-term profitability, not on getting rich quick.
Remember, don’t trade without confirmations. Wait for them before creating a trade. Be disciplined, patient, and emotionally controlled. Only trade the highest probability setups with the greatest risk to reward ratio. This will ensure that you become a long-term profitable professional trader.
Don't be a gambler. Don't try to get rich quick. Make sure that your trading is professionally based on proper strategies and trade tactics.

bitcoin - Time to buy again!The price seems to have completed the fourth corrective wave, and from now on, it's time for a price increase, which will continue up to around $150k .
previous analysis
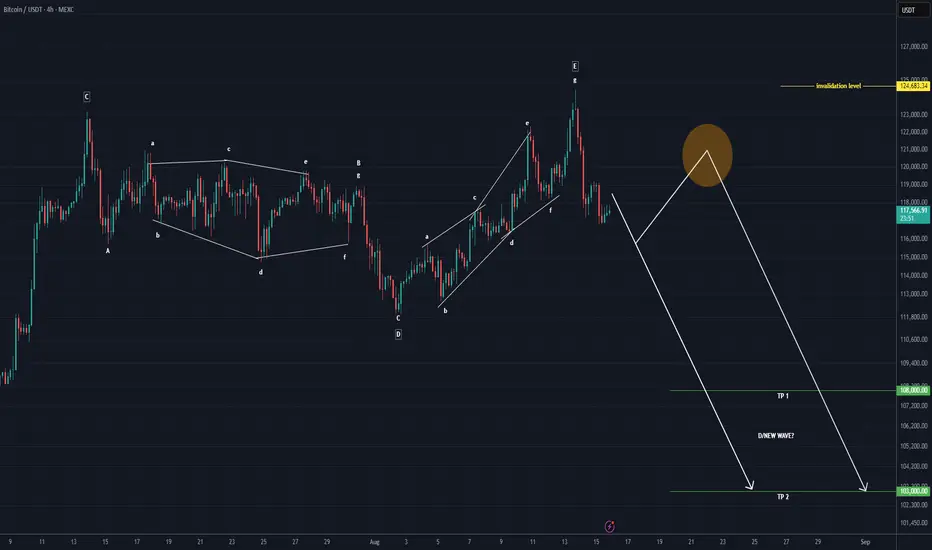
Bitcoin Looks Bearish (4H)This analysis is an update of the analysis you see in the "Related publications" section
We identified an **ABCDE structure** in the previous analysis.
Currently, the structure remains the same, with only wave **E** appearing to be completed.
The price moved close to the **first target** from the previous analysis but was rejected. This rejection seems to mark the beginning of a new bearish wave.
Now, it is expected that either from this point or after a slight upward pullback, the price will enter a correction for **wave D** or another bearish wave.
For risk management, please don't forget stop loss and capital management
When we reach the first target, save some profit and then change the stop to entry
Comment if you have any questions
Thank You
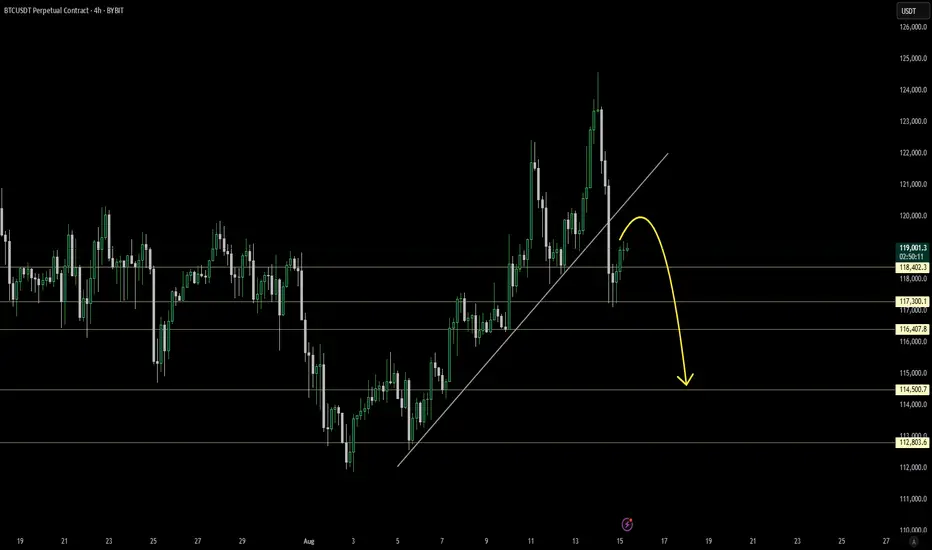
BTCUSDT – Break & Retest Signals Potential DownsideBTC has broken below its ascending trendline from early August, signaling a shift in momentum. Price is now bouncing toward the $119.8K–$120K zone, which aligns with both the broken trendline and prior support a strong potential resistance.
Key Levels:
Resistance: $119800 –$120500
Targets: $117300K → $116400 → $114500
Deeper Target: $112800 if $114500 breaks
The breakdown came with strong sell volume, while the current bounce is weaker, favoring the bearish scenario: rejection at resistance followed by continuation toward $114500.
A 4H close above $121500 with strong volume would invalidate this bearish view.
Bias: Bearish until $121500 reclaimed.
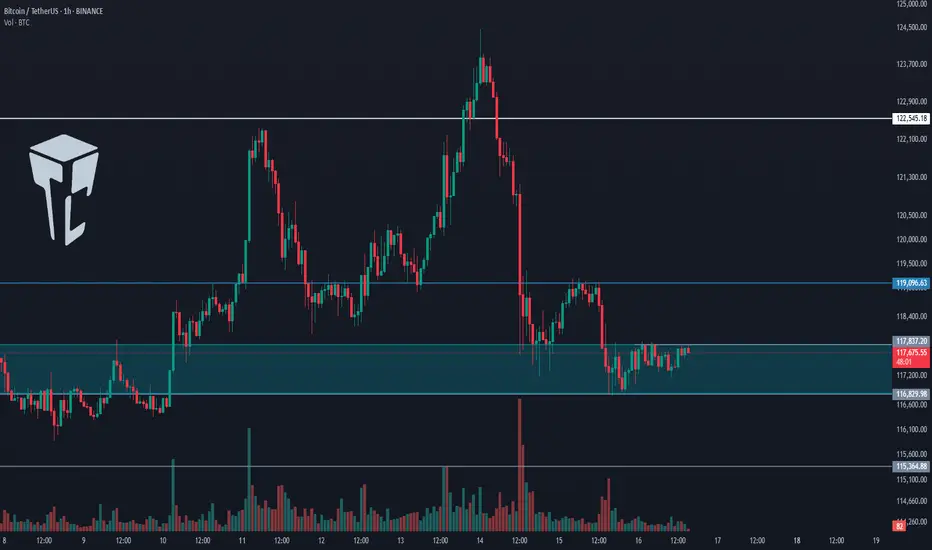
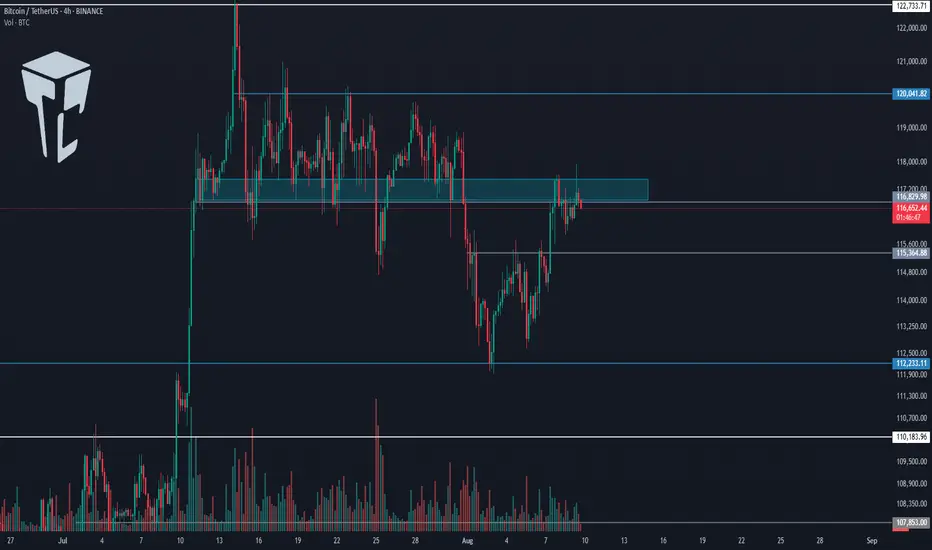
TradeCityPro | Bitcoin Daily Analysis #149👋 Welcome to TradeCity Pro!
Let’s move on to Bitcoin’s analysis. Today, Bitcoin has once again moved toward a certain range, and we need to see whether it can break this zone this time or not.
⏳ 4-Hour Timeframe
On the 4-hour timeframe, Bitcoin has once again moved toward the 117000 zone today, faced a rejection candle from this level, and now it seems to be heading for a correction.
✔️ Considering tomorrow is also a holiday, the likelihood of ranging and correcting is much higher than continuing the trend, because for the uptrend to continue, the price needs volume inflow — and today and tomorrow, significant volume is unlikely to enter Bitcoin. That’s why the probability of correction and ranging is higher.
📊 If, during the correction, the price can hold above 115364, then with the start of the new week, the probability of a new bullish wave increases significantly. In that case, we can open a long position upon breaking the 117000 zone.
✨ However, if the price breaks below 115364, the correction could extend down to 112233. This still won’t change the overall trend, but it would fake the entire move made during the week — which is not a good sign for the bullish trend.
🔍 As long as the price remains above 112233, I am still only looking for long triggers and will not open any shorts for now.
❌ Disclaimer ❌
Trading futures is highly risky and dangerous. If you're not an expert, these triggers may not be suitable for you. You should first learn risk and capital management. You can also use the educational content from this channel.
Finally, these triggers reflect my personal opinions on price action, and the market may move completely against this analysis. So, do your own research before opening any position.
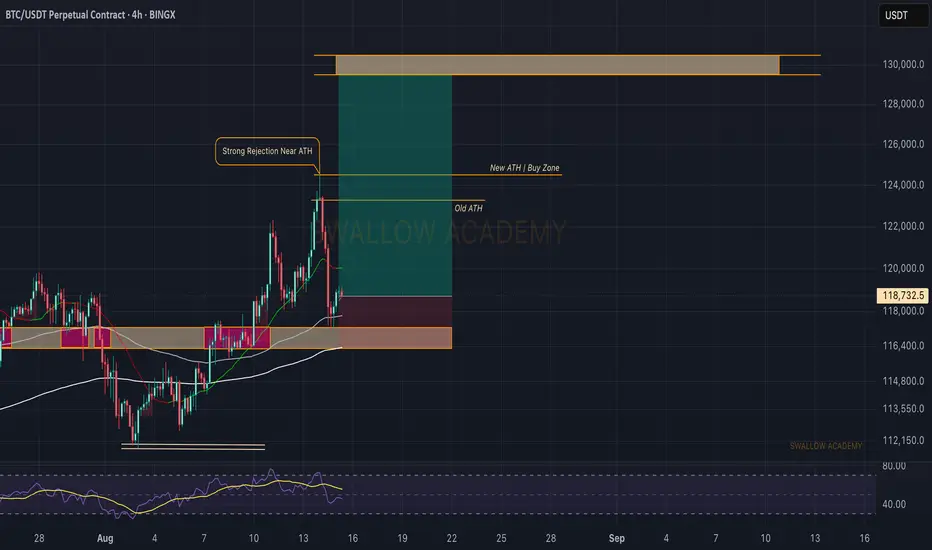
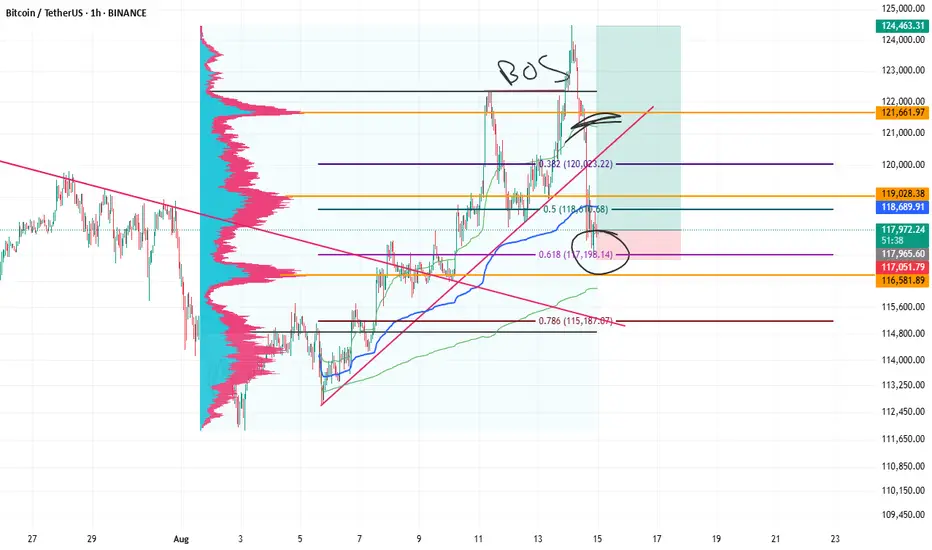
Bitcoin (BTC): Filled The CME | Break of StructureWhat a strong downside movement we had yesterday, where more than enoughmoney has been wiped out from markets.
Nevertheless, we had a good reset and as we formed that BOS on smaller timeframes, we are seeing a good chance for recovery and another attempt to move to upper zones here, so that's what we are looking for here, as long as we are above the 200 EMA line!
Swallow Academy
Longing BTCLooks like bitcoin heading higher.
This is actually a textbook inducement to lure bears into the short trap.
at the end of the day, we are at the 0.618 fib level, we are slightly below the VWAP (which usually happens when the price just collecting liquidity and reverses), also we broke the bullish leg, corrected and i think from here a higher high should emerge.
if you like more confirmations, just wait for the close above the vwap, and look for the volume spike when it does.
If you are like me, constantly been hunted by whales that targets my stoploss. Enter now and just keep your stoploss tight.
BTC - Short Setup at 0.702 Fibonacci & Fair Value GapMarket Context
Bitcoin recently rejected from a major resistance area and has since been retracing downward, finding temporary support inside a bullish Fair Value Gap. The market is currently in a corrective phase, with buyers attempting to defend lower levels while sellers look for optimal positions to reload shorts. This environment shows a classic tug-of-war between these two forces as price moves between supply and demand zones.
Consolidation and Current Phase
Although the prior consolidation has been broken, the current price action can still be described as corrective, with intraday structure forming lower highs. The bullish Fair Value Gap beneath price has been respected so far, creating a temporary base. However, the path remains complex, as the market has unfilled imbalances both above and below.
Bearish Retest Scenario
One key scenario involves a retracement toward the bearish Fair Value Gap near 117K, which also aligns with the 0.702 Fibonacci retracement level. This confluence makes it a high-probability area for sellers to step in again. A rejection from that zone would likely resume the downtrend, with the next logical target being the deeper unfilled bullish Fair Value Gap around 110K. This zone acts as a magnet for price due to the inefficiency left behind during the last rally.
Bullish Defense Scenario
For bulls to regain control, the current Fair Value Gap at 114K must hold, followed by a strong move that invalidates the lower-high structure. Such a move would need to break above the 117K bearish FVG with conviction. Only then could momentum shift back to the upside, opening the door for another challenge of the higher resistance zones.
Final Words
Patience and precision are key when dealing with setups like this. Let the market come to your level — and react with intent.
If you found this breakdown helpful, a like is much appreciated! Let me know in the comments what you think or if you’re watching the same zones.

BITCOIN BTCUSDTTHE STRUCTURE of bitcoin will be watched to see what buyers do at 117k-117,300k zone after one retest on a supply roof .
Am looking up to retest in that zone and tomorrow united states data report will be put into perspective for forward guidance.
12th the consumer price index 14th core ppi and unemployment claims will be critical as traders are waiting .
trading is 100 % probability ,risk management is key.


Skeptic's Night Byte: 3 Hacks to Beat a Losing StreakHey, it’s Skeptic 👋
We’ve all been there — losing streaks suck, but they don’t have to wipe you out.
In under 60 seconds, I’ll show you 3 quick hacks that make a huge difference:
Build friction into your trading decisions
Stop letting news events wreck your win rate
Use higher time frames to avoid the noise
Simple moves. Massive impact.
If this helped, hit that boost so I know to drop more tips like this.

Bitcoin Bounces Back — Is $120K the Next Stop?!Bitcoin ( BINANCE:BTCUSDT ) reacted well to the 50_SMA(Daily) and the Heavy Support zone($112,000-$105,800 and started to rise again.
The question is, can Bitcoin reach $120,000 again and even create a new All-Time High(ATH)!?
In terms of Elliott Wave theory , it seems that Bitcoin has managed to complete the main wave 4 in the descending channel . To confirm the end of the main wave 4 , we must wait for the upper line of the descending channel to break. The structure of the main wave 4 is a Zigzag Correction(ABC/5-3-5) .
I expect Bitcoin to trend higher in the coming hours and attack the resistance area and the upper line of the descending channel(First Target: $117,490) .
Do you think Bitcoin's main correction has begun, or does Bitcoin still have a chance to create a new ATH?
Second target: $119,991
Cumulative Long Liquidation Leverage: $113,526-$112,591
Note: Stop Loss: $111,070
Please respect each other's ideas and express them politely if you agree or disagree.
Bitcoin Analyze (BTCUSDT), 2-hour time frame.
Be sure to follow the updated ideas.
Do not forget to put a Stop loss for your positions (For every position you want to open).
Please follow your strategy and updates; this is just my Idea, and I will gladly see your ideas in this post.
Please do not forget the ✅' like '✅ button 🙏😊 & Share it with your friends; thanks, and Trade safe.

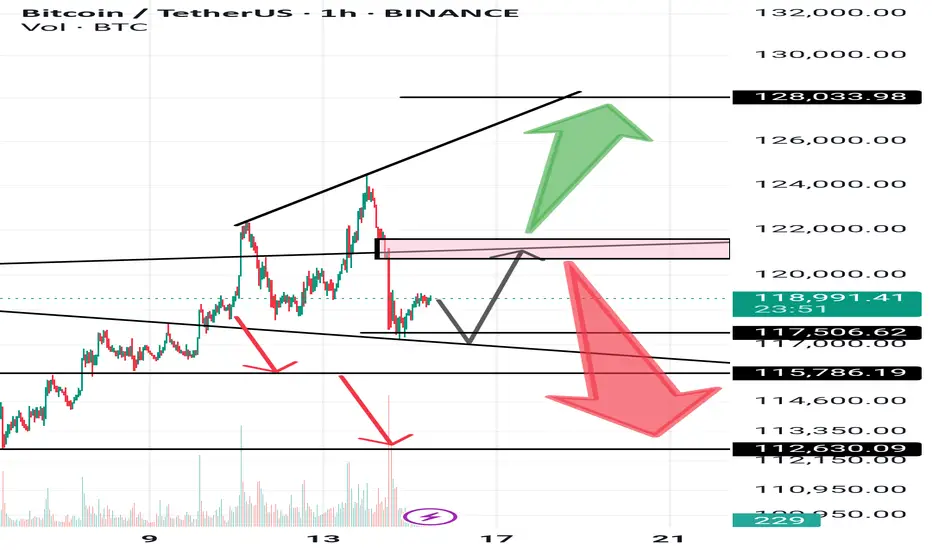
Analysis no 76 btc 1hWelcome to King BTC 3. Bitcoin can follow the path shown in the image. If the range of 115,700 to 117,500 is not broken, we will see a price increase in the range of 120,700 to 121,600. If this range is broken upwards, a price increase of around 128,000 is expected. If it returns from this range, 112,600 is not out of reach. This is just a possibility.