TradeCityPro | Bitcoin Daily Analysis #155👋 Welcome to TradeCity Pro!
Let’s move on to Bitcoin analysis. Bitcoin is still ranging with low volume. Let’s see what could happen to Bitcoin in the coming week.
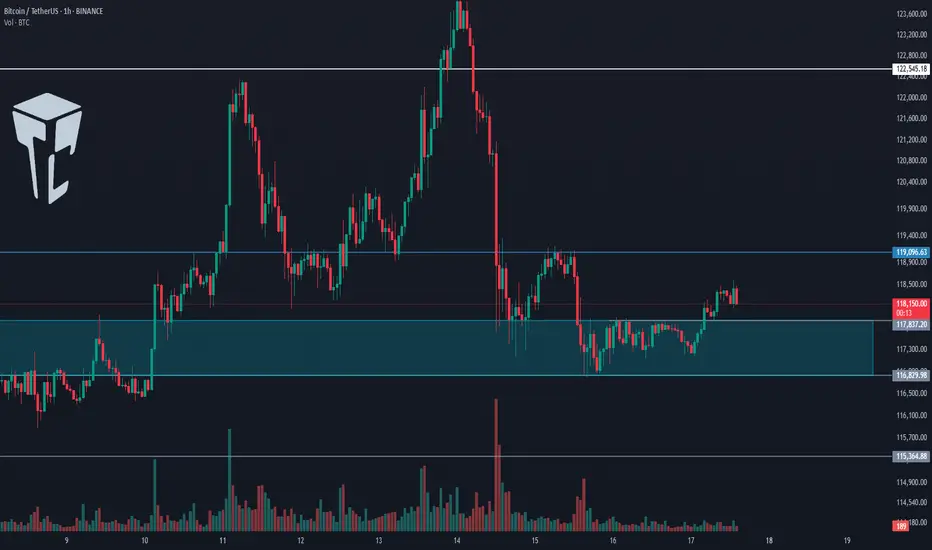
⏳ 1-Hour Timeframe
Yesterday, Bitcoin rose from its support zone and, by breaking 117837, it managed to hold above this level.
📊 The volume is still very low and will probably remain so until the new weekly candle opens. But if the volume increases, with the break of the 119096 zone we can open a long position.
📈 For long positions, my preference is still on altcoins because Bitcoin dominance is falling and the money flowing into altcoins is more than into Bitcoin.
✔️ If 119096 is broken and dominance continues to fall, altcoins can once again have an upward move and I will open a new position on altcoins.
🔔 On the other hand, if with the start of the new weekly candle the price holds below 116829, it is very likely the market will go into correction and range for the whole week. But if its initial move is bullish and it breaks the 119096 high, a new bullish leg for the market can begin.
❌ Disclaimer ❌
Trading futures is highly risky and dangerous. If you're not an expert, these triggers may not be suitable for you. You should first learn risk and capital management. You can also use the educational content from this channel.
Finally, these triggers reflect my personal opinions on price action, and the market may move completely against this analysis. So, do your own research before opening any position.
USDTBTC trade ideas
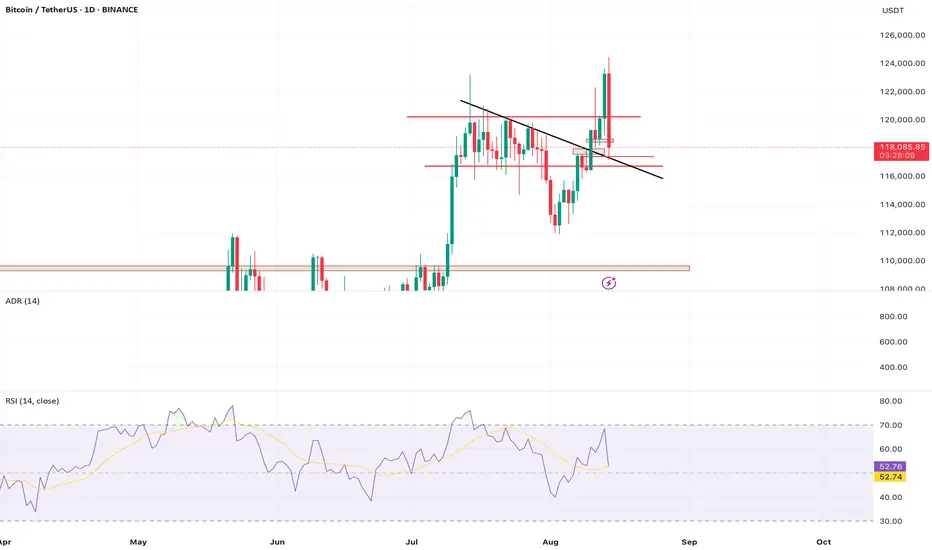
BTC Once Bearish Momentum Continue AgainBitcoin is currently testing a key resistance zone where a large pool of liquidity has formed, indicating potential for strong price reactions.
On the daily chart (D1), BTC has recently broken through the 116K level, and a new descending trend line is developing. So far, the market has not yet retested the 110K zone, which is a critical support area.
In the short term, price may retest the resistance, which could trigger a downside move if rejected. A correction is expected if bullish momentum weakens.
Key support levels to watch:
1ST Support 112K
2ND Support 110K
You may find more details in the Chart.
Trade wisely Best of Luck Buddies.
Ps; Support with like and comments for better analysis Thanks.

BTC - About to TankBitcoin is holding below these bearish trendlines pointed out on previous posts.
Here we can see liquidation levels on the HTF.
I see two potential moves:
Scenario A)
115,000 to 17,000-20,000 range
Scenario B)
3 Wave Corrective Pattern
115,000 to 35,000
35,000 to 83,000
83,000 to 8,000-10,000
DXY is retesting a major bearish breakdown on the weekly / monthly time frame. This is why we have been seeing the recent drop, and preparation for a mass liquidation / flash crash.
The above stated is my own personal views and is not intended as financial advice. Please trade responsibly.

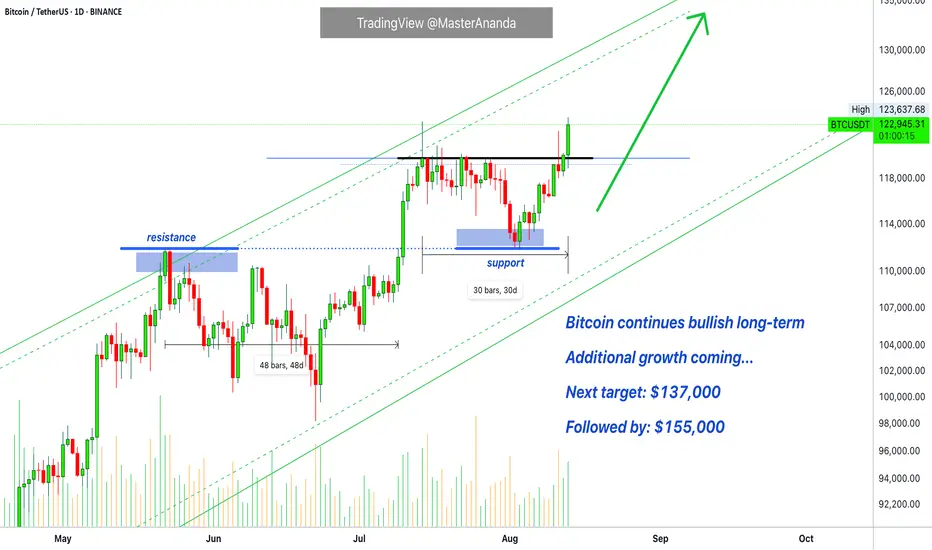
Bitcoin Hits a New All-Time High · $200,000 in SightExactly 30 days after the last peak, Bitcoin hits a new all-time high. The entire cryptocurrency market is about to explode and go wild. The altcoins market will blow up because when Bitcoin grows, the entire market follows.
Market conditions are perfect and trading volume is rising today. Bitcoin is doing what is used to do, what it always does and likes to do best, appreciating.
One Bitcoin today is worth $123,500 US Dollars, wow! Amazing.
So much, so fast, amazing growth.
Bitcoin is not only a means of exchange, a store of value but also the backbone of the cryptocurrency market. Bitcoin is the infrastructure. It is the base on top of which everything revolves.
The market continues to evolve and many cryptocurrencies are in no way related to Bitcoin, but Bitcoin sets the stage, the sentiment, the pace, the value and the price. Bitcoin is the standard.
We are having a nice week with many classic signals showing up. The week is great but started red, classic. After a small drop the action recovers and see where we are at today. Only higher, moving higher, prices going up.
Prepare for a major rise, this is only the start.
Bitcoin is set to hit a target of $155,000 followed by $209,000.
Thank you for reading.
Namaste.
Next Volatility Period: Around August 24th
Hello, traders!
Follow us to get the latest updates quickly.
Have a great day!
-------------------------------------
(BTCUSDT 1D Chart)
After this volatility period, the price has re-entered the 115854.56-119177.56 range.
Accordingly, the key question is whether the price can rise after finding support in the 115854.56-119177.56 range.
The next volatility period is around August 24th (August 23rd-25th).
----------------------------------------
To determine the volatility period, support and resistance points and trend lines must be drawn on each timeframe chart.
Support and resistance points are drawn using the DOM(60), HA-High, HA-Low, and DOM(-60) indicators included in the HA-MS indicator.
Trend lines are drawn by connecting the points where the K value of the StochRSI indicator forms peaks in overbought or oversold zones.
Therefore, the trend line is drawn by connecting the peaks formed in overbought zones with a high trend line and the peaks formed in oversold zones with a low trend line.
If these two trend lines form a channel, the trend is likely to continue. If the trend lines intersect, a new trend is likely to be created.
(1M Chart)
The trend lines on the 1M chart are not specifically distinguished between high and low trend lines, but are instead displayed in a single color.
This is because we determined that distinguishing between them is unnecessary, as they represent long-term trends.
When creating trend lines, you must use peaks created in overbought or oversold areas.
The 1M chart displays a dotted trend line, which connects points in overbought or oversold areas that do not have peaks.
These trend lines are not used to determine periods of volatility.
(1W Chart)
Draw support and resistance points and trend lines on the 1W chart, just like on the 1M chart.
When possible, draw trend lines only from recently created peaks and delete previously drawn trend lines.
(1D Chart)
Draw support and resistance points and trend lines on the 1D chart, just like on the 1M and 1W charts.
The points where these support and resistance points and trend lines intersect or intersect are used to identify periods of volatility.
When possible, areas where multiple support and resistance points and trend lines intersect or intersect are considered periods of high volatility.
Also, since trend lines on 1M > 1W > 1D charts differ in accuracy, it's best to select points where they intersect more frequently when utilizing trend lines drawn on 1D charts.
-
Indicators or other analysis techniques created by others require long-term observation to understand and utilize.
Therefore, rather than defining them as right or wrong, consider them as possible and consistently check real-time data to make them your own.
-
Thank you for reading to the end.
I wish you successful trading.
--------------------------------------------------
- This is an explanation of the big picture.
(3-year bull market, 1-year bear market pattern)
I will explain in more detail when the bear market begins.
------------------------------------------------------

Bitcoin Preparing for Explosive Breakout Toward $167KBitcoin is currently respecting a clean trendline resistance following a bullish pennant formation. Price is holding firmly above the neckline breakout from the inverse head and shoulders (ISHS), confirming demand strength around the $111K–$113K region. The structure implies another 48% rally projection, mirroring the previous measured move, which points toward a potential target at $167K.
A breakout above the immediate diagonal resistance would likely trigger an impulsive continuation, replicating earlier moves from similar setups as annotated. Bias remains bullish while price holds above the neckline pivot.
Technical Confluence
Pattern Structure: Bullish Pennant + Retest of ISHS neckline
Market Geometry: Symmetrical move projection based on previous breakout leg
Momentum Flow: Higher lows forming against compressing resistance
Volume Expectation: Volatility expansion likely on breakout confirmation
Key Trendline: "Big move started when price break this TL"
Key Price Levels
• Support Zone: $111,800 – $113,000
• Confirmation Zone: Above $123,000
• Primary Target: 🎯 $167,000
• Invalidation Level: ❌ Below $105,000
Execution Plan
• Entry: Watch for bullish pennant breakout and retest of diagonal TL
• Trigger Method: Limit buy post-breakout or confirmation on volume surge
• SL: Just below $105K zone
📥 Let us know your thoughts in the comment section, and feel free to tag your preferred altcoins for analysis.
Attention: Our August Altcoin requests will be managed through this post. Kindly submit your preferred altcoins in the comment section below.

TradeCityPro | Bitcoin Daily Analysis #148👋 Welcome to TradeCity Pro!
Let’s move on to Bitcoin’s analysis. Yesterday, Bitcoin made an upward move, but now it’s back around the same levels and has essentially faked most of that move. Let’s see what its next move could be.
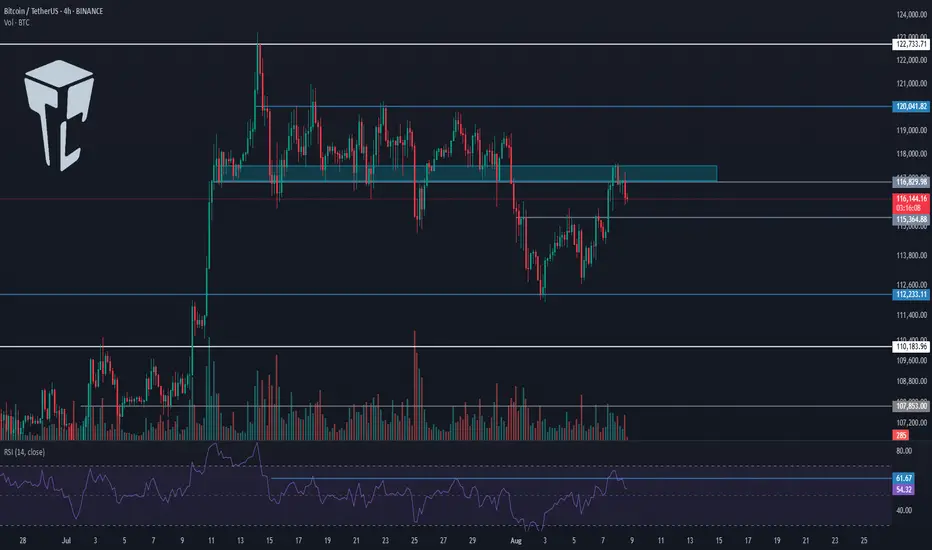
⏳ 4-Hour Timeframe
Two changes have been made to the chart. First, I turned off the Fibonacci tool because the key levels in this corrective phase have already been identified, so there’s no need to use Fibonacci levels right now.
✔️ The second change is that I moved the Maker Buyer zone slightly higher because I think this placement is more accurate and the price has reacted better to it.
✨ With this updated zone, we can see that yesterday the price reached it, got rejected, and is now moving down.
📊 Volume during this correction has been decreasing, which is a positive sign for buyers. However, RSI faked the 61.67 zone, which isn’t great from a momentum perspective, but since the market doesn’t have a clear trend right now, it’s not very important for us.
💥 In my view, as long as the price stays above 115364, this correction is logical and doesn’t harm the bullish leg. But if the correction deepens, the probability of a drop back to 112233 increases.
💫 Confirmation of a bullish move will come after breaking the current zone. For the start of longer-term bullish legs, the 120041 and 122733 triggers are very important.
⏳ 1-Hour Timeframe
In the 1-hour timeframe yesterday, we could have opened a position using a candle setup, which could have given us a 2:1 risk-to-reward. But if you didn’t take profit, you likely hit the stop-loss by now.
🔔 I personally opened this position on my sub-account, while on my main account, I currently hold long-term Bitcoin positions with wider stops.
📈 At the moment, for opening a new position on Bitcoin, we can enter on a break of 116829. However, I’ll personally wait for the price to test this zone multiple times, form a clear main trigger, and then enter upon its breakout.
🔽 As for shorts, there’s no short trigger as long as Bitcoin is above 115364.
❌ Disclaimer ❌
Trading futures is highly risky and dangerous. If you're not an expert, these triggers may not be suitable for you. You should first learn risk and capital management. You can also use the educational content from this channel.
Finally, these triggers reflect my personal opinions on price action, and the market may move completely against this analysis. So, do your own research before opening any position.
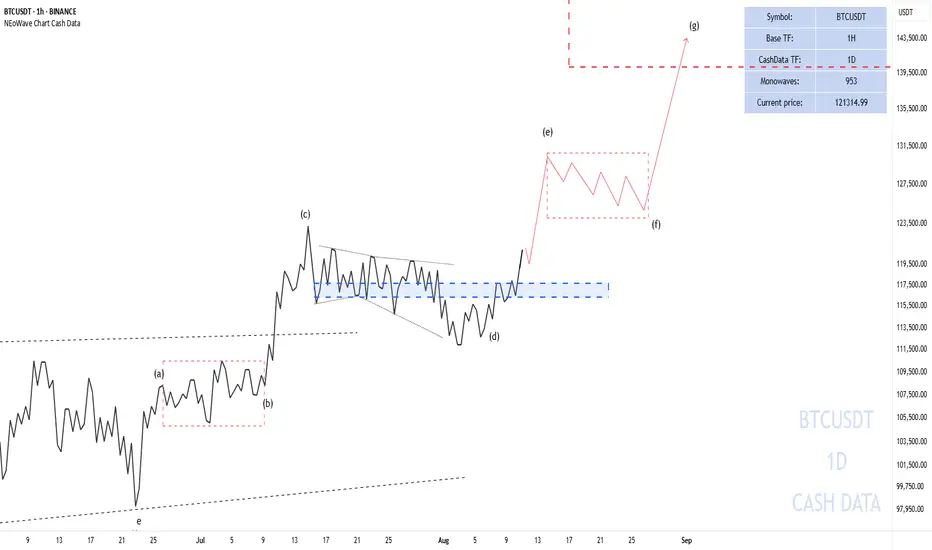
BITCOIN target $140,000-150,000Wave-g of (d) has become completely similar to Wave-a in terms of price and then moved strongly upward, surpassing the end of Wave-f. As long as the price does not break below $117,000 and consolidate there, the price targets of $140,000 to $150,000 will remain achievable.
In my last post about Bitcoin, I mentioned that Mr. Powell's speech might cause the pattern to expand, and that’s exactly what happened—Wave G has slightly extended in terms of price.
My personal opinion (not a recommendation to buy or sell):
For Bitcoin, a long-term investment approach should be adopted, and short-term fluctuations should be ignored. These short-term fluctuations can merely provide opportunities for additional buying.
Good luck
NEoWave Chart
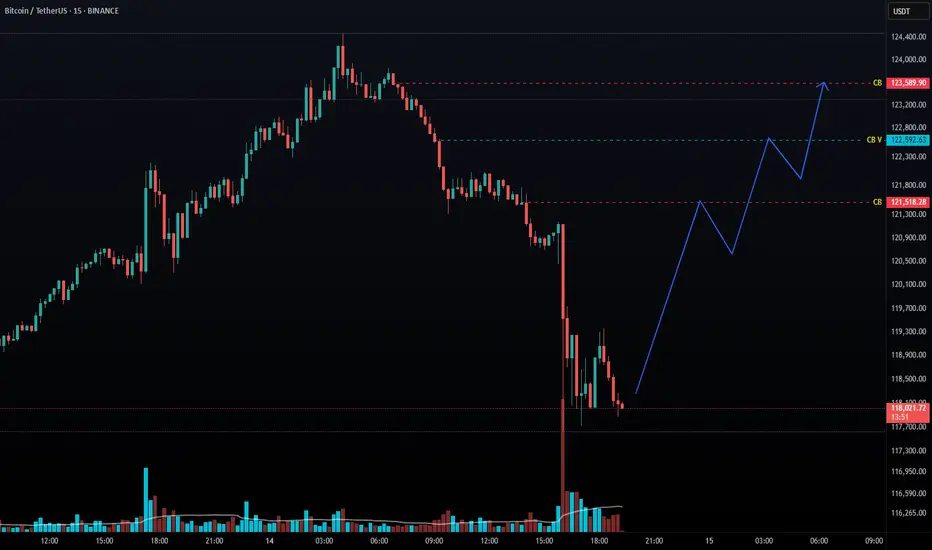
BTC Accumulates and Adjusts Slightly💎 BTC WEEKEND PLAN UPDATE (15/08)
BTC Analysis After PPI
Trading Highlights
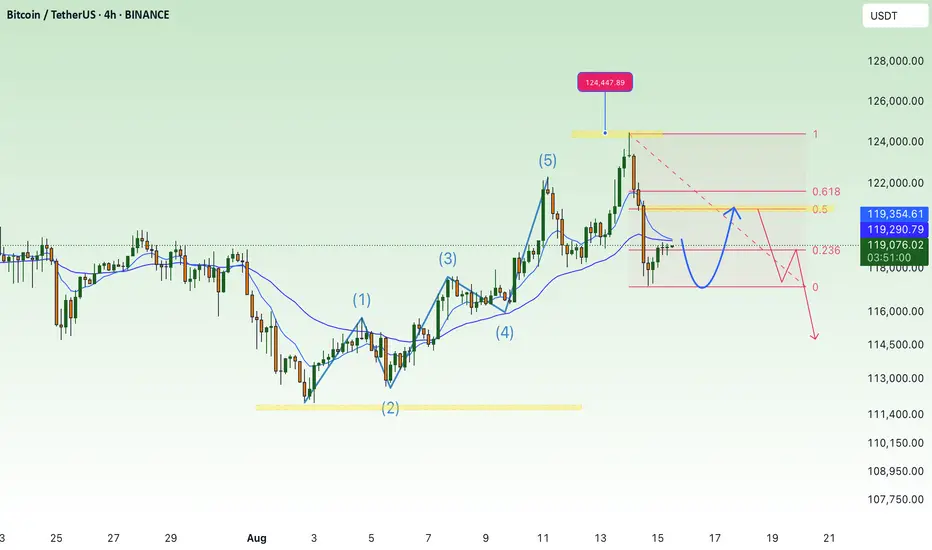
After the PPI release, BTC completed its bullish wave and reached a peak of 123.2K, exactly at the 2.618 Fibonacci Extension level – a strong resistance zone that had been anticipated.
Afterward, the price sharply reversed, dropping to the 117K support area – aligning with the main uptrend line and the 0.236 Fibonacci retracement of the most recent bullish wave → this was where we successfully executed a bottom-picking buy.
Current Price Action
The price is now recovering from 117K toward the 120.7K – 121K resistance area (a confluence of the 0.618 Fibonacci retracement, a previous supply zone, and the H4 EMA).
The short-term trend remains a technical rebound after a sharp drop, with no confirmed sustained bullish reversal yet.
Scenarios & Next Trend
• Main Scenario: Price rebounds to 120.7K – 121K → faces selling pressure → sharply reverses downward following a corrective wave toward 116K – 115K (strong support).
• Alternative Scenario: If 121K is broken with high volume, BTC could revisit the 122.9K – 123.2K zone.
Key Levels
• Resistance: 120.7K – 121K / 122.9K – 123.2K
• Support: 117K / 116K – 115K”
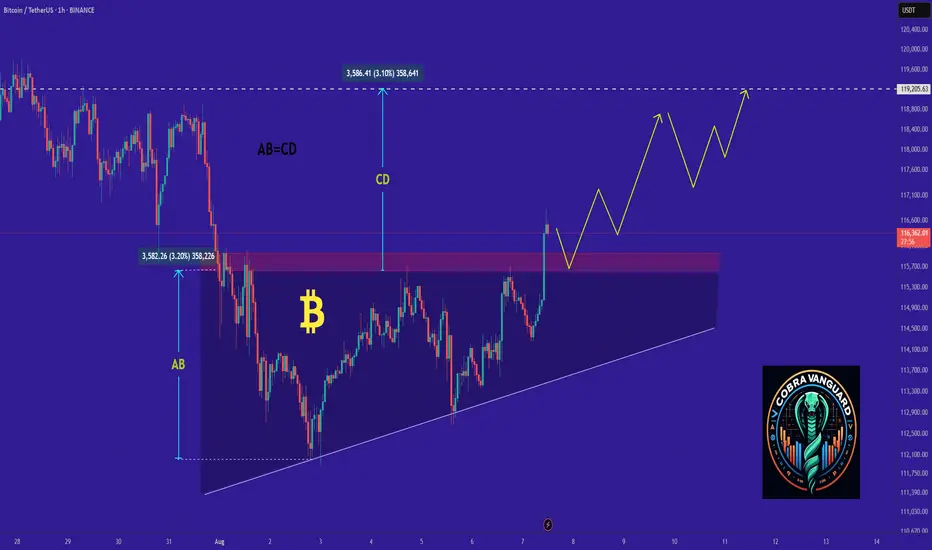
Why BTC Remains Bullish and Its Next Potential Move !bitcoin has completed and broken the ascending triangle in the daily timeframe, The price is currently supported well, which can increase the price. I expect the price to rise to around 119k .
Stay Awesome , CobraVanguard
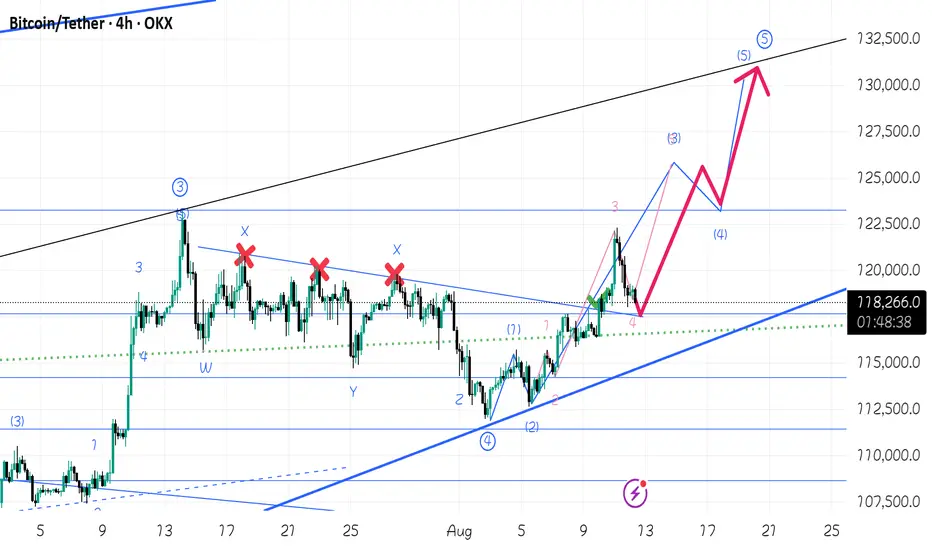
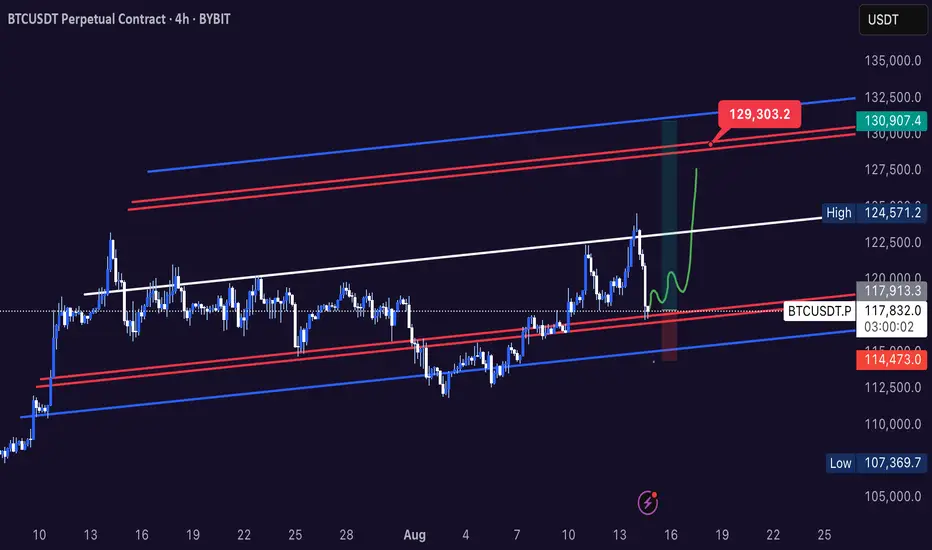
Btc and new all time high ? 130kI am trying to identify the right direction for Bitcoin. If you have seen my previous posts, you will see that most of my predictions have been correct. Unlike others, I am on a long position. You can see the reason for this in Elliott waves and similar breakouts.
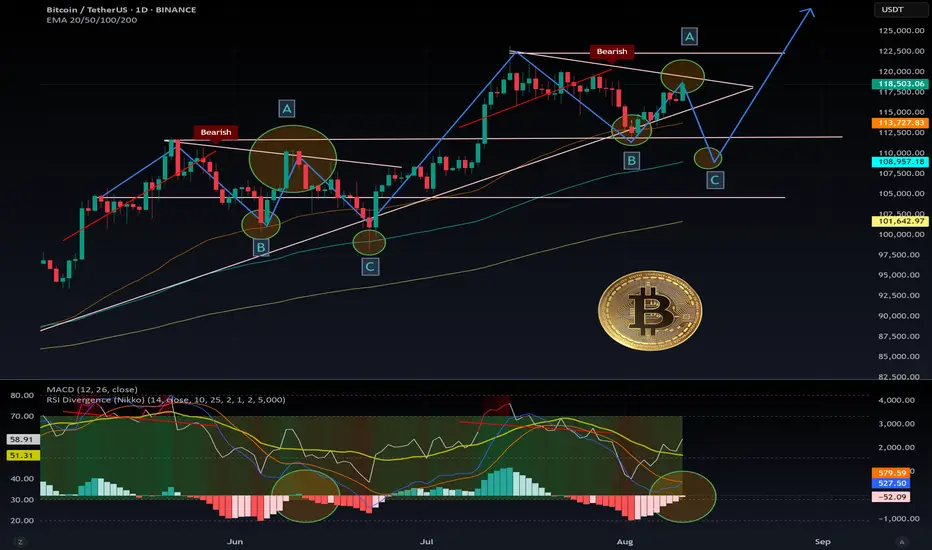
$BTC Market Outlook – Repeating Pattern?CRYPTOCAP:BTC Market Outlook – Repeating Pattern?
Bitcoin appears to be following the same repeating pattern we saw back in May–June 2025. On the Daily timeframe, a clear bull flag is forming, with both MACD and RSI confirming the setup.
In the previous instance, the pattern included two pullbacks before a strong rebound.
Currently, we’ve already seen a bounce off the 50 EMA, which acted as solid support.
You can clearly see the striking similarities, with both the MACD and RSI showing the same bearish divergence.
If history repeats itself, the likely scenario is:
Rejection near the top resistance at $119.5k
Pullback toward the 100 EMA to find support, signaling the end of the correction
The structure is mirroring the earlier move almost perfectly.
Key support levels: $115.6k, $112k, $109k, and in case of a deeper (low probability) pullback: $104k
Key resistance levels (possible rejection zones): $119.6k, $122.2k
If $122.2k is broken, we could be looking at a new ATH.
DYOR 📊
BEAR TRAP BEFORE A BULLISH REVERSAL?on the daily TF i can see the consolidation that occurred a few months ago at the ATH, after this consolidation, price broke to the downside, forming a bearish trend line.
Over the last few days, price has broken through both parts of the major consolidation from a few months ago and also the major trend line formed. Price has since broken down to touch the major trend line at 17,500.
From a technical standpoint, an entry point at 17,500, aiming for a possible break to a new ATH is my expectation.
If i remember correctly, price formed this similar pattern when breaking the ATH of 60k, could this be a repeat?
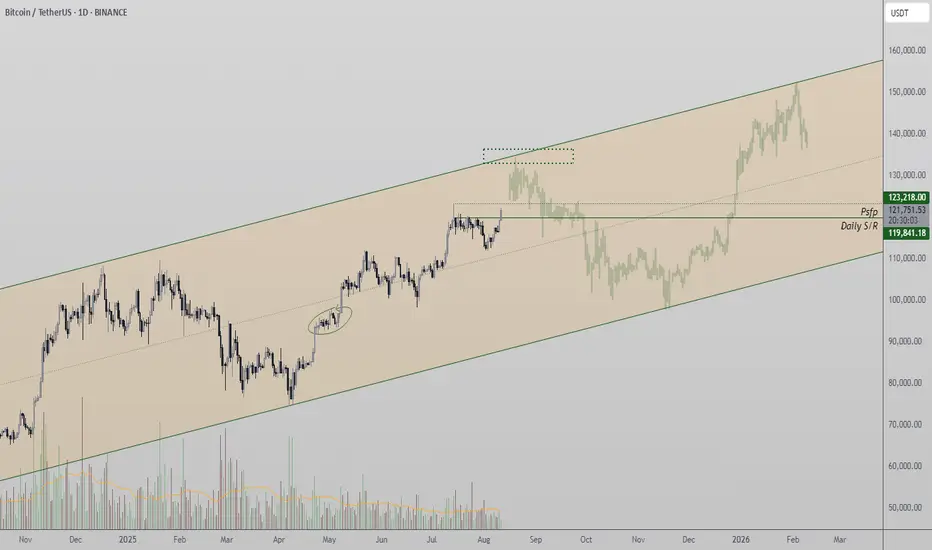
Bitcoin Eyes Higher Targets as Daily Structure HoldsBitcoin is moving higher on the daily timeframe after breaching all key resistances below its all-time high. A test of the channel’s upper boundary is likely before a corrective phase sets in.
BTC has cleared multiple resistance levels, leaving only the all-time high ahead. Once this final barrier is breached, it could trigger an accelerated push into the channel’s high resistance zone. However, this area may act as a cap for price action, leading to a rejection and rotation back toward established support.
Key Technical Points:
- Current Support: $119K remains critical to keep bullish projection intact
- Immediate Target: Channel high resistance near all-time highs
- Potential Rotation: Rejection at resistance could lead to $100K retest
From a technical standpoint, Bitcoin’s price is gravitating toward the upper regions of its trading channel. The breakout through prior resistance levels has created a clear path toward the all-time high, and beyond that, the upper boundary of the channel.
This resistance zone is significant, as historical price action suggests that Bitcoin often pauses or reverses after extended runs into high time frame resistance. A rejection from this area would not necessarily end the bullish structure, but it would likely trigger a rotational move back toward $100K support, placing BTC into a broad consolidation phase within the channel.
The primary bullish condition is that $119K support continues to hold on a closing basis. This level now acts as the structural anchor for the current uptrend. A breach below it would shift market dynamics toward a deeper correction and possibly retesting lower range levels.
In the near term, price action remains poised for further upside. Traders should watch closely for momentum shifts as BTC approaches the high resistance zone. Sustained buying volume through this area could open the door to rapid price discovery, while a rejection would confirm the anticipated range-bound behavior between $100K and the channel high.
What to Expect in the Coming Price Action
Bitcoin is likely to continue trending toward its channel high. A rejection from this zone could lead to a prolonged range between $100K support and the upper channel resistance.
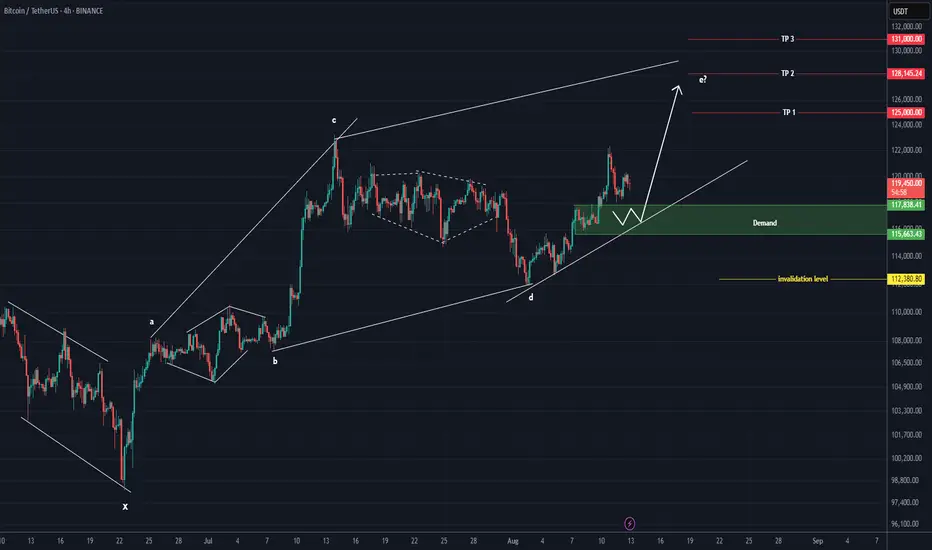
BTC is Still Bullish (4H)After completing the X wave at the bottom of the chart, it appears that Bitcoin has formed a bullish diamond-shaped diametric pattern and is now at the beginning or middle of wave E within this diametric.
It is expected that, by holding the green-marked zone, the price will soon move toward the next targets.
We have set three targets for wave E, which are marked on the chart.
A daily candle close below the invalidation level will nullify this analysis.
For risk management, please don't forget stop loss and capital management
When we reach the first target, save some profit and then change the stop to entry
Comment if you have any questions
Thank You
500% APY with Low Risk — Fake? Fact!This is not clickbait! This is a real working strategy! Read to the end!
Hello!
My name is Michael Hypov!
I have been trading for 16 years, and during this time I have seen it all: booms, crashes, crises, hype, and long periods of market silence.
My articles on technical and fundamental analysis, as well as my forecasts for Forex currencies and cryptocurrencies, are translated into 20 languages and gather millions of views.
But what I want to share with you today became a turning point in my understanding of trading.
How it all began
In 2019, I moved to Malaysia and entered the Universiti Sains Malaysia (USM) — the second most prestigious university in the country after UM.
I was lucky to get into the Master's program in Data Science and Analytics. It was an intensive course where we deeply studied mathematical analysis, statistics, neural networks, and machine learning — at a time when no one had even heard of ChatGPT yet.
This knowledge literally turned my understanding of trading upside down.
I suddenly saw that many market processes could be explained by strict mathematical laws, and therefore — predicted with high accuracy.
A bit of theory in simple terms
One of the key discoveries for me was the law of normal distribution.
Visually, it is represented by the “Gaussian bell” — a symmetrical curve where most values are in the middle, and extreme values are rare.
To make it clearer, let me give you an example.
Imagine baking muffins
The dough is the same for all, and the oven is the same. But the result is always slightly different:
most muffins turn out average in size
some are slightly smaller or slightly larger
very few are either tiny or gigantic.
If you draw a chart of “how many muffins of what size,” you’ll get that same bell-shaped curve: many in the center, few on the edges.
Examples from real life
We see the same principle everywhere:
uman height — most people are of average height, very short and very tall are rare
school grades — most students have average grades, and extremes are rare
apple weight in an orchard — most are about the same, but there are a few very small or very large ones.
💡 To put it simply: in nature and life, most values are “average,” and extremes are rare.
Why this matters in trading
In trading, the price at any given moment is a random variable.
We cannot know exactly where it will be in a second or an hour, but we can calculate the average value that is most likely to be reached.
If we return to the bell curve, the blue dotted line in the centre is the price the market tends to most often.
For each time frame, you can calculate this average price and use it as a guide.
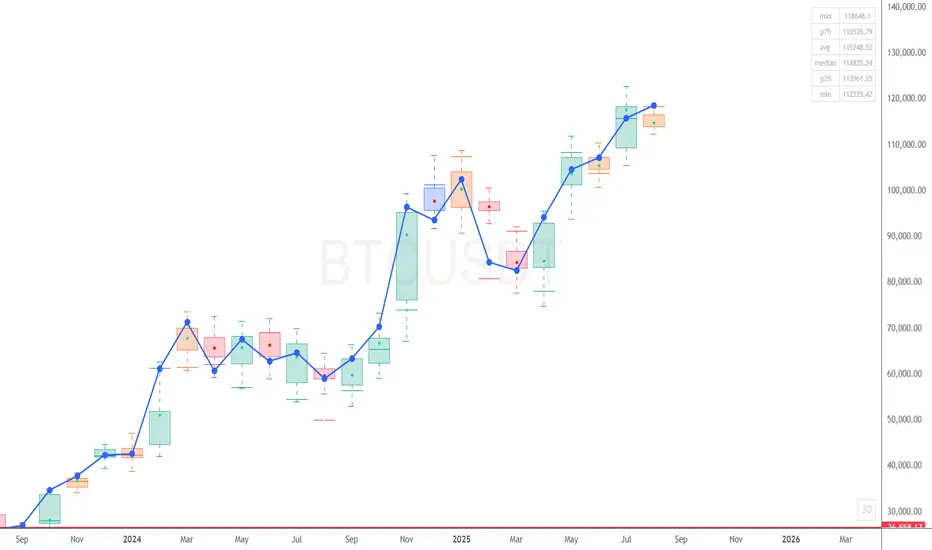
Box Plot — a chart that says more
The law of normal distribution can be conveniently represented using a Box Plot (“box and whiskers”).
The median = the expected value,
The “box” — the range of 25% deviations,
The “whiskers” — minimum and maximum within 1.5×IQR (where IQR is the size of the box body).
If you plot the asset price along the X-axis and rotate the graph by 90°, the shape will strikingly resemble a Japanese candlestick.
And if you build such “boxes” for different time frames, you get a clear picture of market fluctuations, which in some cases is more informative than a candlestick chart.
Intrabar BoxPlot and two patterns
Recently, TradingView introduced the Intrabar BoxPlot indicator. It builds these “boxes” right on the chart and marks the medians and closing prices.
On the chart, these boxes are displayed with colored dots for the medians of each period and blue dots for the closing price levels.
Comparing the price chart with the BoxPlot, you can identify two patterns:
1/ The market always tends toward the median; therefore, with high probability, if the close for the period was within the box, the candle of the next period will reach the median of the last closed candle.
2/ If the close occurred outside the box, this is a signal for a trend continuation. Moreover, the further the closing point is from the median, the stronger the signal for continued movement.
These patterns work both on 12-month candles and on second-level time frames, which makes it possible to conduct cross-analysis from macro to micro trends and build a trading strategy that delivers excellent results: on large time frames, we identify major trends, and on minute and second charts, we determine entry and exit points on micro-waves within the day.
How it turned into a strategy
Three years ago, I decided to turn this observation into a full-fledged trading system.
At first, I wrote a thesis based on this idea, forecasting Bitcoin’s price.
For three years, I tested and refined the algorithm, brought in a team of programmers who helped me build a custom trading bot from scratch.
Since trading requires a limited set of parameters — closing/opening prices, high/low, as well as box parameters and expected value — the bot’s neural model is well trainable and capable of not only conducting cross-analysis but also identifying patterns and inefficiencies in the market on its own. Moreover, the bot self-learns and improves its trading over time.
Results
We trade on Binance futures, with an average leverage of 0.63x — less than one, which almost eliminates the risk of liquidation.
We don’t use stop-losses: if a trade goes against us, the bot moves to a higher time frame and averages the position.
Maximum leverage — 3x.
Backtest results show returns from 100% to 500% per year, depending on the market cycle. On a bear market, we reduce leverage to lower risks, which also reduces returns.
The strategy has now been trading on a real account for more than a month.
The first month of trading brought +31% to the deposit.
Even giving 50% to the fund, when calculating compound interest (with reinvestment of income), your annual income will approach 500%
Thank you very much for reading to the end!
I will be glad to receive your comments under the posts and questions in private messages
TradeCityPro | Bitcoin Daily Analysis #147👋 Welcome to TradeCity Pro!
Let’s dive into Bitcoin. Today, Bitcoin has made an upward move and is triggering our setups.
⏳ 4-Hour Timeframe
In the 4-hour timeframe, Bitcoin made a bullish move today and activated the trigger I had previously shared with you in the 1-hour timeframe analysis. It has now reached the 116000 zone.
✔️ After breaking above the SMA25, the price has now reached the SMA99, which is forming a PRZ with the 116000 area. At the same time, RSI has reached its resistance zone, and rejection from here could work against this bullish leg.
⭐ On the other hand, the bullish momentum and buyer strength are very strong. The volume of the last two candles strongly favors the buyers, and considering the upward trend in the higher cycles, the probability of breaking the 116000 zone has increased.
📊 If this zone is broken, we can open a long position. The next resistances are 120000 and 122000. I’ll open this position with a wide stop so that it averages with our previous entry. If the market moves up, the position will carry more volume.
✨ In case of rejection from this 116000 zone, the main support trigger we have is 112233. As long as the price doesn’t fall below this area, we can still consider Bitcoin in an uptrend.
⏳ 1-Hour Timeframe
The trigger we had in the 1-hour timeframe was the 115327 zone. I mentioned that if the price touches it once, forms a higher low, and then breaks it, we can open a position on the next breakout.
🔍 That’s exactly what happened. Yesterday, the price hit it once and registered a higher low, but the candle that broke 115327 wasn’t ideal for entry — it was better suited for a stop-buy strategy.
📈 I didn’t open this position myself because I had mentioned that I wasn't actively trading in the 110000-116000 range, so I didn’t place a stop-buy.
💥 Now the price has entered the zone. If we get a pullback, we can open a long position in the next upward wave, which I think is a very good trigger.
🥸 However, since the RSI has entered the Overbuy zone, there's also a chance that this leg may continue without a pullback. In that case, we can use other strategies like candle setups to enter the market.
❌ Disclaimer ❌
Trading futures is highly risky and dangerous. If you're not an expert, these triggers may not be suitable for you. You should first learn risk and capital management. You can also use the educational content from this channel.
Finally, these triggers reflect my personal opinions on price action, and the market may move completely against this analysis. So, do your own research before opening any position.

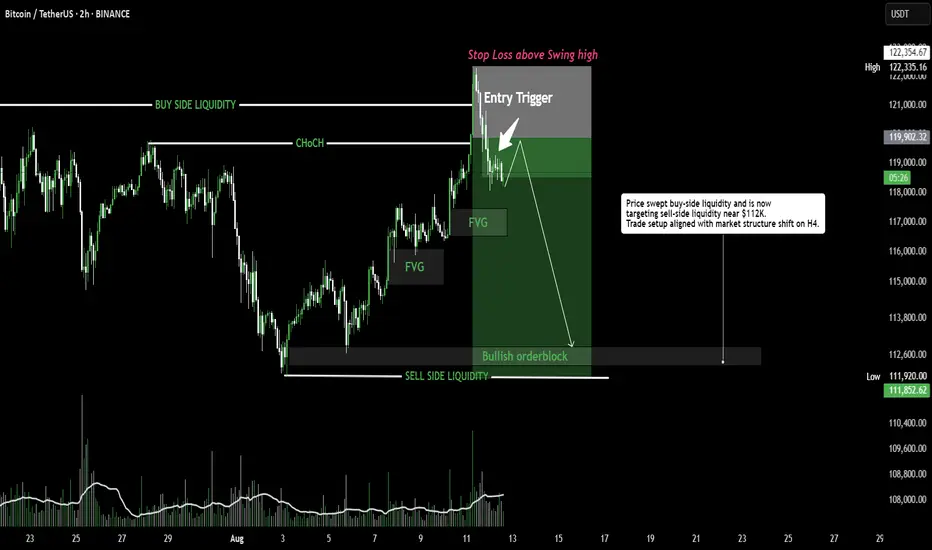
BTCUSDT- Why I Took This Trade – Liquidity & Structure ExplainedSTEP 1 - First, I start by marking the higher timeframe structure. On the H4 chart, I saw a market structure shift — signaling that price could be ready to target the sell-side liquidity.
STEP 2 – Liquidity Mapping]
I mark out two key liquidity zones
Buy-side liquidity above the swing high
Sell-side liquidity below the recent lows
Smart money will often target one side before moving to the other.
STEP 3 – CHoCH Confirmation]
On the lower timeframe, we got a Change of Character (CHoCH) — price failed to push higher and started rejecting from the buy-side liquidity zone.
This tells me buyers are losing control.
STEP 4 – Entry Trigger
After the CHoCH, price retraced into a Fair Value Gap (FVG) that also aligned with a bullish order block turned resistance.
That’s my confluence to go short.
STEP 5 – Stop Loss & Target
Stop loss is placed above the swing high for safety.
My target? The sell-side liquidity, where price is likely to run stops before reversing.
#BTCUSDT #4h (ByBit) Descending trendline breakout and retestBitcoin pulled back to 200MA support where it printed a kind of bullish hammer, seems likely to bounce.
⚡️⚡️ #BTC/USDT ⚡️⚡️
Exchanges: ByBit USDT
Signal Type: Regular (Long)
Leverage: Isolated (18.0X)
Amount: 5.0%
Entry Targets:
1) 117707.1
Take-Profit Targets:
1) 122924.9
Stop Targets:
1) 115091.7
Published By: @Zblaba
CRYPTOCAP:BTC BINANCE:BTCUSDT.P #4h #Bitcoin #PoW bitcoin.org
Risk/Reward= 1:2.0
Expected Profit= +79.8%
Possible Loss= -40.0%
Estimated Gaintime= 1 week
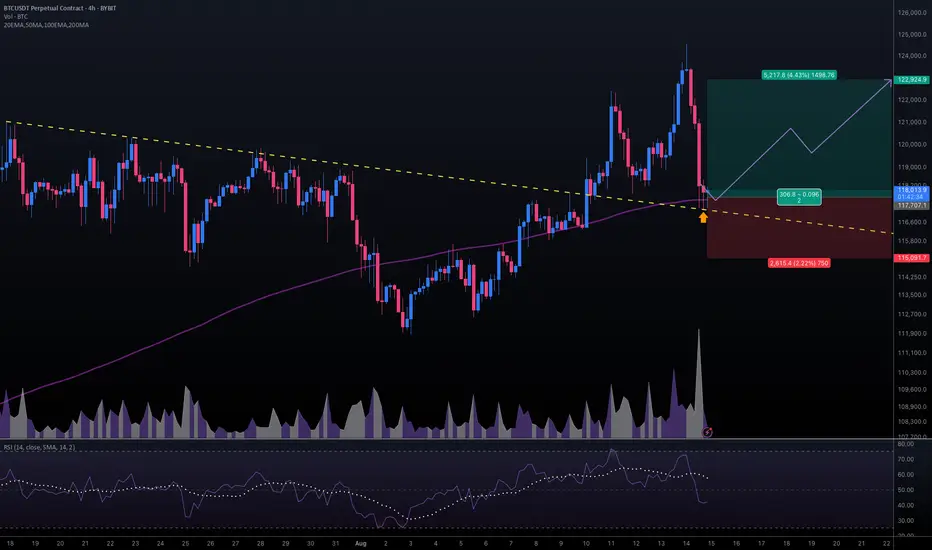
Blessed RT-Tool 3.0 Fib levels give me goosebumps everytime yeaaaah. 2% risk for 11% return.
Alright I think i can give a good statement about btc here right now. I like this patterrn what we see here but usually I see this not at ATH territories. But anyway, its possible that the bottom is in. What we need to see now is a S1S2 pattern to form. this will increase the likelyhood heavily to pressure higher for price discovery. If not we will quickly find out. Only liq grabs right now would be allowed for the idea to manifest. everything else would invalidate this
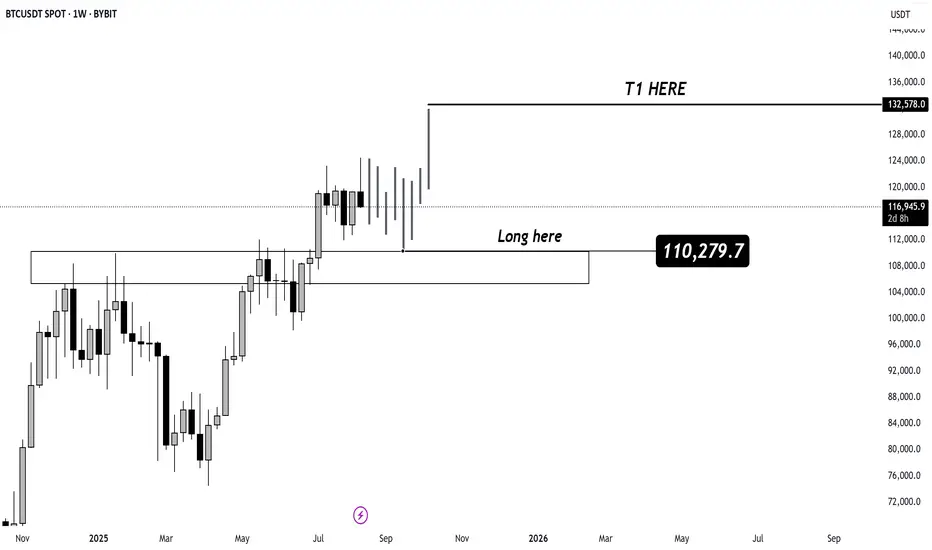
BTC Long Position Update
Entry: $110,279.7 ✅
Current Price: $117,017.5
Target 1: $132,578 🎯
📊 BTC is moving exactly as planned after breaking out from the accumulation zone. Still holding for T1, with bullish market structure on the weekly timeframe.
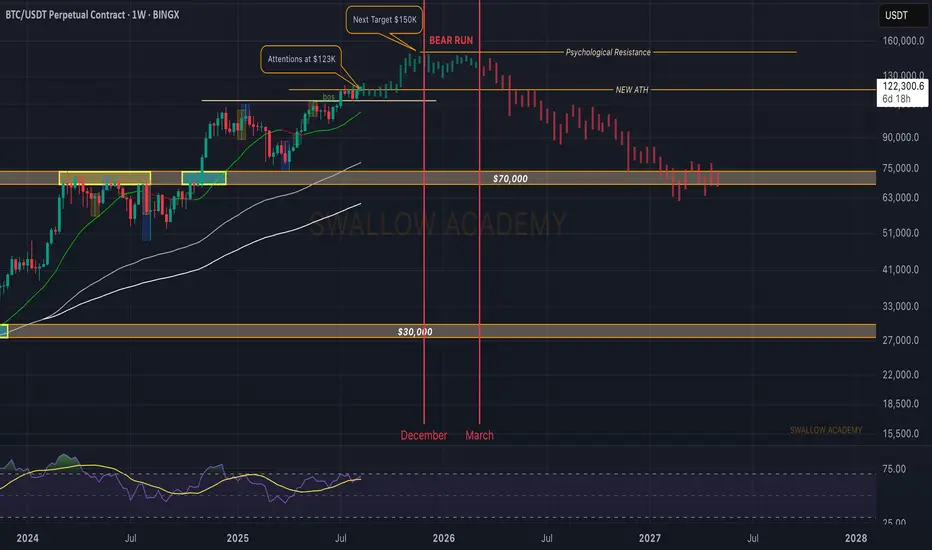
Bitcoin (BTC): Approaching ATH | Marking Potential Cycle TopBitcoin on the weekly timeframe is showing a strong start to the week, where the price is looking for a potential breakout, which then could result in yet another ALL-TIME-HIGH.
Now markets have been very volatile lately, so being close to ATH makes the situation pretty dangerous, so for better opportunities to trade, wait for that proper breakout (which most likely will be an aggressive one).
Now as we approach the end of 2026, we are also thinking that the bull cycle is in the ending phase and 2026 should mark itself as the start of a bear market, so let's get ready and prepare ourselves for it.
We still have time before that so alts still have their chance!
Swallow Academy