BTC 1H Analysis – Key Triggers Ahead | Day 8💀 Hey , how's it going ? Come over here — Satoshi got something for you !
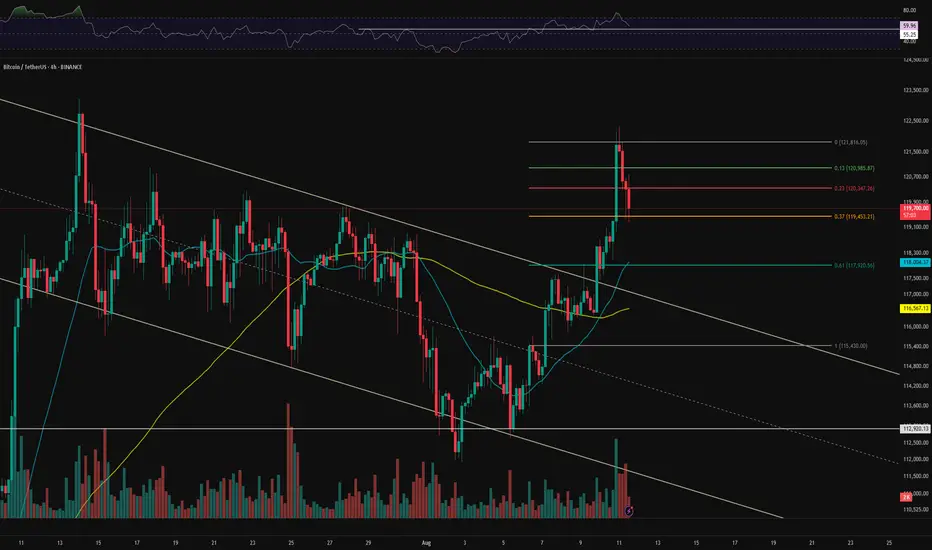
⏰ We’re analyzing BTC on the 4-hour timeframe , Bitcoin is pushing toward its all-time high with a massive, high-volume whale candle .
👀 After breaking through its resistance zones, Bitcoin surged toward its ATH but faced rejection and selling pressure near that level. Key potential support areas are the 25 and 99 moving averages, marked in yellow and sky blue on the chart. The 25 MA is close to the 0.61 Fibonacci level, around $118,000, and is moving toward the average of the last 25 candles. A reaction to this moving average could indicate whether Bitcoin will rebound or drop further .
⚙️ Bitcoin’s key RSI zone is at 55.25, which corresponds to the $118,000 range. Breaking below this could push RSI under 50 .
🎮 Fibonacci retracement drawn from the breakout and pullback of the V-pattern shows that the 0.13 and 0.23 levels failed under selling pressure, sending BTC toward lower support levels. The current support based on Fibonacci is at 0.37. If this is lost, BTC could range on the 4-hour chart between 0.37 and 0.61 .
✉️ Tomorrow at 8:30 AM New York time, the official CPI (Consumer Price Index) report will be released by the U.S. Bureau of Labor Statistics. This news can significantly impact the crypto market — if inflation decreases, purchasing power rises , and Bitcoin could set a new all-time high .
🕯 BTC trading volume and activity are strong in both directions. Each price surge is followed by a quicker consolidation, and corrections occur under selling pressure .
🔔 An alert zone is set at the 0.13 Fibonacci level to observe price behavior when it reaches that point, then decide on the best course of action .
📊 A break below Tether dominance at 4.10% would signal a long position on BTC, while a break above 4.20% could lead BTC into a deeper correction .
🖥 Summary : Tomorrow’s CPI news could spark large, powerful candles and potentially a new ATH for Bitcoin. If U.S. inflation increases, stronger selling pressure is possible. There’s no specific trigger for this current level, but breaking 0.13 will prompt me to open a position — or at least take trades on altcoins with a bullish correlation to Bitcoin .
USDTBTC trade ideas
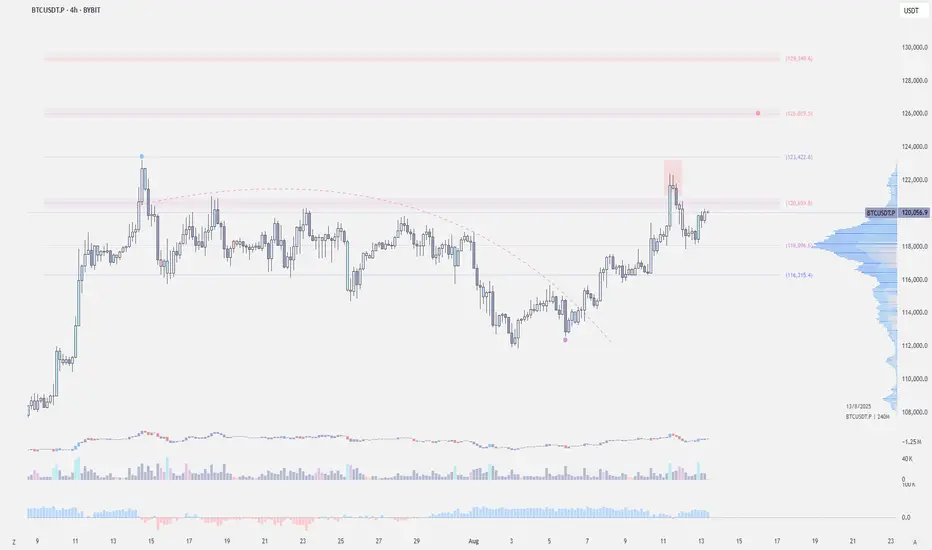
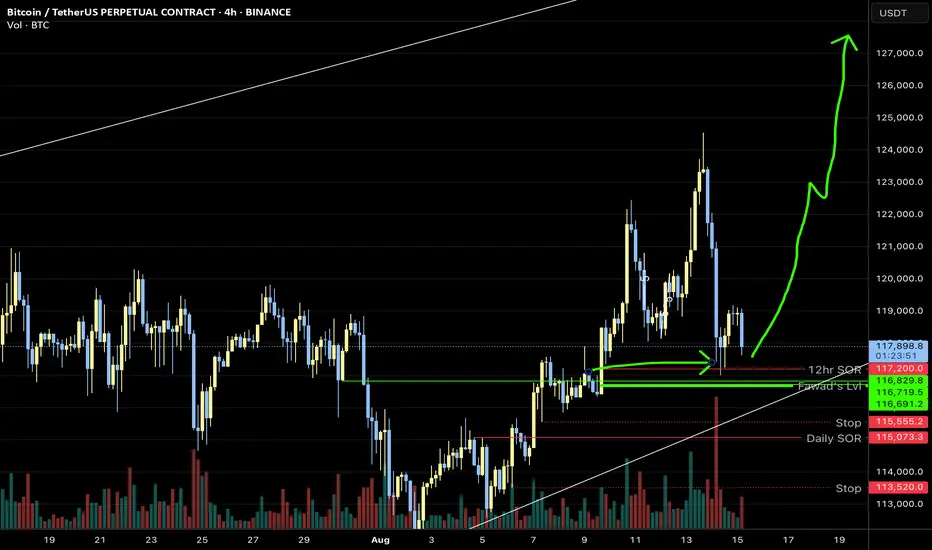
$BTC - Trouble ZoneCRYPTOCAP:BTC | 4h
We cleared all buy-side liquidity on the left.
Now the question is whether we break through the 121k trouble zone or we see another rejection.
Key support: 118k
Key resistance: 121k — if it breaks, looking for 126–127k
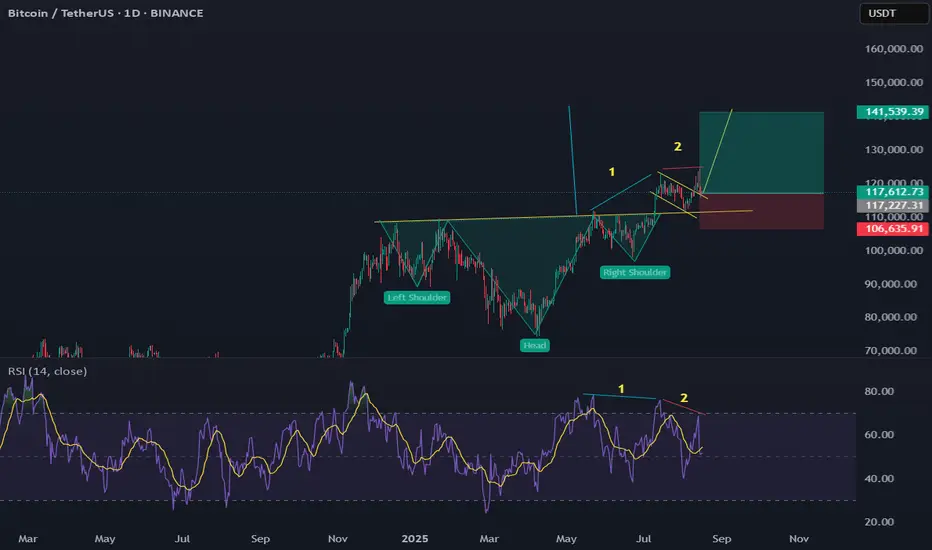
BTC – Possible Last Wave of the Bull Market?BTC has broken out from a long-term Inverse Head & Shoulders pattern, and despite short-term weakness (RSI divergence), the macro structure remains bullish.
🔍 Supporting Signs:
Breakout above neckline held as support (so far).
The wedge could be a bull flag, not a topping pattern.
Pullback may be a retest before resuming upward momentum.
Target (from H & S) projects price toward $140K–$145K.
🔼 Bullish Targets:
Short-term: $125K
Mid-term: $135K
Full target: $142K–$145K
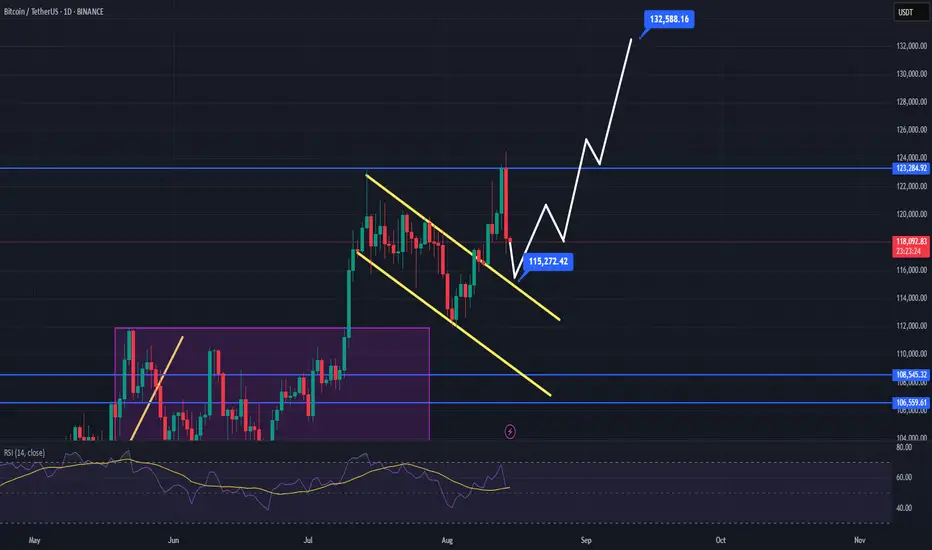
BTC next movesBTC will likely retest the breakout and also close the CME gap and make the book lighter before going for the breakout target at 132k.
DYOR
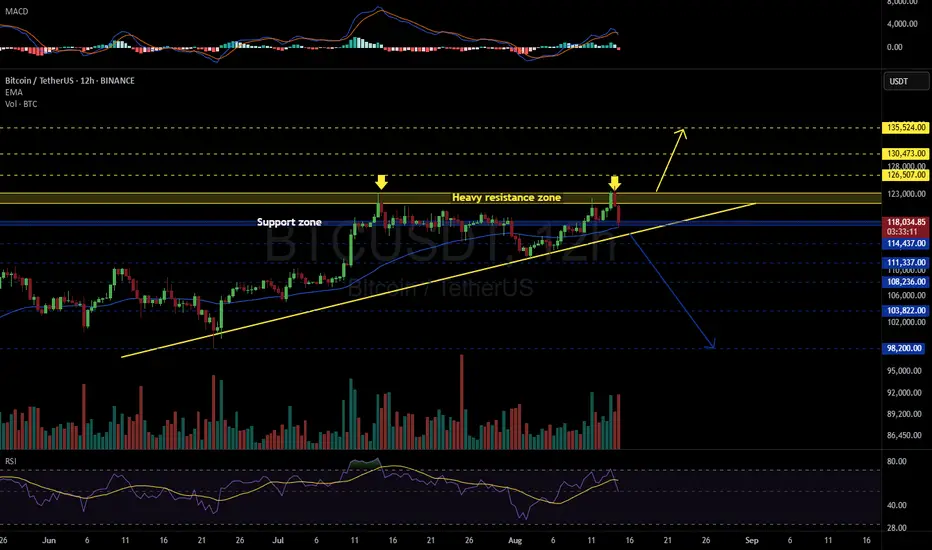
BTCUSDT 12HAs we mentioned in our previous analysis, we expected #BTC to struggle breaking above the resistance zone at $122,120 – $123,218 — and that’s exactly what happened. BTC attracted liquidity just above this zone and quickly reacted downward.
This drop also filled the CME Gap at $119,100 – $117,425.
On the 12H spot chart, BTC is still within the support zone, with the 12H EMA50 holding as support. If Bitcoin is to move higher, it must hold this zone and rebound quickly.
Otherwise, a breakdown below the triangle support line could lead to moves toward:
🎯 $114,437
🎯 $111,337
🎯 $108,236
🎯 $103,822
🎯 $98,200
If volume picks up and BTC breaks above the resistance zone, the upside targets are:
🎯 $126,507
🎯 $130,473
🎯 $135,524
🚫 Right now is not the time for leverage trades. It’s crucial to wait and see which way Bitcoin breaks. Avoid greed and make decisions with clear judgment — either stay on the sidelines or stick to the spot market.
⚠️ As always, use a tight stop-loss and apply proper risk management.
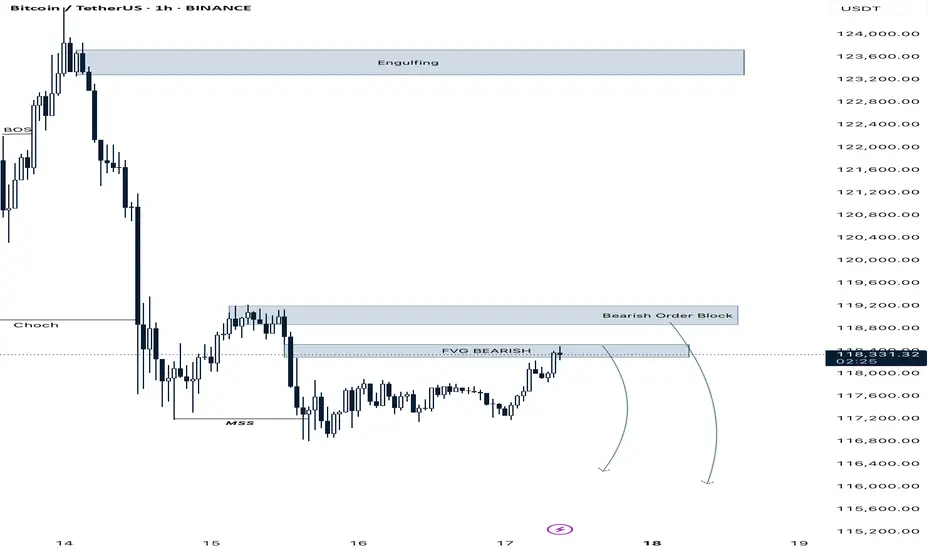
BTCUSDT H1 MARKET UPDATE A Clear Setup Bearish Signal
Bitcoin Sell From Bearish FVG Box
Bitcoin Sell From Bearish Order Block
Bitcoin Sell From Bearish FVG Box
Bitcoin Sell From Bearish Engulfing
Manage Your Trade Properly Follow Us For More trades
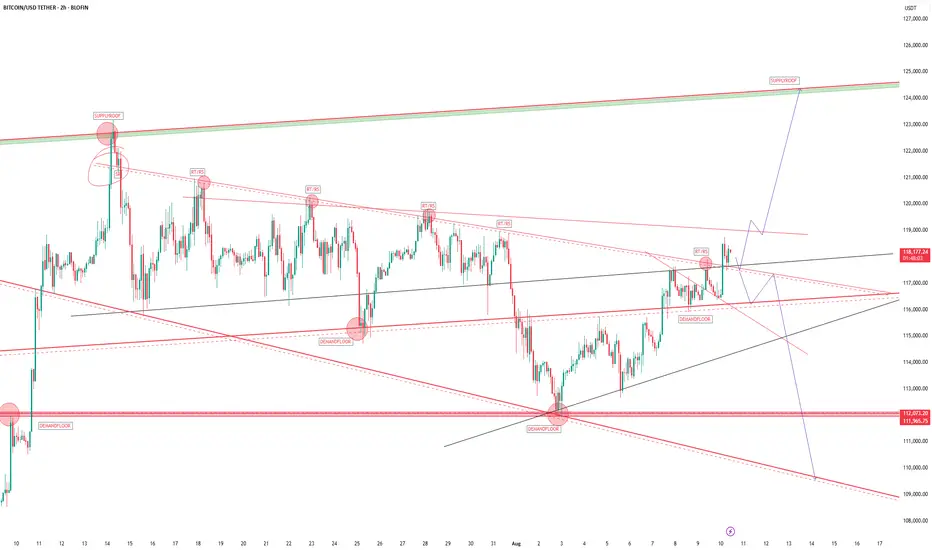
BITCOIN The breakout of the supply roof will be watched .if we have a sustained buy pressure we may hold on the lower level buy zone and target 123k current all time high and print a new all time high.
trading is 100% probability.
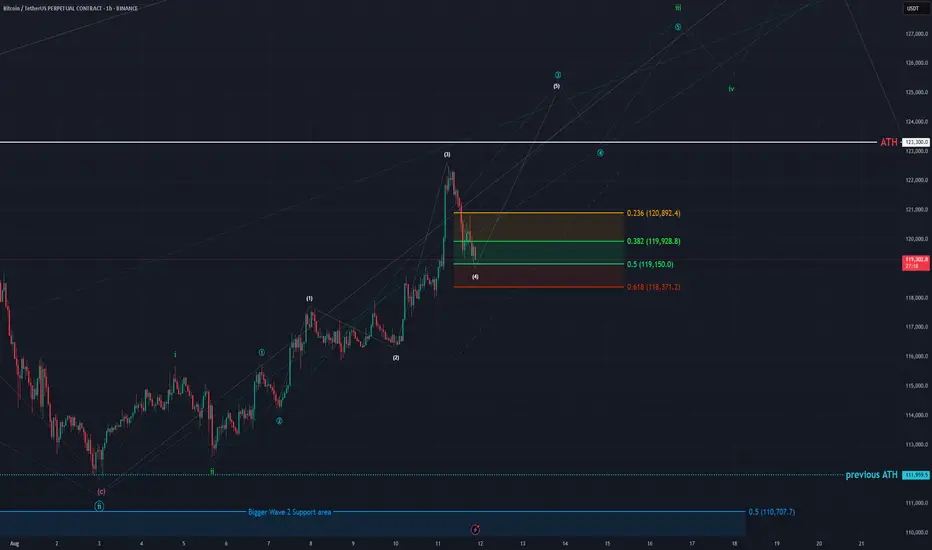
BTC - 1H Elliott Wave Analysis - 11.08.25Welcome back to our updated Elliott Wave Count for Bitcoin.
Apologizes for not publishing an update yesterday, I caught a cold over the weekend so I wasn't in a good position to do a proper analysis :( We try to post a daily BTC update and occasionally EW counts for other coins too :) Going to try to keep that style up but no promises got to see how it works out.
We have seen a strong move up from our support area as we expected.
Today we got another count on the charts which doesn't mean that the other count (diagonal) we have been discussing throughout the last week is invalid. More on that later this analysis.
In this count we assume that the move up isn't a diagonal but rather multiple 1-2 set ups.
This count allows us to go higher more directly with a strong Wave 3. We got three 1-2's, a green one, a blue and a white one on the chart. We assume that the recent aggressive push was the white Wave 3 and we're now seeing a pullback in white Wave 4 which will be followed by the white Wave 5 which finishes the blue Wave 3 etc.
The support area for the white Wave 4 is between the 0.236 FIB at 120'892 USD and the 0.5 FIB at 119'150 USD. Preferably we would see a bounce from here now in this count as we have already entered it and tested the 0.5 FIB of the support area which Bitcoin seems likes to be doing recently. In case we go lower it could be that the white five move is already done but we'll see how it develops. The blue Wave 4 support area would be around 118'000 USD to 120'500 USD.
As above mentioned this doesn't invalidate the diagonal count. It is hard to distinguish between multiple 1-2's and a diagonal. We lean towards the multiple 1-2's count because the last move up was impulsive and aggressive. If you connect the Wave 1 and 3 high you get a trendline which can be overshot by the 5th Wave in a diagonal in a such called "throw-over" which usually comes with high volume which we indeed had here. The issue is we are looking for a leading diagonal and this throw-overs are more common in ending diagonals which is the main reason for the switch of the counts. :) Hope it makes it more transparent and understandable!
I just want to make aware that with this counts we got multiple support areas which are close to each other or even overlap. Essentially the whole price range of 114'000 USD to 121'000 is important, preferably we still want to bounce from the mentioned support area above but what we want to make aware of is that a break of it doesn't turn the count bearish. Just keep that in mind when trading on smaller timeframes :)
We would appreciate a follow and boost if you like the analysis! :)
Thanks for reading.
NO FINANCIAL ADVICE.
Bitcoin overall: Hold the lowsAs unrealistic as it might seem, I believe there’s a good chance Bitcoin holds the lows here (polarity after holding SOR), and eventually takes out the high again.
113.5k imbalance, 119k+ Potential RevisitEveryone who shorted today in this area is likely to get punished, dont FOMO short!
BITCOIN After Stop hunterBitcoin is heading towards $112,000 after (Stop Hunting) unless there is new news.
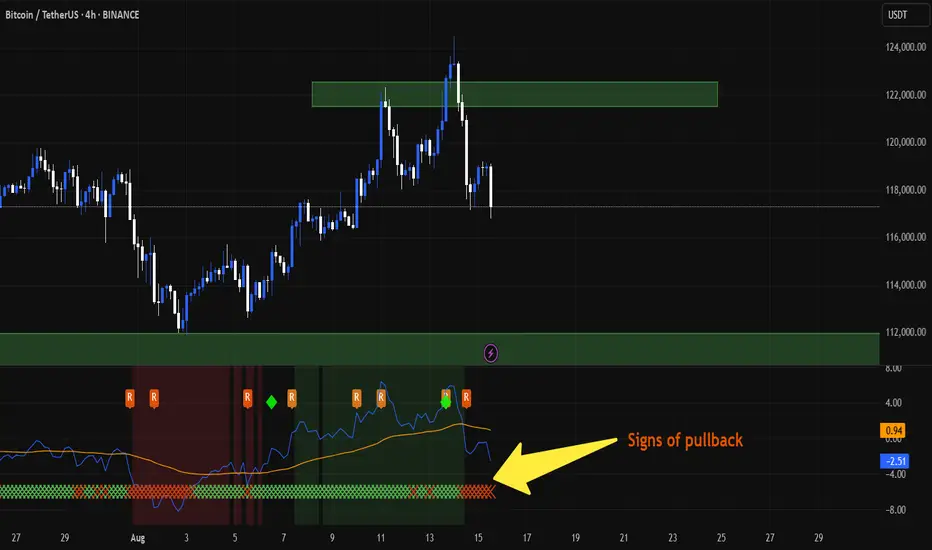
👀 Spotting signs of a pullback on the NEW RSI indicator.
Is this the calm before the next big move? 🚀
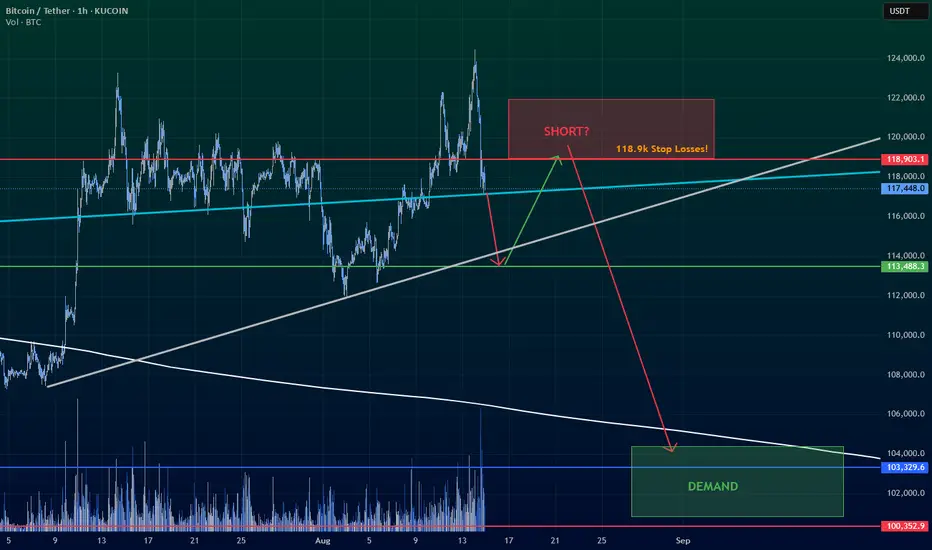
BTC - Short Plan UpdateAs per previous warning of the possibility of upwards liquidity grab first, here are updated details and a better entry for this trade.
Entry - 118,500-119,000
Stop Loss - 122,000
Target 1 - 62,000
Target 2 - 35,000
Target 3 - 8,000
- Note that per my plan we would drop to 35,000 and retrace (long) back up to 84,000 to 90,000 to form a 3 wave corrective drop.
- Note that the ultimate bottom could also sit between 17,000 to 19,000, however per my years of work, I believe 7,000 to 8,000 will be hit.
NOTE THIS IS NOT FINANCIAL ADVICE NOR IS IT A SUGGESTION ON HOW TO MANAGE YOUR MONEY. THIS IS MY PERSONAL TRADE ONLY.
Happy Trading.
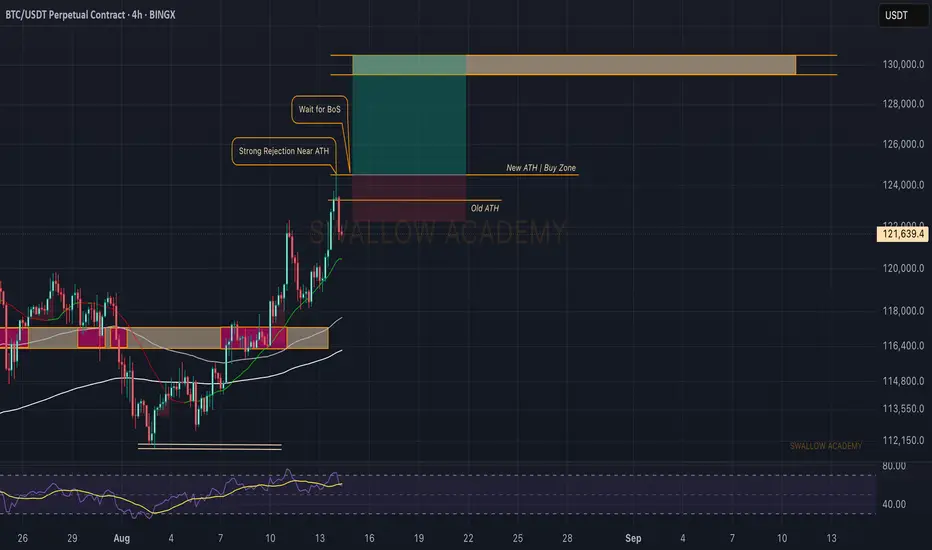
Bitcoin (BTC): New ATH - Looking For Break of StructureWe did it; the price moved exactly like we predicted and now we have formed a new ATH zone—from where we got rejected pretty fast.
So, what we are looking for now is another touch to the new ATH zone and proper BOS to form so we are in the "waiting phase" currently.
Waiting is important here and nothing is yet confirmed as long as we haven't formed that break of structure!
Swallow Academy
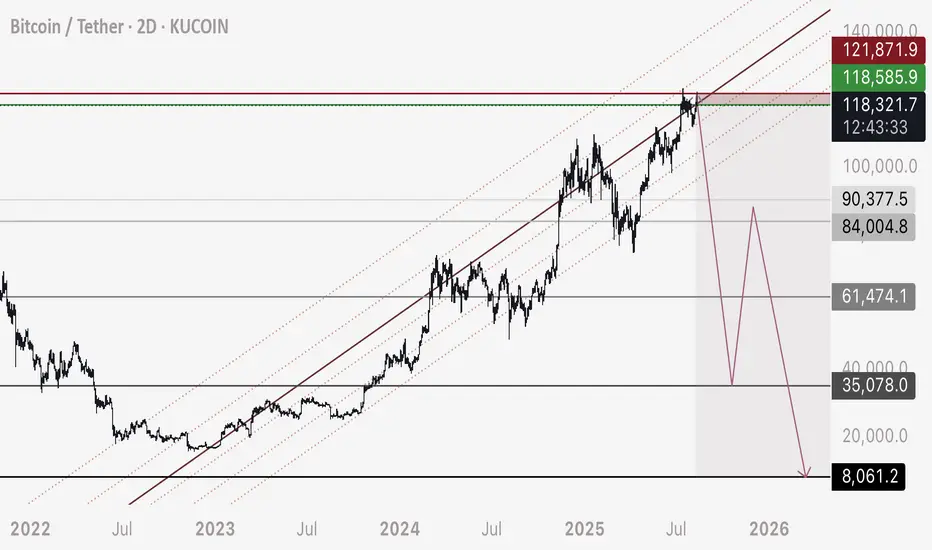
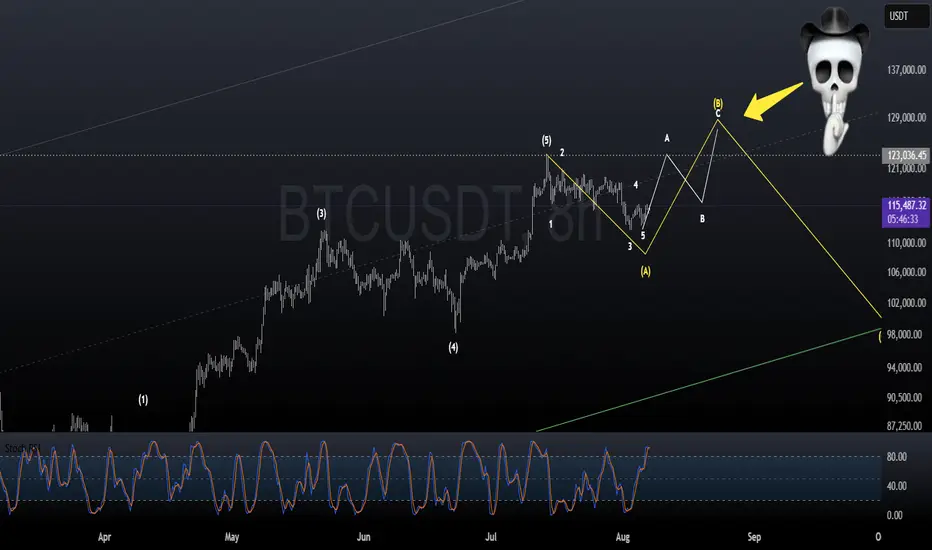
BTC, the clock is tickingLet the chart speak for itself. BTC will make new ATH before the Fed Pivot. After the pivot however, panic will occur and there will be blood on the streets.
You have been told.
P.S Not financial advice.
BITCOIN INTRADAY STRATEGYBITCOIN IS on hold awaiting a breakout for forward guidance ,we cant force the market, let it react and as hunter i look for risk to reward .if its small, i ignore the trade. For now wait .
if we get a buy confirmation the reward is high and if we get a sell confirmation the reward is higher. due to heavy bearish order from the supply roof on the candle close line chart.
think like a hunter ,a hunter save bullet for a big animal
liquidity is everything, protect it and wait on timing and strike
GOODLUCK
BYE
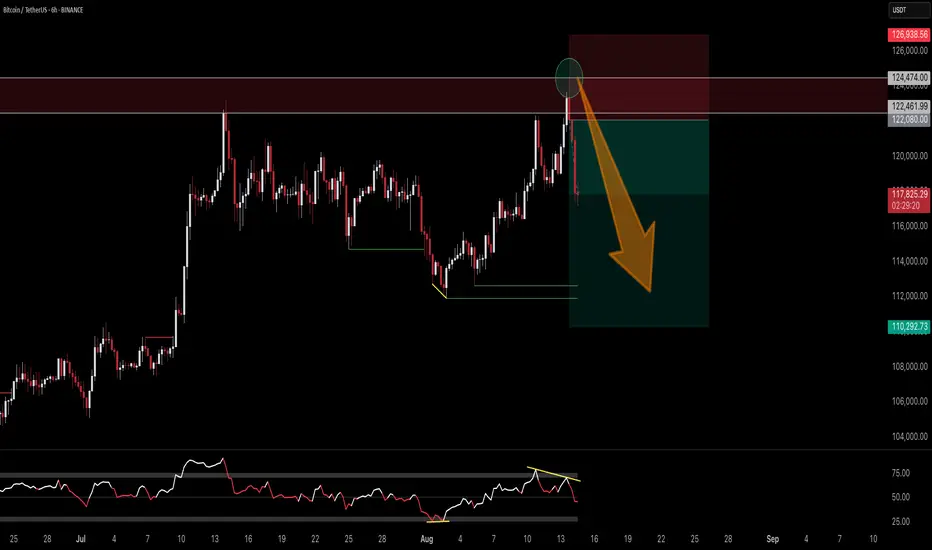
Bitcoin | Short | Target: 111k - 110kThis technical analysis is for informational and educational purposes only. It does not constitute financial advice. Remember to always research and consult with a professional before making investment decisions. Good luck! 📈💼🚀
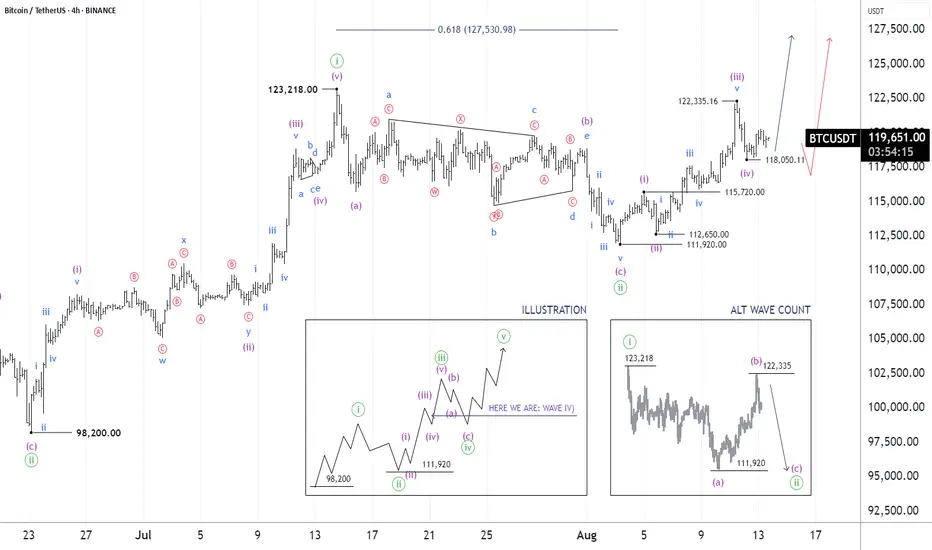
BITCOIN (BTCUSDT): 13 AUG, 2025 - ELLIOTT WAVE ANALYSISConclusion: Wave iii))-green is continuing to move higher.
Key Points: Wave iii))-green is extending, and subdividing into wave i)-purple to wave iv)-purple. I am not sure if wave iv)-purple is finished, but it should not move lower than 115,720 (Invalidation Point: Wave 4 should not overlap wave 1).
On the other hand, 118,050.11 acts as a key level that price needs to hold higher, to gain confidence, weight for this view.
©By Hua Chi Cuong (Shane), CEWA-M | Certified Elliott Wave Analyst - Master Level
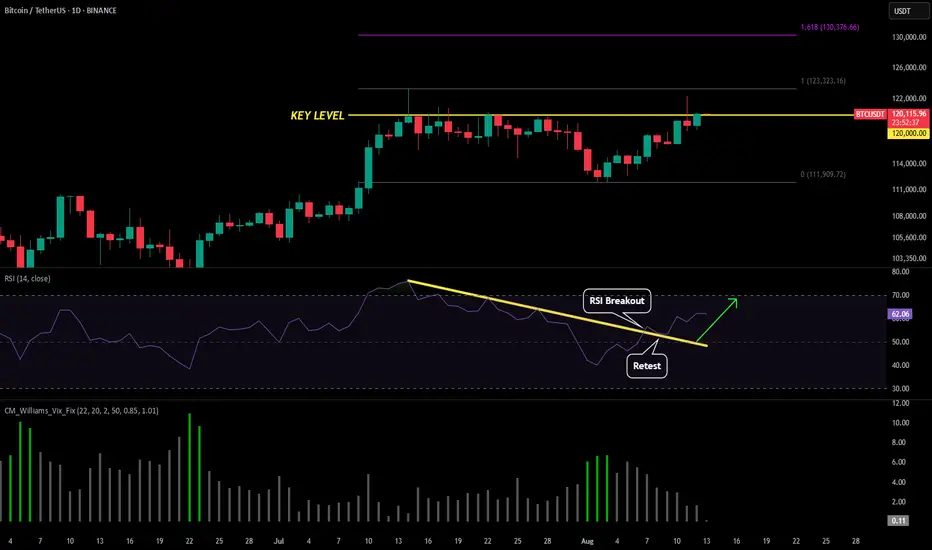
BTC - 1st Daily Above Key LevelFrom our past Bitcoin post we have been outline the importance of the $120k level (yellow key level).
This level has acted as resistance with no daily candles being above to close above it for the past couple weeks. However today we just closed the 1st daily candle above $120k!
This is a very good sign as it is our first of two confirmations we need to see another run at the ATH. We need a second daily candle above this key level (to confirm it as support) or better yet get a daily close above $120.4k (which is the 1.618 of our last swing).
If we see the confirmation tomorrow then our extension move from the current move would be right around $130k.
However if we fail this break and close back below tomorrow, then this would be a failed break and yet another rejection from $120k. This seems less likely but keep this in your playbook as a potential scenario.
Buy idea!Hello all. I think there is a trap right here. I am not a crypto trader but I think it is a good zone. be happy(wink)
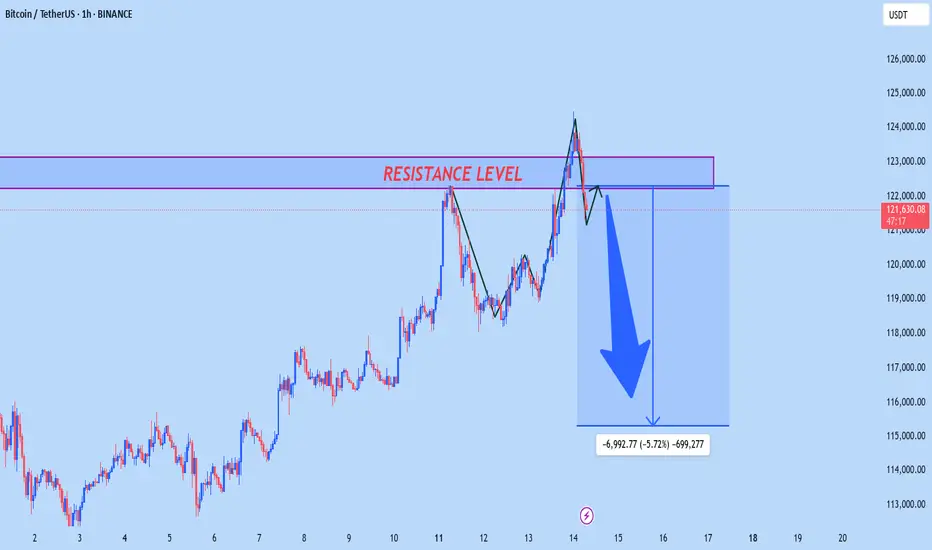
BTCIUSD OUTLOOK According to H1 anaysis btcusd market is in flying pressure now it will be touch the RESISTANCE LEVEL and it will be falling from there so if you are intersted the go short from resistance it is best for you
TRADE AT YOUR OWN RISK
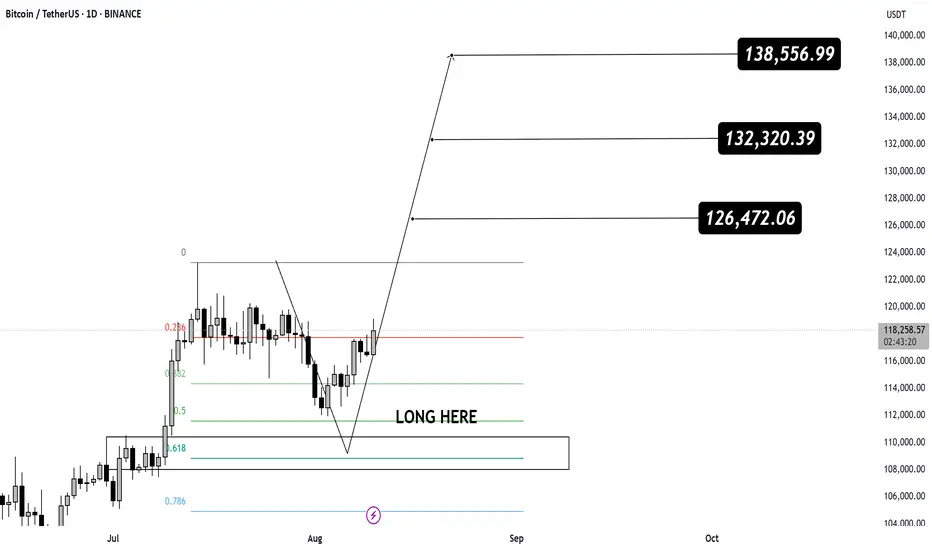
BTC 140K Loading…
We nailed the LONG entry right at the golden zone 🎯
Now CRYPTOCAP:BTC is breaking out with force – bulls fully in control 🐂🔥
📊 Targets in sight:
🎯 T1 – $126,472 ✅
🎯 T2 – $132,320
🎯 T3 – $138,556 (140K psychological level next 🏆)
Weekly + Daily both showing bullish continuation 📈
Every dip = opportunity until we tag that 140K zone 💪
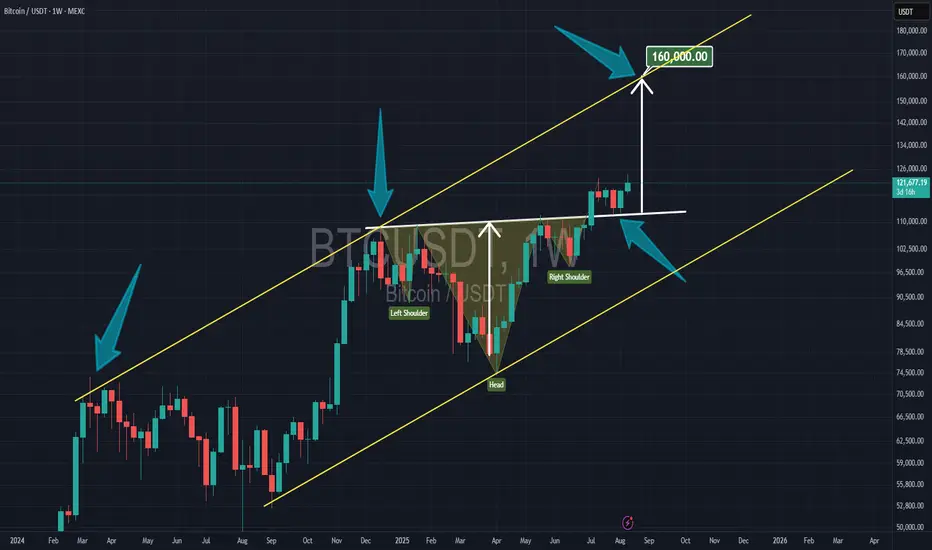
BITCOIN to 160kBitcoin appears to have an inverted Head & Shoulders pattern and has broken the neckline. It's now rising, targeting 160k, which aligns with the top of the rising channel.
Bitcoin Traps Bulls and Bears – Real Move Next?Bitcoin is trading in a descending channel on the 4H chart, with two recent fakeouts — one above resistance and one below support — trapping traders on both sides. After reclaiming support, BTC is pushing toward the upper boundary with rising volume, hinting at strong demand. A breakout above $119K could drive a rally toward $125K–$135K.
Cheers
Hexa
BINANCE:BTCUSDT BITSTAMP:BTCUSD
