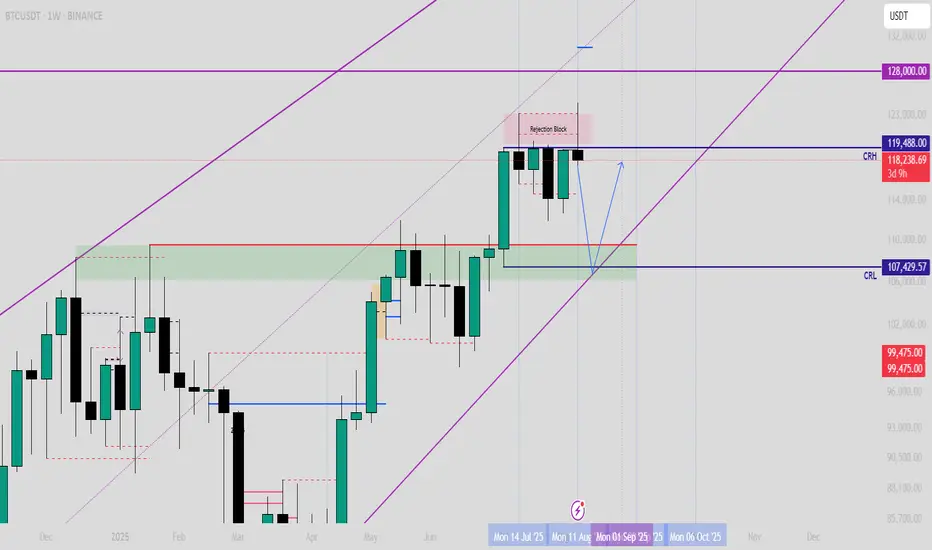
$BTC was rejected at $123,000, now where is the next level?!BTC got rejected at the rejection block. Based on Candle range theory, we will see 107500 as our weekly range low soon.
that will be a good support, but we need to monitor the situation closely. I don't expect breaking down that level in the first touch. just grabbing liquidity, but we will see how it will react.
USDTBTC trade ideas
Skeptic's Night Byte: How to Catch Altcoin MovesHey, welcome to the first episode of the Skeptic's Night Byte
In this quick lesson, we’ll dive into how to spot when liquidity moves from Bitcoin into altcoins .
Each video is about 60 seconds, giving you fast, no-fluff insights to help improve your trading game :)
If you find this useful, give it a boost and share it with your trading circle.
Let’s get started!

How to use Order Flow / Delta Volume Indicator for IntradayWhat you’re seeing
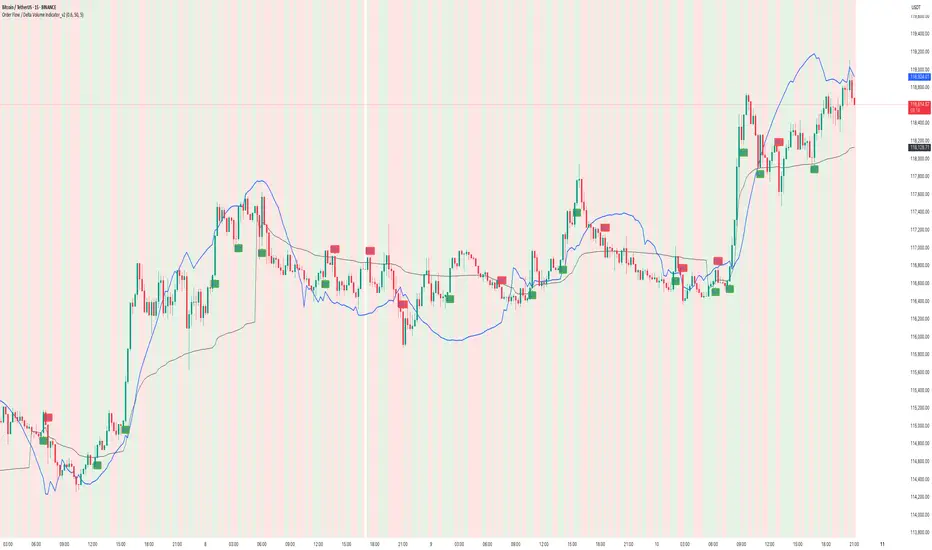
This idea visualizes an intraday session with my Order Flow / Delta Volume study applied. The chart overlays three things that matter for short-term context:
• Cumulative delta (blue line) : running sum of delta, rescaled so it’s easy to compare to price swings.
• VWAP (grey line) : session anchor for bias and mean-reversion context.
Signal logic (kept simple & rule-based)
A bar is considered imbalanced when one side’s volume dominates the bar’s total volume.
• Imbalance: upVol / totalVol > 0.60 → buy-side imbalance; downVol / totalVol > 0.60 → sell-side imbalance.
• Trend/strength filters (optional but enabled here):
• VWAP filter → longs only when price > VWAP; shorts only when price < VWAP.
• RSI(14) filter → longs only if RSI > 50; shorts only if RSI < 50.
• Noise throttle: minimum 5 bars between signals + price must exceed the prior close by ±ATR(14) to avoid tiny wiggles.
These rules try to capture moments when flow (delta) and context (VWAP/RSI) line up, while the ATR and cooldown help skip low-quality, back-to-back prints.
How to read the chart
• Rising blue cumulative-delta with price above VWAP → constructive backdrop for longs; fading/ranging delta warns to de-risk or wait.
• Green “ BUY ” labels plot when a buy-side imbalance clears the filters; red “ SELL ” labels mark sell-side imbalances with bearish context.
• Background tints briefly highlight where the raw imbalance occurred (light green/red), even when a trade filter blocks a signal.
Walk-through of the attached example
• Trend leg after a base: cumulative delta turns up first and price reclaims VWAP → several filtered BUY signals print into the push; ATR gate avoids chasing the very first small upticks.
• Mid-session chop: delta flips around the zero line and price hovers near VWAP → far fewer signals; most imbalances are filtered out by RSI/VWAP or fail the ATR move requirement.
• Late expansion: a swift VWAP reclaim with strong positive delta → clustered BUY signals that track the follow-through, while opposing sell imbalances near VWAP are rejected by filters.
Inputs used on this chart
• Imbalance threshold: 0.60
• VWAP filter: On
• RSI filter: On, threshold 50
• Cooldown: 5 bars
• ATR length: 14
Notes
• This is not a trade recommendation. Signals highlight where participation leans, not certainty of direction.
• Best paired with your execution plan (risk unit, stop location, partials near prior S/R or VWAP).
• In fast spikes, delta can be extreme—ATR and the cooldown help, but slippage and whipsaws are always possible.
• For instruments with very low volume or during illiquid hours, consider raising the imbalance threshold or disabling signals altogether.
Takeaway
Order-flow imbalance by itself fires often; layering VWAP, RSI, and an ATR-based movement check concentrates signals to moments when both flow and context align. The attached session shows that behavior clearly: fewer prints in chop, more conviction when cumulative delta trends and price holds its side of VWAP.
Educational post for discussion only. No financial advice.
Market Update for BitcoinBitcoin is moving according to the bullish (green) scenario, holding above the trendline. At the moment, there’s pressure from the resistance zone, but only 1.5% remains before setting a new ATH.
On the lower timeframe, we can see that high-leverage longs have already been flushed out, so the move may continue.
BTC - Short Trade / Crash Update and DetailsPer my previous post here are the details on my personal trade. Note this is NOT financial advice, and this is my own personal trading plan only. Please use your own judgement.
Entry - 116,300 to 116,600
Stop Loss - 121,800
Target 1 - 95,700
Target 2 - 61,500
Target 3 - 35,000
Target 4 - 8,000
Note that Bitcoin should move up from the 35,000 target to 88,000 making a corrective wave on HTF.
At this point I will post an update and advise my own strategy and if I long 35,000 to 88,000.
Happy trading

BTC 1H Analysis – Key Triggers Ahead | Day 11💀 Hey , how's it going ? Come over here — Satoshi got something for you !
⏰ We’re analyzing BTC on the 1-hour timeframe , we observe it approaching the 99 moving average .
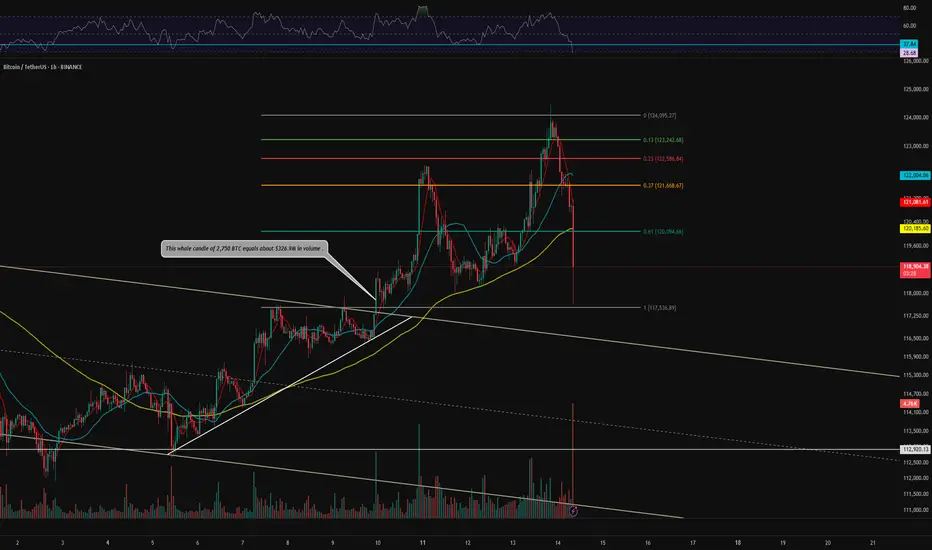
👀 Bitcoin moved upwards after breaking the $117,500 level, creating a new historical high at $124,474, then was rejected by sellers at this level and is now correcting this upward leg. Today is a news day, so keep an eye on the market.
🎮 A Fibonacci retracement has been drawn from the channel breakout to the new high, showing support at the 0.61 level, which coincides with our 99 moving average, making it a relatively good support zone. The key level for an upward movement is breaking 0.37, which would end our correction trend.
👑 We observe the moving averages where the 7-period moving average has crossed over the 25-period moving average from above, and the price is approaching the 99 moving average.
⚙️ The key RSI zone for us is at 37.84, which has shown an upward reversal, serving as our RSI support. Breaking this zone could lead to further oscillation towards 30. The next key zones are 50 and 70, where Bitcoin could move towards with increased volume and number of trades.
🕯 We see that Bitcoin has experienced increased volume at breakout zones, and there's a strong seller zone above this area where buy orders are triggered each time the price reaches this zone. Breaking this zone would require a significant volume increase from major buyers.
🔔 An alert zone for Bitcoin has been set at 0.37, where upon reaching this price, you can check market behavior for a long position and make the most logical trading decision.
📊 We observe Tether's dominance, which has moved upward after breaking the 4.10 resistance level. The next resistance for Tether's dominance is the 4.20 zone. If this level is broken, Bitcoin could undergo a deeper correction. 💸 Conversely, if it breaks below the 4% level, it could move toward forming a new high.
🖥 Summary : Today is a news day, and Bitcoin could experience unusual fluctuations. Make sure to manage your capital and risk properly. Also, remember that the news released can have several scenarios: initial impact, secondary impact, long-term effects, ... .
❤️ Disclaimer : This analysis is purely based on my personal opinion and I only trade if the stated triggers are activated .
BTC 1H Analysis – Key Triggers Ahead | Day 10💀 Hey , how's it going ? Come over here — Satoshi got something for you !
⏰ We’re analyzing BTC on the 1-hour timeframe .
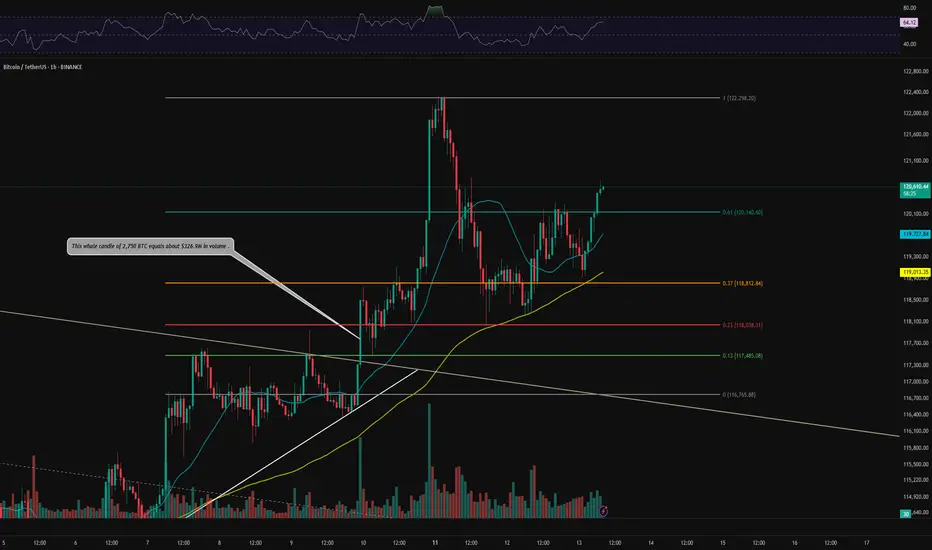
👀 After completing its correction, BTC broke the 120,140 zone and consolidated above it, now heading toward higher resistance levels. Increasing buy volume and support from moving averages are observed .
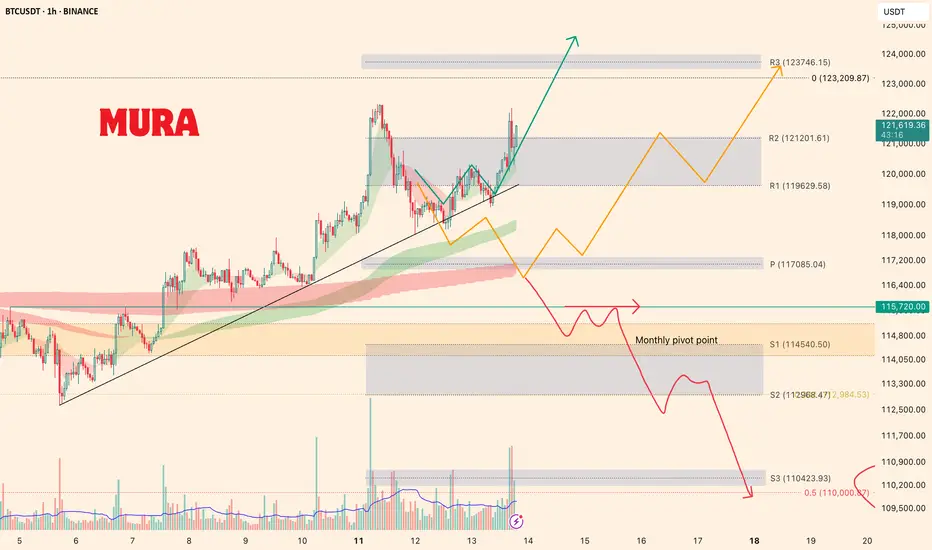
🎮 Fib drawn from the bearish channel breakout to the 122,300 ticker seller zone. The last resistance for ending the correction and forming a new bullish structure was the 0.61 Fib level, which was broken and consolidated above. The next resistance (potential new ATH) is at the 0 Fib level .
⚙️ BTC is approaching the overbought zone on RSI , which could facilitate a stronger push toward resistance and a potential breakout .
👑 Moving Averages:
MAs (medium and low wave cycles) are strongly bullish , showing high momentum .
🕯 Volume & Market Session :
Rising buy volume is noted . We're approaching the New York session, which may bring increased buying pressure. Stay at your system during this session to monitor the chart .
🔔 Set an alert at 122,300 to observe price behavior. This zone offers low-risk trading opportunities , and price action here can guide trade decisions .
🖥 Summary : BTC has broken the key Fibonacci zone, signaling the end of its correction. Taking a long position now may be challenging , but price action at 122,300 can provide a good trading opportunity .
📊 On the 1H timeframe for USDT.D , USDT.D broke the 4.10 zone and is moving downward. The next support is at 3.92 .
❤️ Disclaimer : This analysis is purely based on my personal opinion and I only trade if the stated triggers are activated .
BTC 1H Analysis – Key Triggers Ahead | Day 12💀 Hey , how's it going ? Come over here — Satoshi got something for you !
BINANCE:BTCUSDT
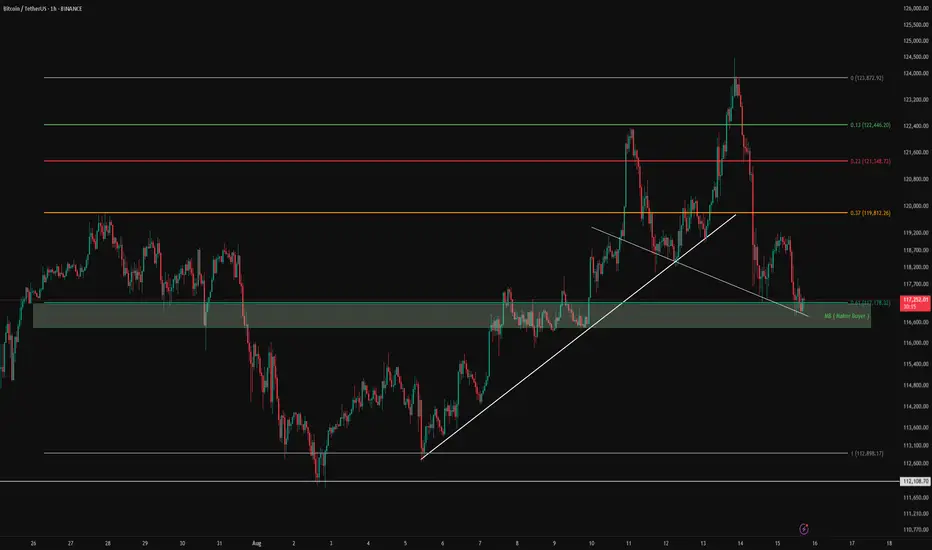
⌛ On the 1-hour Bitcoin timeframe, we can see that the trend has shifted from bullish to a deep correction. The reason for this move was the release of higher-than-expected Producer Price Inflation, influenced in part by Trump’s tariff policies. As a result, the likelihood of an interest rate ( CPI) cut has decreased — which is not particularly favorable news for the market.
👀 After forming a new all-time high, Bitcoin faced heavy selling pressure and a sharp rejection, pushing it towards support levels. The current key support for Bitcoin is at $117,200, which could attract market makers (buyer entries). The next support is likely around $115,000.
🎮 Fibonacci levels have been drawn from a higher low to Bitcoin’s all-time high. The most important levels are $117,200 and $119,800. A breakout above or below these levels could provide potential long or short trading opportunities.
⚙️ On the RSI, the key resistance zone is at 35.88. Historically, each time the RSI has reached this level, Bitcoin has reacted strongly. A rejection here could lead to a deeper correction, while a breakout above it could trigger upward momentum.
🕯 Both trading volume and the number of transactions are increasing, but selling pressure is leaving increasingly “red” candles. This rise in volume could be a useful signal for planning entries.
🔔 There’s no specific alarm zone today since Bitcoin is in a phase of uncertainty, and the exact reason for the market’s drop has not yet been fully absorbed.
CRYPTOCAP:USDT.D 📈USDT.D has broken a strong resistance level and is now moving toward its next resistance .
🖥 Summary: Trump’s tariffs have fueled higher producer inflation, reducing the chances of a rate cut. Bitcoin’s critical support is at $117,200; if this breaks, the price could move towards lower levels.
❤️ Disclaimer : This analysis is purely based on my personal opinion and I only trade if the stated triggers are activated .
BTC - 1H Elliott Wave Analysis - 15.08.25Greetings! We hit 100 Followers, welcome to all the new joiners :) Happy to have you here with us, thank you! ^-^
Today, we want to discuss two cases. :)
Case 1:
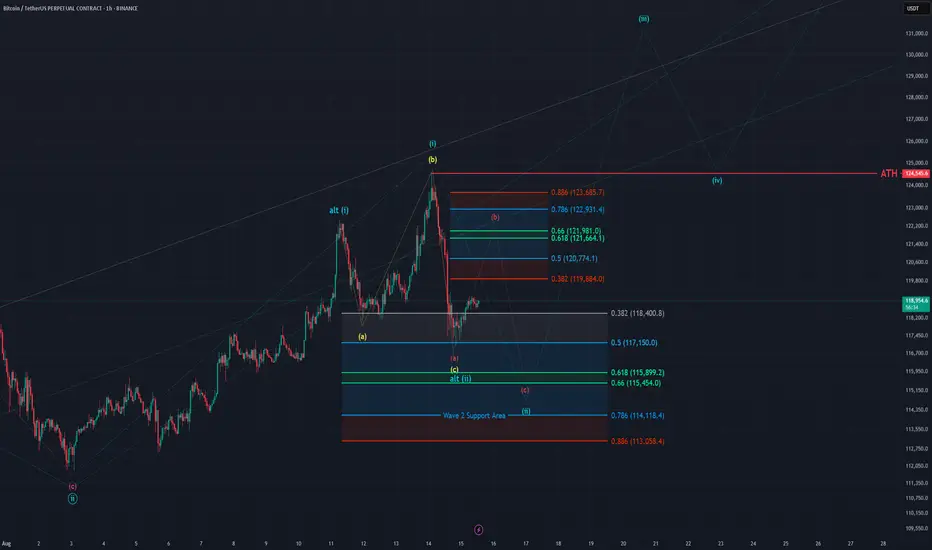
The recent high which formed a new ATH was the Wave 1 of our move up and now we are looking for the Wave 2 pullback in the red ABC of which we finished the A and are working on the B. The resistance area for B is between the 0.382 FIB at 119884 USD and the 0.886 FIB at 123685 USD. The Wave 2 support area is between the 0.382 FIB at 118400 USD and the 0.786 FIB at 114118 USD.
Case 2:
The Wave 1 topped on the 11th of August and we were looking for the Wave 2 pullback in the yellow ABC. The recent move up which created a new ATH was an overshooting B Wave and the move down afterwards the C Wave. In this case we want to see a 5 wave move up followed by a corrective pullback soon.
We think Case 1 is more likely to play out.
The Invalidation for both bullish counts is breaking below the low at 111850 USD.
Thanks for reading.
NO FINANCIAL ADVICE.
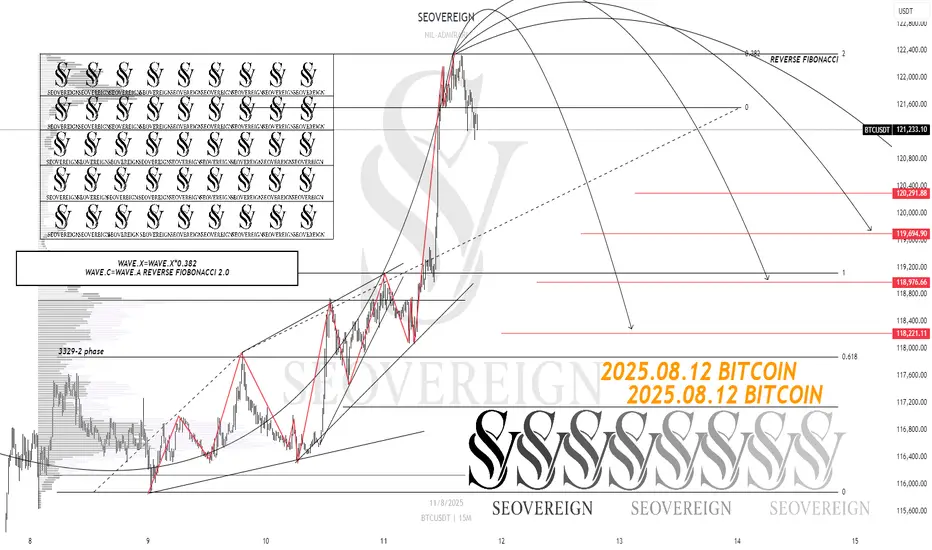
[SeoVereign] BITCOIN BEARISH Outlook – August 12, 2025Today, I will introduce my short position outlook for Bitcoin on August 12.
There are two grounds for this idea.
First, an arbitrary wave X forms a 0.382 length ratio with another arbitrary wave.
In general, the 5th wave often has a length ratio of 0.382 compared to the 1st wave.
In this case as well, it can be counted in the same way.
Second, as a result of applying the Fibonacci in reverse to the wave that appears to be in a diagonal form,
the point where the ratio of 2 is formed almost exactly matched the recent high of around 112,360.
I often use this kind of “reverse Fibonacci.”
Normally, Fibonacci is drawn with the past point as the first point and the future point as the second point,
but I do the opposite — setting the future point as the first point and the past point as the second point.
In this case, ratios such as 1.618 / 2 / 2.24 / 2.618 / 3 / 3.618 are often used.
It is especially effective for measuring ratios between wave pairs that skip one wave,
such as between wave A and wave C, or between wave 3 and wave 1.
thank you.
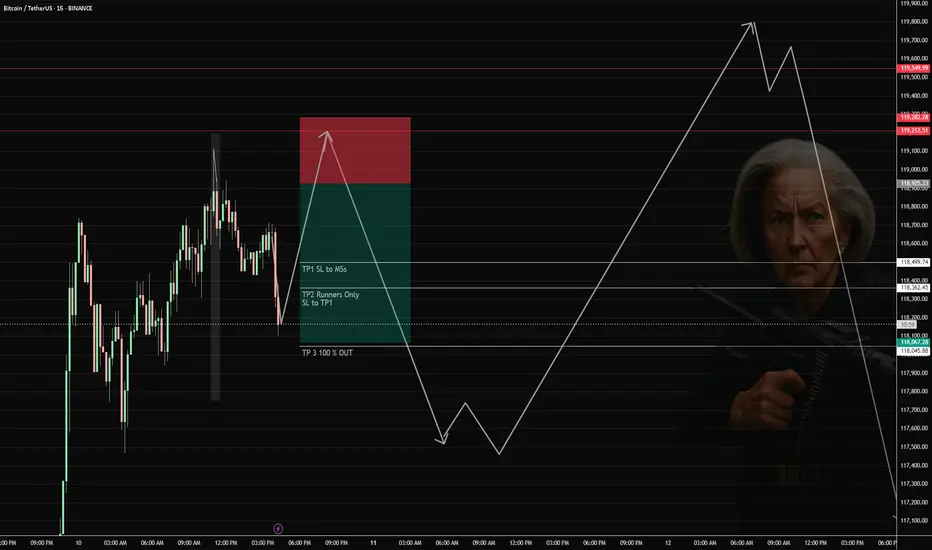
08/10-10/12/25 BTC SHORT Right now will retrace however, it wont' present us with large enough move to profit from. but will soon sweep the highs listed below.
Preferred: Short BTC in $118,950–$119,200 zone after rejection.
Trigger: Wick into zone + aggressive sell reaction (fast candle back under $118,900).
Stop-loss: Above $119,300.
TPs:
TP1: $118,500
TP2: $118,300
TP3: $118,050
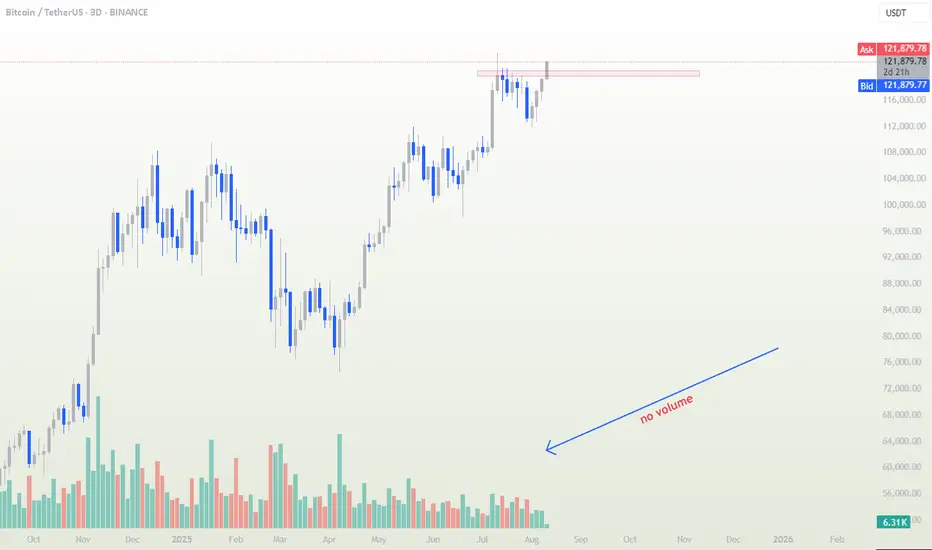
BTC Breakout Without Volume⚠️ Watch Out – Breakout Without Volume
Price is testing the resistance zone again, but look closely at the volume bars — there’s no real participation behind this move. Without strong buying volume, it’s unlikely the market can sustain a bullish breakout.
Low-volume breakouts often result in false moves or quick pullbacks as there’s no fuel to keep driving price higher. I’ll be watching closely for confirmation before committing to any long positions.
📌 Quick Technical Note:
In breakouts, volume is the fuel that powers price movement. A breakout backed by strong volume shows that many market participants agree with the move, adding conviction and sustainability. When volume is low, it suggests limited interest — meaning fewer buyers to keep the price climbing, increasing the probability of a reversal or retest.
What do you think — is this breakout already losing steam, or do you see hidden strength here?
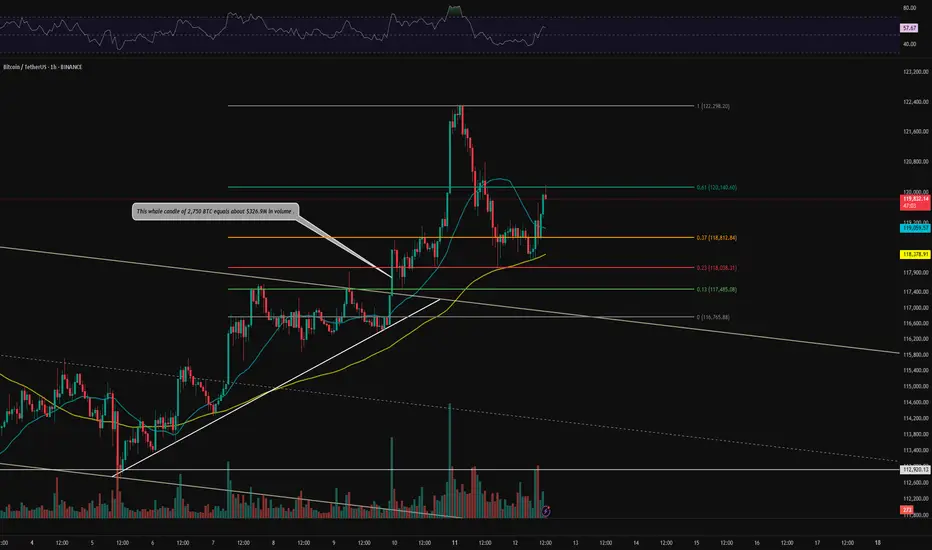
BTC 1H Analysis – Key Triggers Ahead | Day 9💀 Hey , how's it going ? Come over here — Satoshi got something for you !
⏰ We’re analyzing BTC on the 1-hour timeframe after today’s CPI release .
👀 Following the CPI news, Bitcoin broke through key areas — including the descending channel and the $117,000 resistance — and moved higher. It then faced rejection from the previous high, pulling back to around $118,000, which aligns with a multi-timeframe 4H SMA25 bounce. After that, it broke the $119,000 level and is now heading toward its key resistance at $120,000.
🎮 Fibonacci drawn from the current high to the price jump zone shows our current key level at 0.61, which is a relatively strong resistance. Breaking above this Fibonacci level could send BTC toward its current high and potentially lead to a new ATH.
⚙️ On the RSI oscillator, the key level is 70. Entering the overbought zone could push BTC toward its current high.
👑 The 99 MA is forming a strong base below the 0.37 level, while the 25 MA is working to break resistance and push price upward. On the 4H multi-timeframe view, the 0.23 area acts as a rebound zone after touching the 25 MA.
🕯 Volume and trade count are increasing, with solid consolidation above zones where whales have been buying and accumulating. Following today’s CPI results, fresh capital has flowed into risk assets like Bitcoin. This could be highly attractive for other coins, especially BTC pairs that are bullish in these conditions.
🔔 You can set an alert at the $120,000 area to watch price action when it reaches this level. If it matches your setup confirmations, you can open a position. Personally, I have a profitable long position on Ethereum, which is considered a BTC pair.
📊 On the 1H timeframe for USDT.D, we can see that after reacting to 4.20%, it faced a drop, and with a break below 4.10%, BTC could set a new high.
🖥 Summary: Bitcoin is moving toward its $120,000 resistance, where we could consider opening positions. The most important factor will be holding and confirming above this level.
❤️ Disclaimer : This analysis is purely based on my personal opinion and I only trade if the stated triggers are activated .
Weekly trading plan for BitcoinBINANCE:BTCUSDT has shown strong growth since last week; the main task now is to print a new ATH. The price will likely test the 126K–130K zone we marked a couple of weeks ago, with a final monthly target at 132K .
We’re seeing some pressure and a pullback, but as long as the trendline holds, there’s a real chance to see a new ATH today/tomorrow . If the trendline breaks, I’ll look for a reversal from the moving averages or after a test of the weekly pivot.
If 115K breaks, I’ll expect further downside toward 110K .
More details are in the idea video.

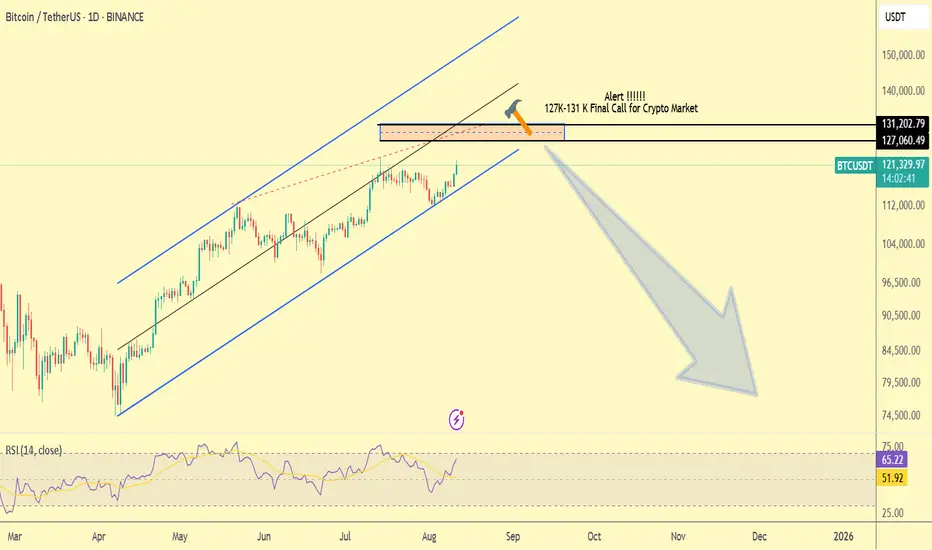
BTC-CRYPTO Market - Heavy Drop !!! coming Soon !!! Dear Traders,
I believe the Bitcoin market is nearing the end of its bullish cycle, and the 127K to 131 K range will be its last bullish move. The market will then enter a deep correction and experience a significant drop.
If you are a holder, be cautious. The market could experience a sudden heavy drop from the mentioned levels.
If you found this post helpful, I would appreciate it if you share your thoughts. Support me with a like and comment.
Regards,
Alireza!
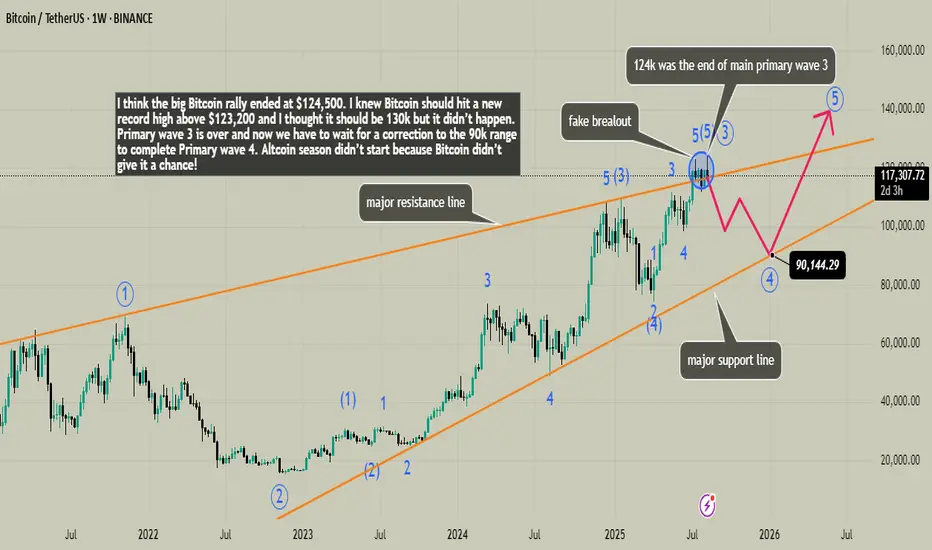
BTC will dump to 90k (MAJOR CRACH)I think the big Bitcoin rally ended at $124,500. I knew Bitcoin should hit a new record high above $123,200 and I thought it should be 130k but it didn’t happen. Primary wave 3 is over and now we have to wait for a correction to the 90k range to complete Primary wave 4. Altcoin season didn’t start because Bitcoin didn’t give it a chance! . This is my analysis on the weekly time frame. I have been long since the 80k range and if you look at my ideas they are mostly long but in my opinion Bitcoin has completed its main wave 3 and I am entering a short position.
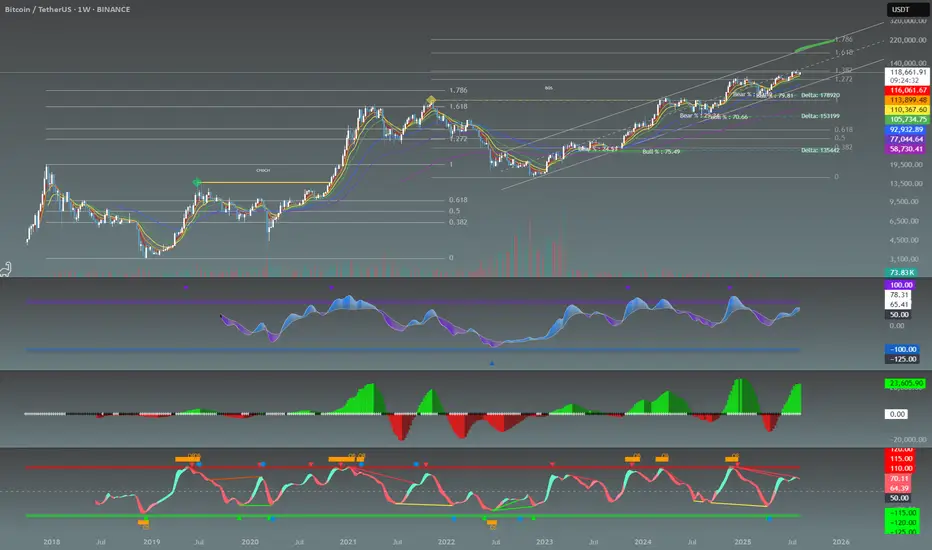
BTC: The Cycle isn't over! 175k-224k is the mark!!Taking our previous cycle fib levels, we can see we are having a similar stall at the 1.382 fib, before explosively making it's move to the extended 1.618 range and then some. With that said, we can safely attest to BTC reaching 175k to 224k. Nonetheless, once the upper trendline is reached, this should be the topping of this cycle. Thank you for taking your time to read this and I hope you have a wonderful day
BTCUSDT Bullish Rebound Setup From Support RetestTrade Setup Analysis
Pair: BTCUSDT
Timeframe: 1D (Daily)
Position Type: Long (Buy)
Entry Point: 115,554.94
Positioned exactly between the stop loss and take profit zones, providing an optimal entry after a pullback to support.
Stop Loss (SL): 112,693.78
Placed below the key support zone to limit downside risk. Risk is approximately -2.48% from entry.
Take Profit (TP): 124,843.07
Target set at a recent swing high, offering a potential upside of around +8.04% from entry.
Risk/Reward Ratio: 3.25
A favorable setup offering more than triple the potential reward compared to the risk.
Technical Outlook:
BTCUSDT experienced a sharp pullback after testing highs, now retesting a support level that aligns with previous consolidation. This could present a buying opportunity if bullish momentum resumes.
Bullish Scenario: Holding above 115,554.94 and forming higher lows could trigger a rally toward 124,843.07.
Bearish Invalidation: A break below 112,693.78 would invalidate the setup and may open the door to further downside.
Summary:
This setup targets a rebound from support with a clearly defined stop loss and a strong reward potential, making it suitable for swing traders seeking favorable R/R conditions.
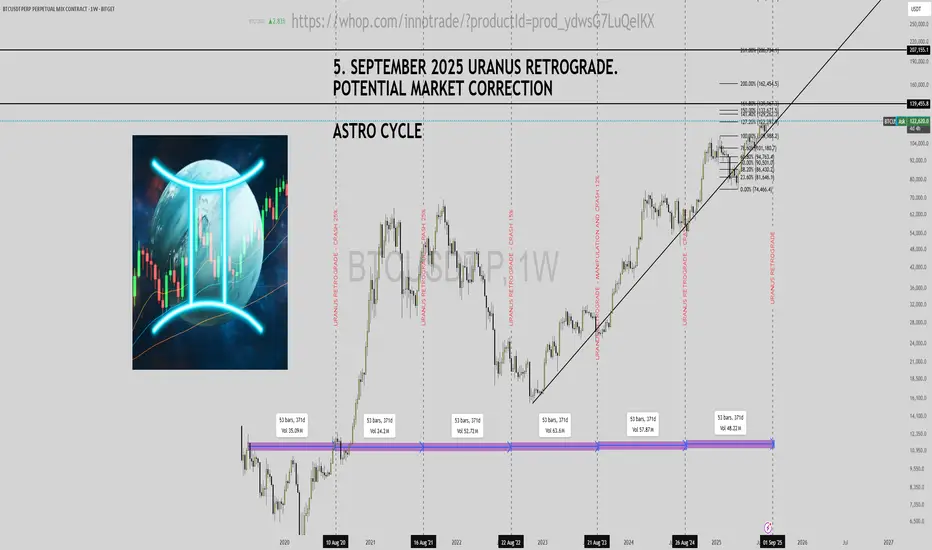
Uranus Retrograde and BTC Analysis - September 5th, 2025The Uranus retrograde, starting September 5, 2025, at 1°25′ Gemini and ending February 4, 2026, at 27°22′ Taurus, may signal a potential market correction. Historical data from 2020-2024 shows correlations between retrograde phases and price volatility.
Key Dates and Observations
2020: Aug 15 - Jan 14, 2021 (10°41′ to 6°43′ Taurus)
2021: Aug 19 - Jan 18, 2022 (14°47′ to 10°49′ Taurus)
2022: Aug 24 - Jan 22, 2023 (18°55′ to 14°56′ Taurus)
2023: Aug 28 - Jan 27, 2024 (23°04′ to 19°05′ Taurus)
2024: Sep 1 - Jan 30, 2025 (27°15′ to 23°15′ Taurus)
2025: Sep 5 - Feb 4, 2026 (1°25′ Gemini to 27°22′ Taurus)
Past retrogrades have coincided with notable price dips and recoveries, suggesting a similar trend in 2025.
Technical Levels
Astro-Technical Insight
Uranus in Gemini may bring unexpected shifts. Combine this with moving averages and volume analysis for a holistic view. The chart indicates a potential pullback post-September 5—keep an eye on volume spikes.
Community Input
What are your predictions? Does astrology influence your trading? Drop your ideas below!
BTC accumulation, cash flow through altcoin💎 MIDWEEK BTC PLAN UPDATE (August 13, 2025 )
1. Market Structure & Wave Pattern
The chart is applying the Elliott Wave theory with a completed 5-wave upward structure (1 → 5) and is currently correcting in an ABC pattern.
The current zone is in corrective wave C, with a likely retest of a key support area before bouncing back upward.
2. Key Price Levels
• Short-term resistance: 120,500 – 120,700 (previous breakout zone).
• Nearest support: 118,800 – 119,000 (EMA34 zone + retest of the broken downtrend line).
• Stronger support: 117,500 – 117,800 (EMA200 zone + long-term trendline).
• Major resistance above:
• 122,770 (Fib 2.618, short-term take-profit zone).
• 127,260 – 127,480 (Fib 3.618, strong resistance zone).
3. EMA & Trend
• EMA34 (gold) is above EMA89 and EMA200 → medium-term trend remains bullish.
• EMA200 (red) acts as dynamic support during the correction.
4. Trend Outlook
• Main scenario: Price may continue corrective wave C toward 118,800 – 119,000, possibly testing deeper at 117,500 – 117,800, then sharply rebound in line with the main trend toward targets at 122,770 and 127,260+.
• Alternative scenario: If the 117,500 support breaks, the short-term bullish structure will be invalidated, and BTC could retreat to 115,800 – 116,000 before recovery signals appear.

TradeCityPro | Bitcoin Daily Analysis #146👋 Welcome to TradeCity Pro!
Let’s dive into Bitcoin analysis. In this analysis, I want to take a look at the higher timeframes since conditions in the lower timeframes haven't changed much compared to yesterday, and it’s a good idea to review the broader picture.
📅 Daily Timeframe
In this timeframe, after the completion of the previous corrective leg that extended to the 78,000 zone, Bitcoin started a new uptrend and has managed to climb up to the 122,000 area.
💥 The most important resistance during this move was 110,183, which, as you can see, has been broken, and Bitcoin is still holding above this level.
✔️ The curved trendline we've drawn in the higher timeframes has been broken in this timeframe, but in my view, confirmation of this trendline break comes only after the 110,183 level is broken again to the downside.
⚡️ Currently, the RSI oscillator is sitting on a support level around 38.21. This area is a very important momentum zone for Bitcoin, and if it breaks, the likelihood of downward momentum entering the market increases.
🧩 However, we still need more confirmations for a bearish scenario, and breaking this level on the RSI alone does not confirm a trend reversal.
🔽 If the correction continues, the main support we currently have is at 110,183. The SMA99 also acts as a dynamic support and, if it overlaps with 110,183, will form a very strong PRZ (Potential Reversal Zone).
📈 If the uptrend wants to resume from here, the first trigger confirming trend continuation is the 120,000 high — and breaking the range between 120,000 and 122,000 will start the next bullish leg.
❌ Disclaimer ❌
Trading futures is highly risky and dangerous. If you're not an expert, these triggers may not be suitable for you. You should first learn risk and capital management. You can also use the educational content from this channel.
Finally, these triggers reflect my personal opinions on price action, and the market may move completely against this analysis. So, do your own research before opening any position.

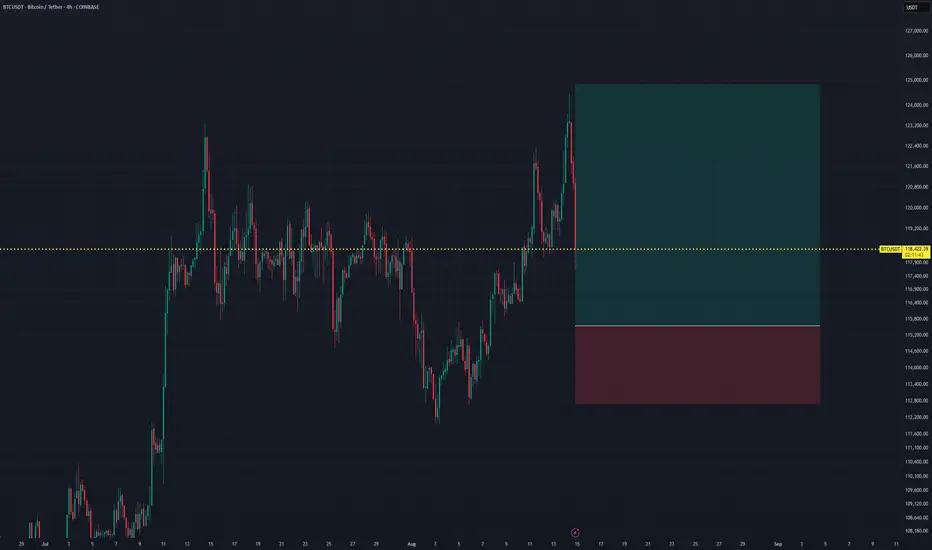
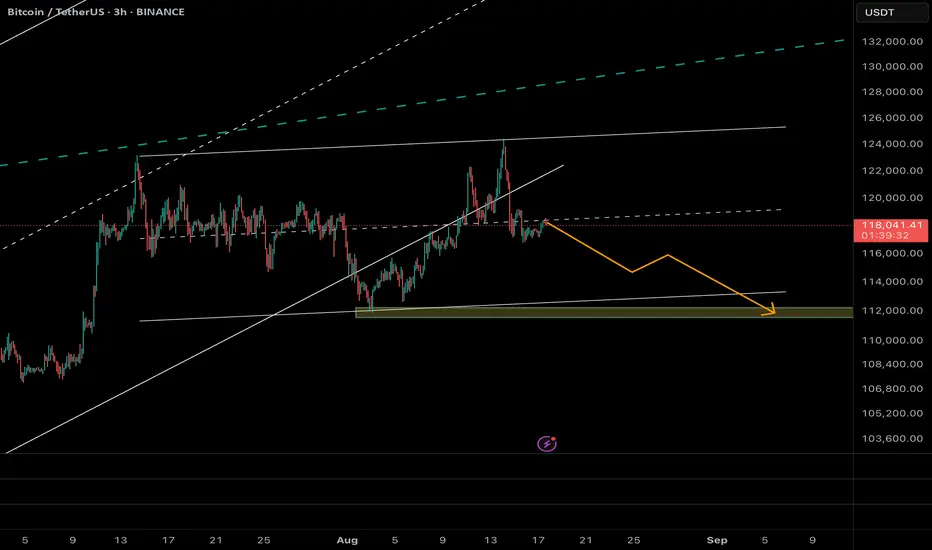
Bitcoin (BTC/USDT) – Potential Pullback Toward 112k Support
On the 3H chart, Bitcoin is showing signs of weakness after failing to hold above the mid-channel resistance. Price action is rolling over, with a clear break of the short-term trendline and rejection at ~118.5k.
🔹 The structure suggests BTC is forming a corrective leg, with the next major liquidity pool resting near 112,000 – 111,500 (highlighted green zone). This level also aligns with:
• Prior demand block & consolidation base
• Lower boundary of the short-term channel
• Key Fibonacci retracement cluster
If buyers fail to defend this zone, we could see acceleration toward the deeper supports around 109k.
📊 Scenario Path (Orange Projection):
• Short-term consolidation under 118k
• Breakdown continuation toward 114.5k (intermediate support)
• Final sweep into 112k liquidity zone before any strong rebound attempt
⚠️ Risk factors:
• A reclaim of 121.5k invalidates the bearish scenario and opens the door to retesting 125k.
• Watch funding rates & BTC.D — a sudden risk-off move in alts could accelerate the drop.
🎯 Trading Outlook (Not Financial Advice):
• Short bias while below 118.5k–121.5k
• Main target: 112k
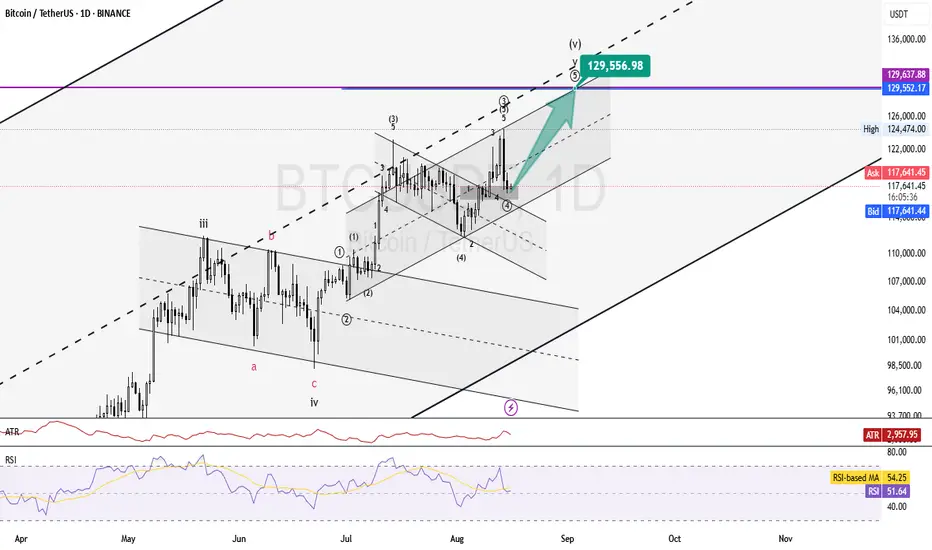
• Tight stops required due to volatility
BTCUSDT:Elliot Waves Analysis DailyHello friends, after the Bitcoin price rose to 124,000 and fell to 117,000 as the fourth wave, matching the 38.2% Fibonacci retracement level and pulling back to the broken area, I expect growth to 129,500 to 130,000.