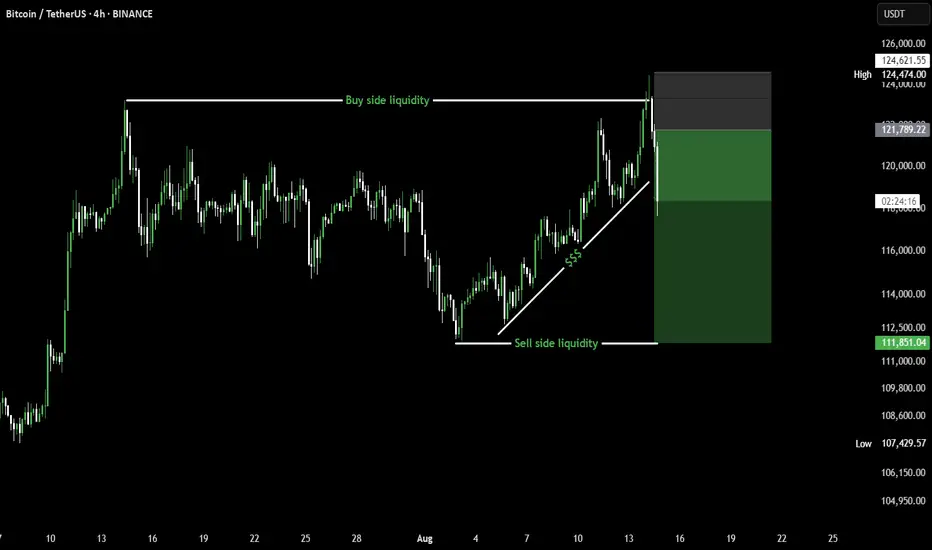
BTCUSDT Price swept buy-side liquidity, tapped into a key resistance, and formed an engulfing reversal candle.
Entry was taken on the FVG retest, aligning with the break of the ascending trendline.
Target set towards sell-side liquidity for a clean risk-to-reward setup.
USDTBTC trade ideas
BTCUSDT-D Go 130_140 The daily candle is completely fake and the move towards the channel ceiling continues, don't be fooled, avoid selling trades.
Bitcoin Go 130k
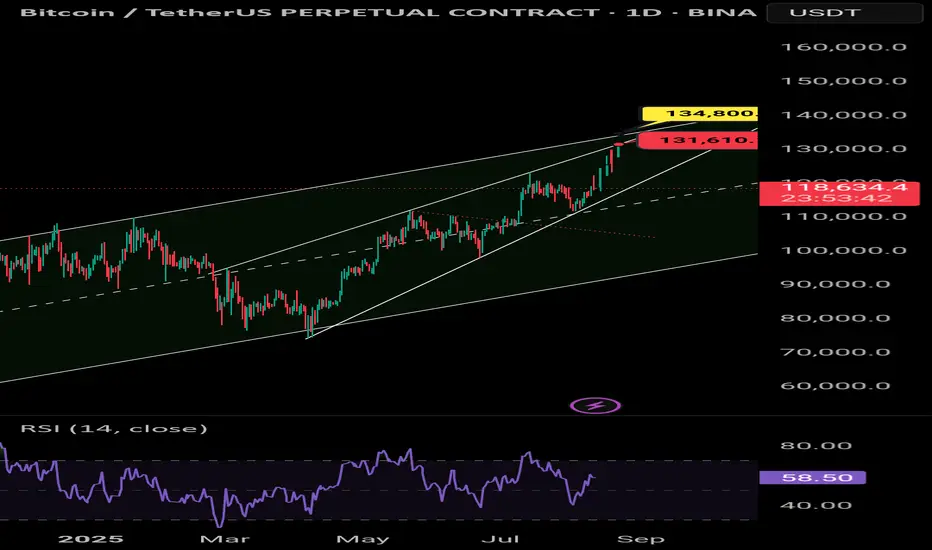
Finale is done.So many bearish patterns are there.
Before I said, finale always leads to alt bull-run. But, it is almost ended too.
However, it doesn’t mean cycle is end.
I just think CRYPTOCAP:BTC will be in big box-range. This range is too wide to say that it is just the Healthy Pullback. That’s the reason why I said “finale is end. bearish.”.
Alt finale is also end but I still think alt is better than btc at current markets because btc will be at the big range box price. I prefer low fdv or nice float of cmc/fdv alts from now. Heavy, especailly CRYPTOCAP:ETH needs time to relay the bull run .
Summary
>>Finale is ended. DCA time for $BTC. Trading time for low cap ALTs. No long-term view now.
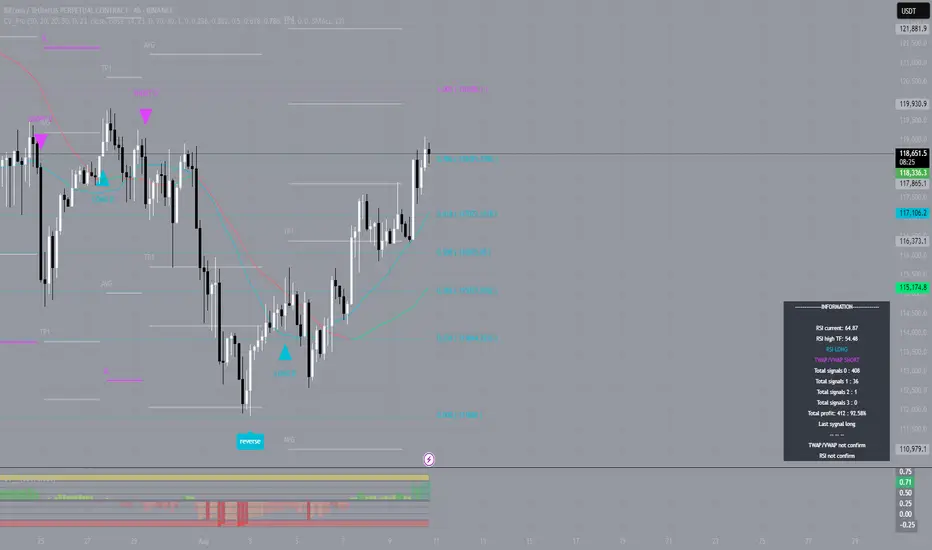
#BTC — TP2 Closed by Indicator SignalAs anticipated, Bitcoin continued its upward movement, and our indicator precisely identified the optimal entry point for a long position. The signal was triggered around the $114,000 level, allowing for a timely entry and guided trade management toward the target levels.
The first target was reached within three days, and yesterday the second Take Profit (TP2) level was successfully closed. Throughout the entire trade, the indicator consistently outlined holding zones and partial profit-taking points, ensuring a systematic approach free from emotional decision-making.
The current price is approaching the TP3 area; however, divergence and convergence analysis indicate an increased likelihood of a correction. Despite the absence of a clear reversal impulse, the risk-to-reward ratio has already reached an optimal level, making profit-taking at the current range a justified decision.
The long position opened on the indicator’s signal delivered strong results once again, confirming that precise entries and algorithm-based trade management enable traders to fully capitalize on market movements.
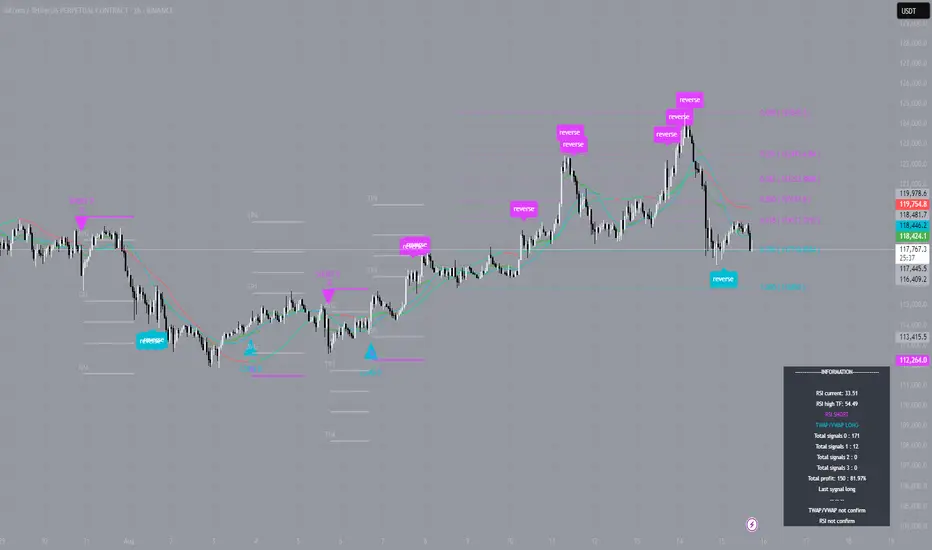
#BTC — The Long That’s Been Alive for Over a WeekOn August 6, our indicator on the 1-hour timeframe generated a long signal around the $114,000 zone for Bitcoin. At that moment, the move was just beginning to build momentum, and for many, the market looked uncertain. However, the algorithm precisely identified the entry point and has kept the trade open ever since.
Today, more than a week later, the signal remains active. The price has traveled a significant distance, while the indicator has been guiding the position all along — adjusting support levels and areas for partial profit-taking.
Is this pure coincidence, or does the machine truly see what is not always obvious to traders? The answer lies in mathematics: the algorithm analyzes not only price, but also market structure, trend strength, and hidden impulses. This allows it to stay in a position for so long, extracting the maximum from a move while avoiding false reversals.
The question remains for each to decide — mystery or cold calculation? One thing is certain: the long opened on August 6 is still very much in play.
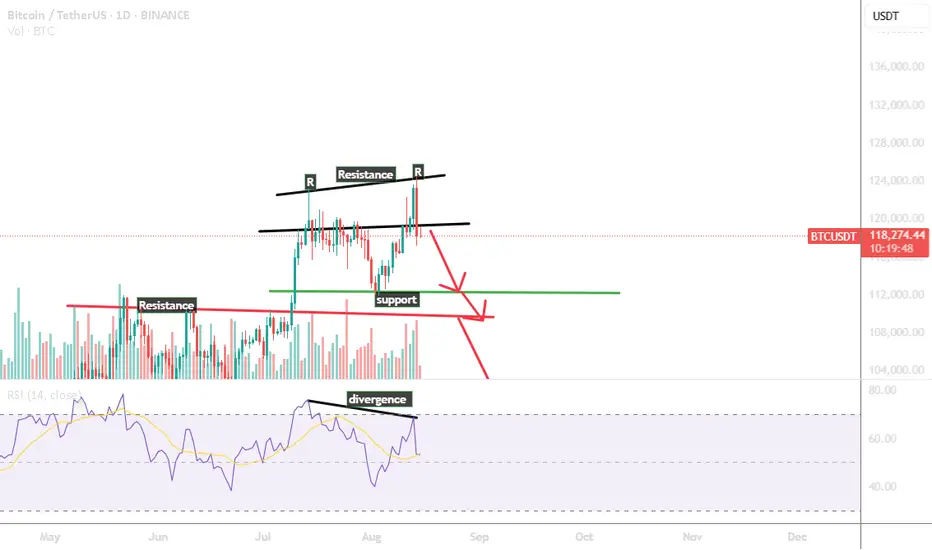
BTC Rejection can touch 100K.......The chart is showing what looks like a double top pattern at the recent highs (~118k–120k USDT), marked by two "R" resistance points.
The neckline is roughly around the 112k zone (green support line).
A confirmed breakdown below this neckline could activate the double top target, pushing price lower.
2. RSI Divergence
There’s a bearish divergence — price made a higher high, but RSI made a lower high.
This signals weakening bullish momentum and increases the probability of a pullback.
3. Support & Resistance Zones
Immediate resistance: 118k–120k
Immediate support: 112k (neckline)
Next major support: ~104k (previous range support), and then ~96k if selling intensifies.
4 Possible Scenarios
Bearish: If BTC closes below 112k with volume, it may head toward 104k, possibly even 96k.
Bullish invalidation: A strong daily close above 120k with increasing volume could negate the bearish setup and lead to new highs.
The second push to resistance faced a strong rejection, completing a double top pattern.
This rejection, combined with high bearish volume, strongly signals downside momentum.
The setup confirms a likely move to lower price levels in the near term.
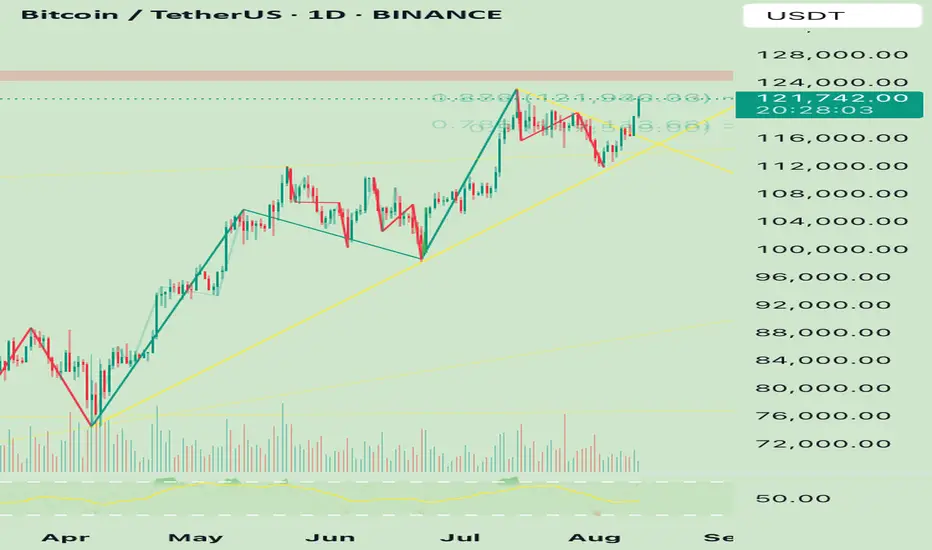
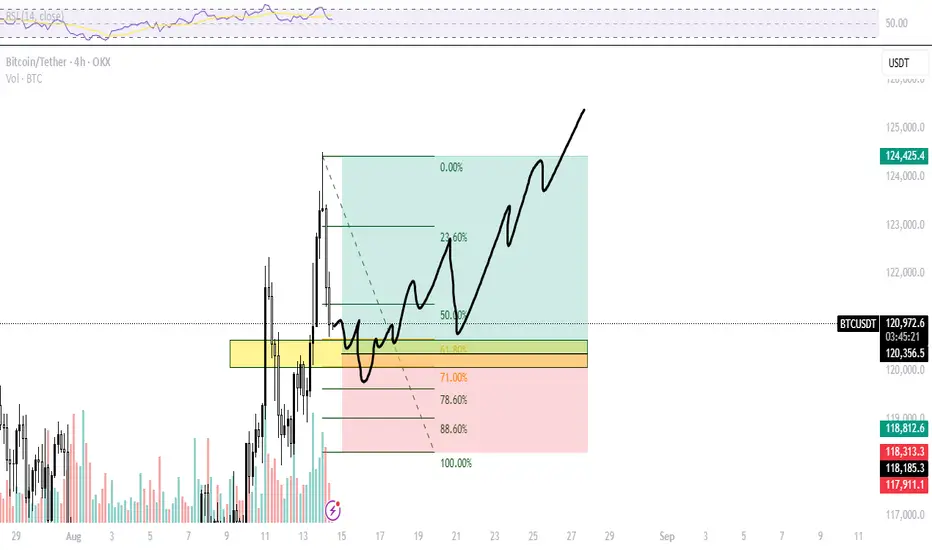
BTC long - Tap into demand zone in golden pocket and flydemand zone tapping and then reverserino.
Fib retracement tools are good when you combine them with fvgs
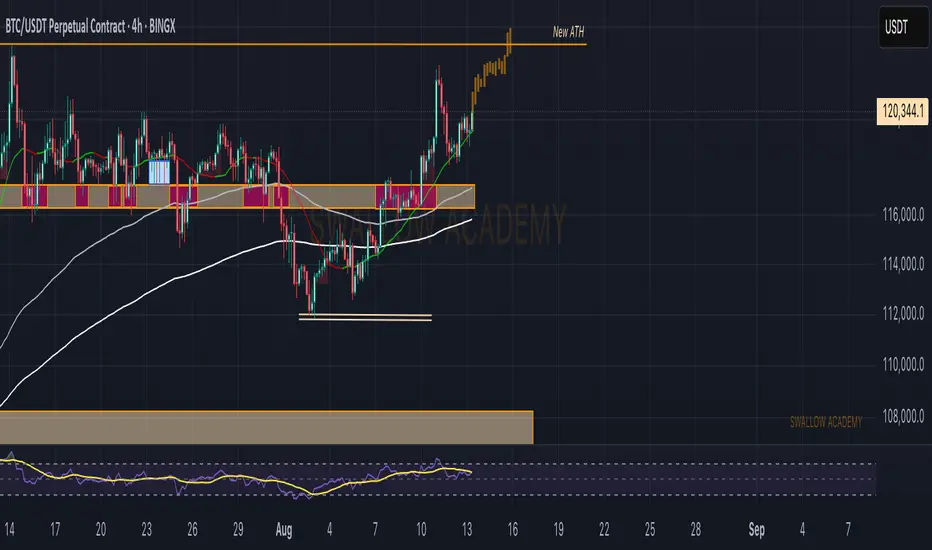
Bitcoin (BTC): We Are Back | Bullish Until ATH BTC is back, showing us bullish signs that could and should lead us back to the all-time-high zone.
What we expect here is the break of that ATH zone so for now we aim to reach that upper zone and once we are there and see signs of a breakout, we are going to aim for the $140K area.
Swallow Academy
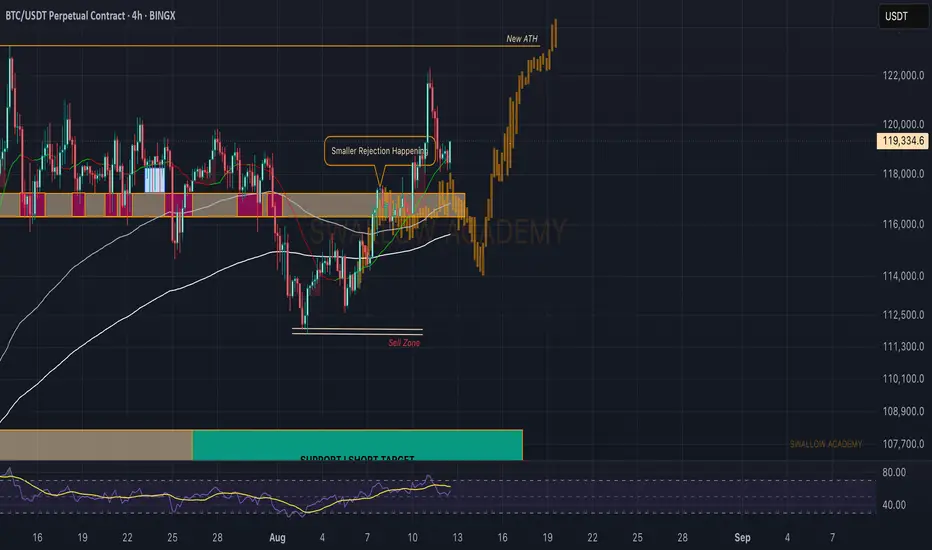
Bitcoin (BTC): Looking Back At Last Analysis | Buyers DominateSince last time we looked at the 4-hour timeframe, we have had a good 7% upside movement, where price is now back in our sideways channel, giving us another opportunity for a potential breakout to happen and proper buyside movement to start!
So we wait out today, and if buyers maintain current zones, we are going to look from a different angle!
Swallow Academy
BTC Analysis – The Most Likely Scenario
BTC Analysis – The Most Likely Scenario 🔥🚀
♦️ BTC ♦️
If today’s daily candle closes bullish and tomorrow we see a red engulfing candle ➡️ time to close positions.
But if we only see a rejection from the 120,000.00 level today ➡️ tomorrow the probability of breaking this zone increases.
🟡 On the monthly timeframe, it’s better to have a stronger candle with a larger body.
🟡 Lately, US traders have been 2-3 days behind Asian traders, so we could see momentum building in the US session in the next few hours.
If BTC.D rises above 60.98 ➡️ look for coins that are bullish against BTC pairs and go long.
If BTC.D keeps dropping or rejects from 60.98 ➡️ most altcoins will pump, and triggers will be easier to find on their charts.
♦️ TOTAL ♦️
Uptrend confirmed ✅ Finally broke the key 3.92 level. Look for triggers in BTC or alts.
♦️ TOTAL2 ♦️
Uptrend ✅ Broke the key 1.53 level.
Break of 1.57 = next trigger.
Break of 1.62 = last entry chance before a possible bull run.
♦️ USDT.D ♦️
After 19 days, we’re back testing 4.13.
Break above = 🔥 major bullish potential.
Rejection = should not go back above 4.20.
♦️ Most Likely Scenario ♦️
BTC stays bullish with rising dominance 📈. Then BTC needs to rest & range, at which point dominance will drop. If this happens, alts — which have been moving small and slow — could explode with huge momentum.
Best to open positions before BTC starts ranging, because once it rests and dominance starts falling, you won’t get an easy entry.
Given current market conditions, rejections and stop hits in alts are possible. But personally, I’d rather enter at these levels and take a stop-loss than miss the move entirely. 😎
🚀 Smash the rocket, follow for more setups, and stay ready for the next big move!
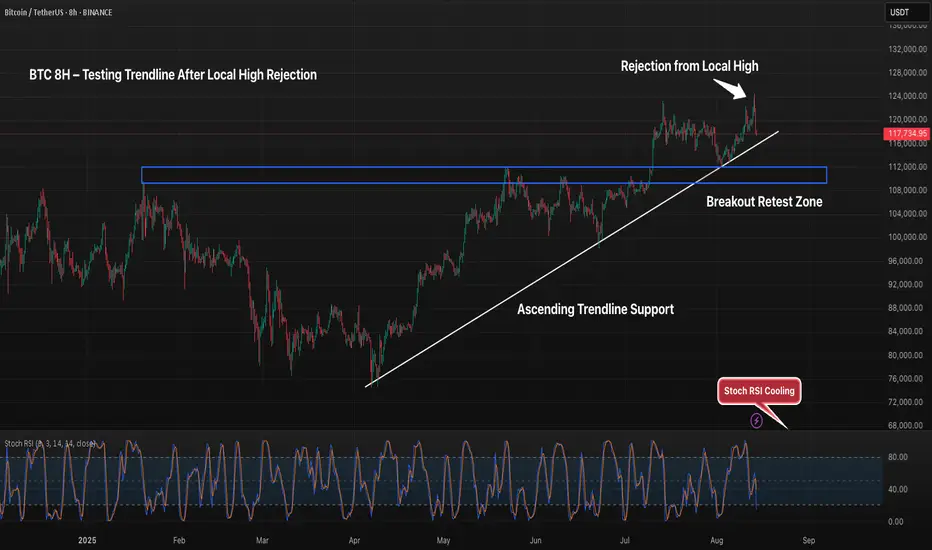
BTC 8H – Testing Trendline After Local High RejectionBitcoin’s 8H chart shows price pulling back after rejecting near 124K, now retesting the ascending trendline from April. The key breakout retest zone sits between 110K–113K, offering a potential support area if the trendline fails. Stoch RSI is cooling from mid-range levels, suggesting momentum may shift before the next move. A bounce here could target recent highs, while a breakdown risks revisiting the prior support base.
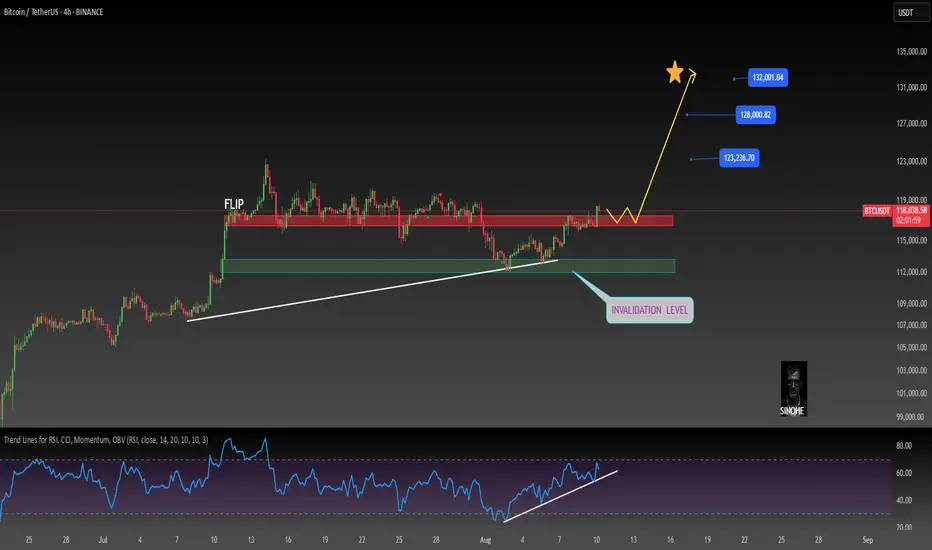
Bitcoin is super bullish (4H)This analysis is an update of the analysis you see in the "Related publications" section
If you’ve been following our previous analyses, we had a bullish outlook on Bitcoin from the lower green zone.
An important level on the Bitcoin chart has been reclaimed, and it is expected to move toward the next targets if it consolidates above the red box.
The targets are marked on the chart.
A daily candle closing below the invalidation level will nullify this analysis.
BTCUSD : Long levelHere is a great entry point for those who scalp this instrument or pips. The level is marked with a green arrow. It will be active until I report. It may become inactive over time.
Watch out for trading on the news.
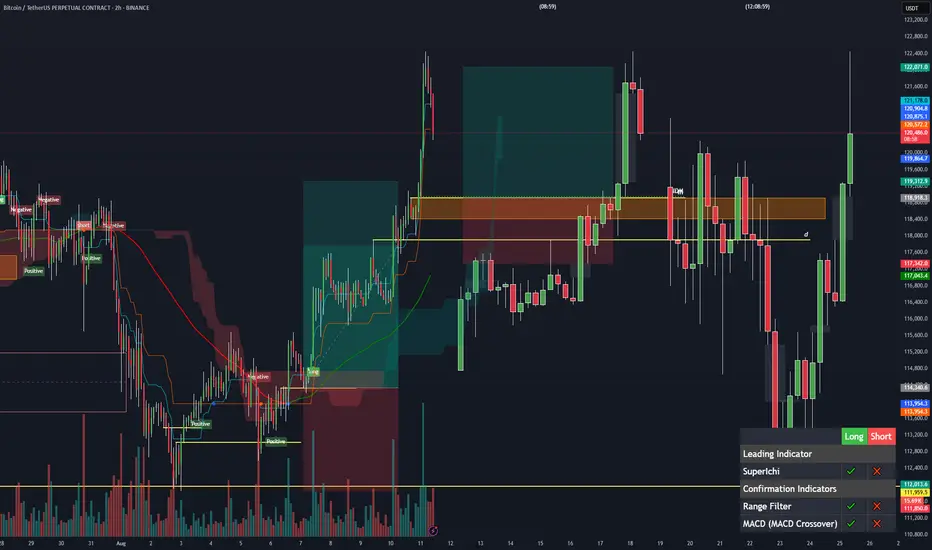
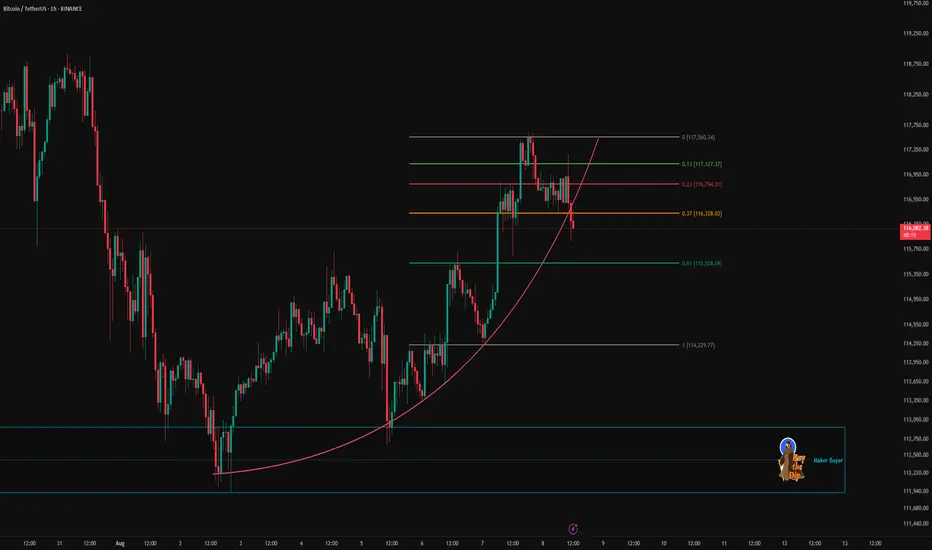
BTC 1H Analysis – Key Triggers Ahead | Day 5💀 Hey , how's it going ? Come over here — Satoshi got something for you !
⏰ We’re analyzing BTC on the 1-hour timeframe .
👀 After triggering its long signals, Bitcoin moved upward and hit the seller zone at 117,500, then reversed from that level.
🎮 A Fibonacci retracement has been drawn from $ 114,200 to $ 117,560. The price entered the zone between the 0.37 and 0.61 levels, and we need to see whether it reacts to 0.61 with selling pressure or pulls back to 0.37. Understanding market behavior in this area can guide us.
✏️ A curve line has been drawn from the first touch of the maker-buyer zone to the first touch of the maker-seller zone. This line intersects well with the 0.37 Fibonacci level, which has now been broken in current conditions.
🔽 With the increase in short positions and selling volume for Bitcoin, the price experienced a decline and correction. If selling pressure continues, Bitcoin could start a short-term correction.
⚙️ Our RSI oscillator is below the 50 level, with a support zone at 41.22. If this zone is lost, market momentum will lean more towards selling and further correction.
💸 BTC.D , if it breaks 60.72 %, could drop to lower levels, making Bitcoin lighter relative to the market.
💵 USDT.D , if it breaks 4.28 %, could also drop to lower levels, reducing Tether’s share in the market and shifting more capital into Bitcoin and altcoins.
🖥 Summary: Bitcoin was rejected from the 117,560 level and, along with selling pressure, dropped below the 0.37 Fibonacci zone. There is a support level at $ 115,530 — as long as the price stays above this zone, Bitcoin can maintain its upward trend with short-term multi-timeframe corrections.
❤️ Disclaimer : This analysis is purely based on my personal opinion and I only trade if the stated triggers are activated .
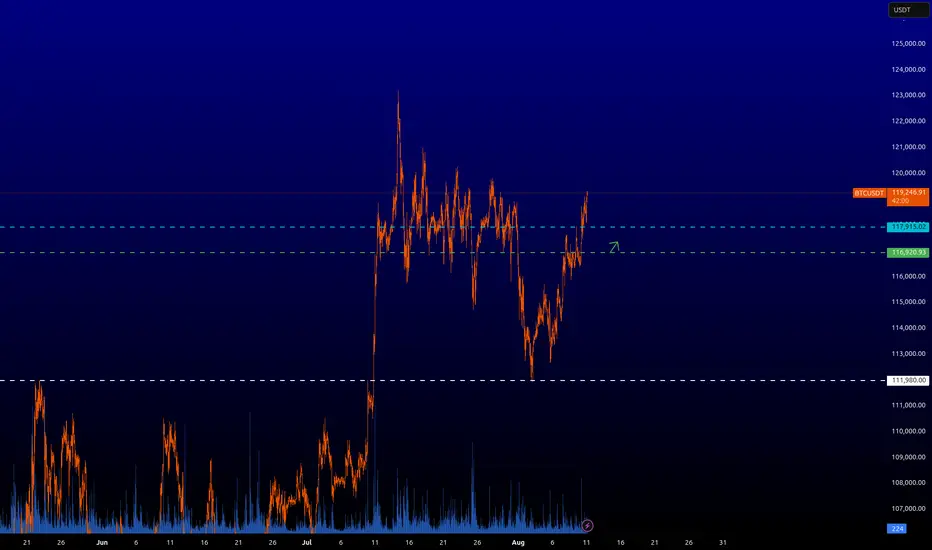
BTC/USDT: Key Levels to Watch Now!Bitcoin remains in a macro bullish structure, but recent price action shows consolidation after breaking through major resistance levels earlier this month. Similar to previous cycles, BTC tends to form short-term ranges after strong rallies before deciding the next move.
Currently, BTC is trading near $116,500–$117,000, just above a key support zone from $115,200 to $114,500. This area aligns with previous breakout levels and the 20 EMA on the 4H chart, making it critical for the short-term trend.
*Bullish Scenario: Holding above $115,200 and breaking $118,600 with strong buying volume could push BTC toward $120,500–$122,000 within days.
*Bearish Scenario: A close below $114,500 could trigger a correction toward $112,800–$111,900. Losing this level may extend the retracement to $110,200 (major demand zone).
Summary:
BTC is consolidating near key support. Past scenarios suggest a breakout above $118,600 could fuel the next bullish leg, but losing $114,500 risks a deeper pullback toward $112,800. The next 2–4 days should define short-term direction.
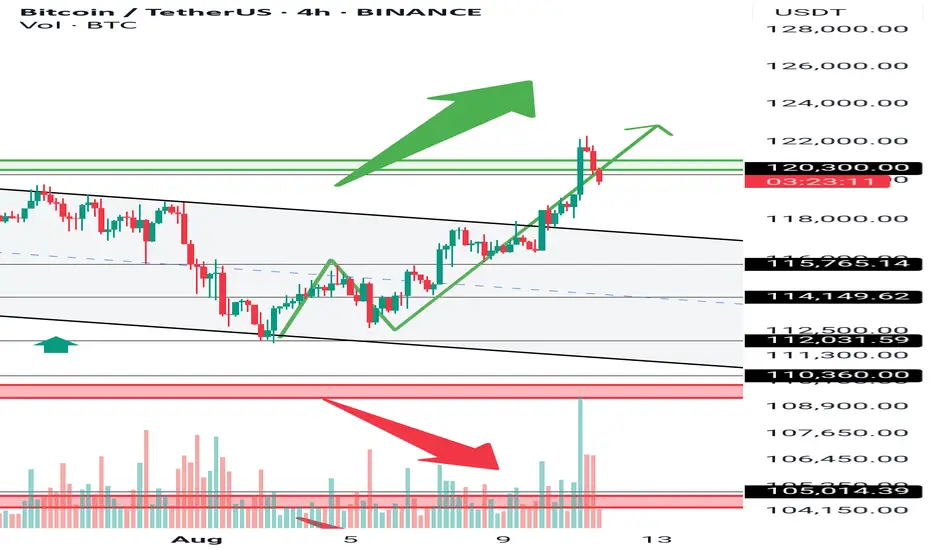
BTCUSDT targeting 137K$ soonAs we can see market is holding strong here and soon we are looking for more rise and pump here like the green arrows on chart also if BTC now here hold strong and play some range that would be perfect and why is that?
because we should say hi to ALT season then after a years of patience and it would be time to see some of the charts of ALTs flying.
DISCLAIMER: ((trade based on your own decision))
<<press like👍 if you enjoy💚

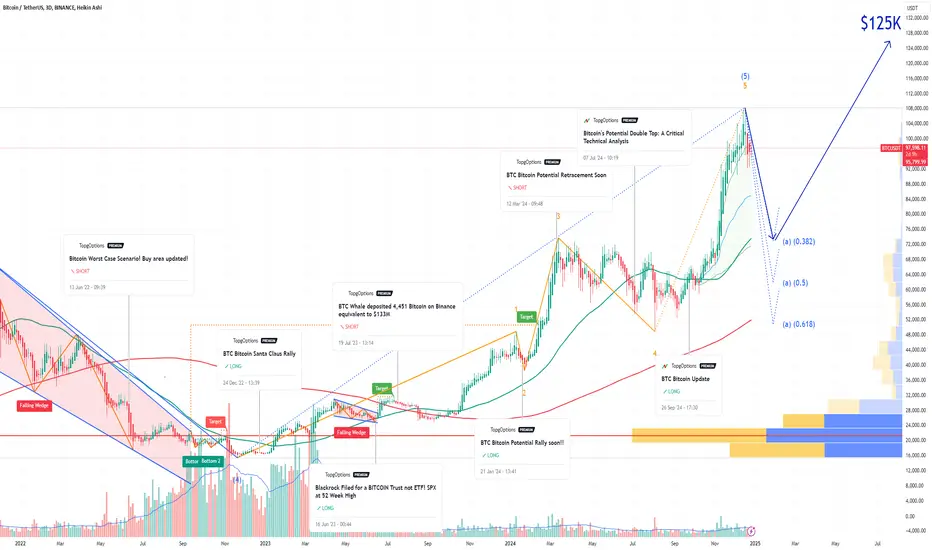
BTC Bitcoin Among My Top 10 Picks for 2025 | Price TargetIf you haven`t bought BTC Bitcoin before the recent breakout:
My price target for BTC in 2025 is $125K, driven by the following fundamental factors:
Regulatory Developments Favoring Adoption:
The anticipated regulatory shifts in the United States are expected to create a more favorable environment for cryptocurrencies. With the potential for pro-crypto policies under a new administration, including the establishment of Bitcoin as a strategic reserve asset by major nations, investor confidence is likely to increase significantly. Analysts suggest that such developments could drive the total cryptocurrency market capitalization from approximately $3.3 trillion to around $8 trillion by 2025, with Bitcoin poised to capture a substantial share of this growth.
Increased Institutional Demand through ETFs:
The launch of Bitcoin exchange-traded funds (ETFs) has already begun to transform the investment landscape for Bitcoin, making it more accessible to institutional and retail investors alike. Following the successful introduction of multiple Bitcoin ETFs in 2024, analysts project that inflows could exceed $15 billion in 2025, further boosting demand for Bitcoin. This increased accessibility is expected to drive prices higher as more investors seek exposure to the asset class.
Supply Constraints from Halving Events:
Bitcoin's supply dynamics are fundamentally bullish due to its halving events, which occur approximately every four years and reduce the rate at which new Bitcoins are created. The most recent halving in April 2024 has led to a significant reduction in supply inflation, creating scarcity that historically correlates with price increases. As demand continues to rise while supply becomes more constrained, this fundamental imbalance is likely to support higher prices.
Growing Adoption as a Store of Value"
As macroeconomic conditions evolve, including persistent inflationary pressures and potential monetary policy easing, Bitcoin is increasingly viewed as a viable store of value akin to gold. This perception is bolstered by its finite supply and decentralized nature, making it an attractive hedge against inflation. Analysts suggest that as more investors turn to Bitcoin for wealth preservation, its price could see substantial appreciation
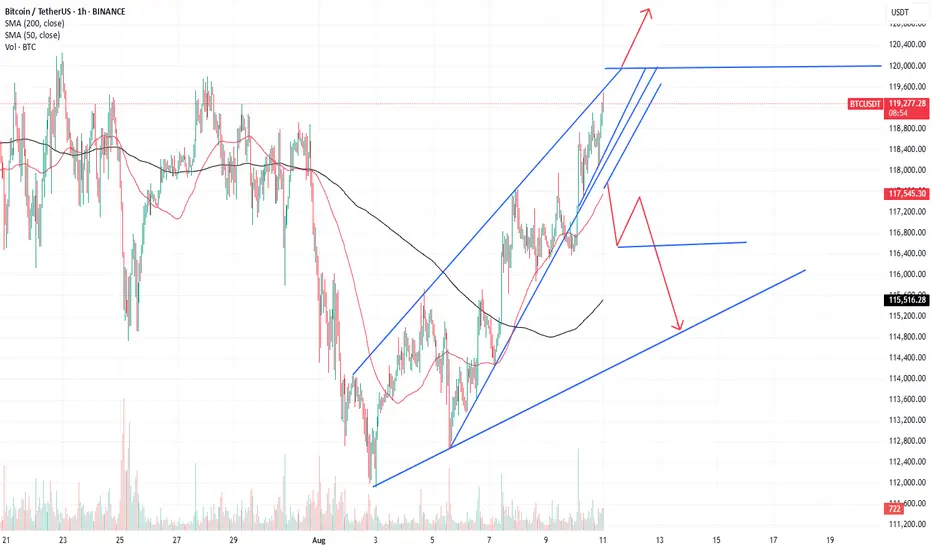
BTC - Rising Wedge testing previous Channel highBTC has made a strong recent runup and is now testing the high side of a recent consolidation channel.
A Rising Wedge making higher highs and higher lows is pushing BTC into overbought territory and if the attempts at the previous channel high fails, with price falling through the lower wedge support line, there could be a period of bearish exhaustion to previous support zones.
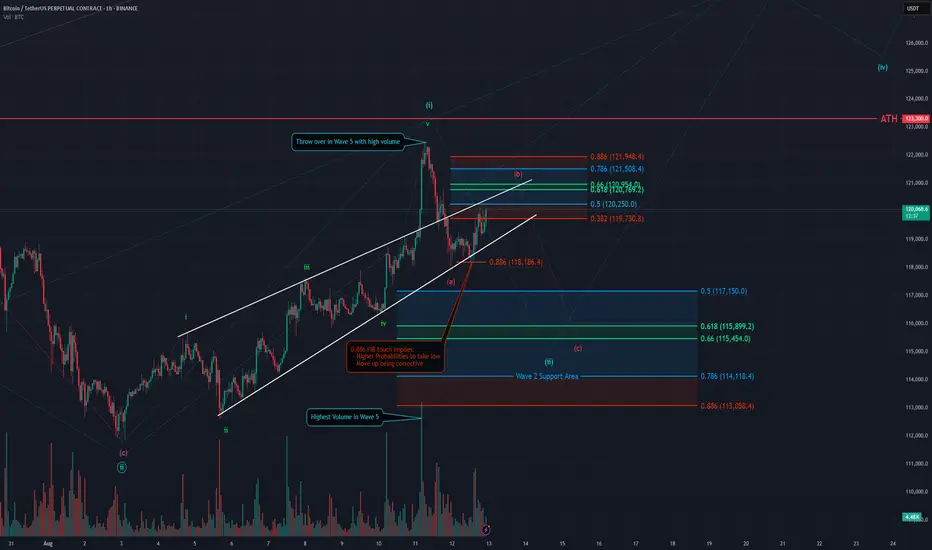
BTC - 1H Elliott Wave Analysis - 12.08.25Greetings! Another update for you lovely traders :)
Not trying to be confusing, yesterday we looked at the multiple 1-2's set up case, so if you're interested in that count too we recommend you to check out our last analysis which will be linked in the noted down below. Today we will look at the diagonal scenario which we briefly mentioned yesterday!
We assume that the recent move up was a diagonal displayed in green as a five wave move up which ended on the green Wave 5 being a throw over, meaning it pushed over the trendline with high volume and it did enter the wedge later on again. This leading diagonal finished the blue Wave 1 and we are looking for blue Wave 2 now which we would like to get after a pullback as red ABC.
The blue Wave 2 support area lies between the 0.5 FIB at 117150 USD and the 0.786 FIB at 114118 USD. We can not calculate targets for the red Wave C yet. The red Wave A seems to have bottomed. In today's bounce we see that we have a 0.886 FIB touch after the red Wave A low which indicates that the next move up is corrective and not impulsive and that the red Wave A low has a higher probability to be taken again.
The red Wave B target area is between the 0.382 FIB at 119730 USD and the 0.886 FIB at 121948 USD. Keep in mind B waves do not have to strictly respect the target area. We could very well get an overshooting B wave that maybe even takes out the ATH, this would be a bullish sign.
Thanks for reading.
NO FINANCIAL ADVICE.
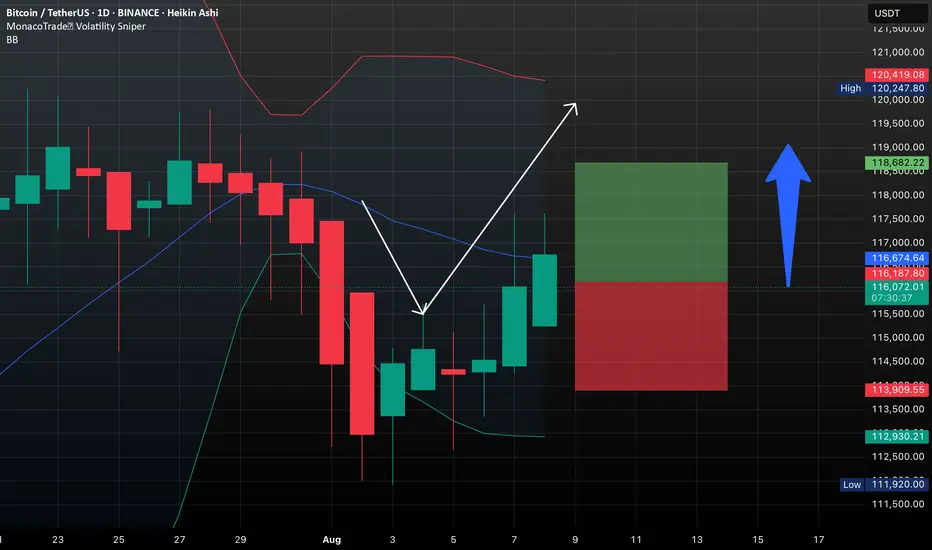
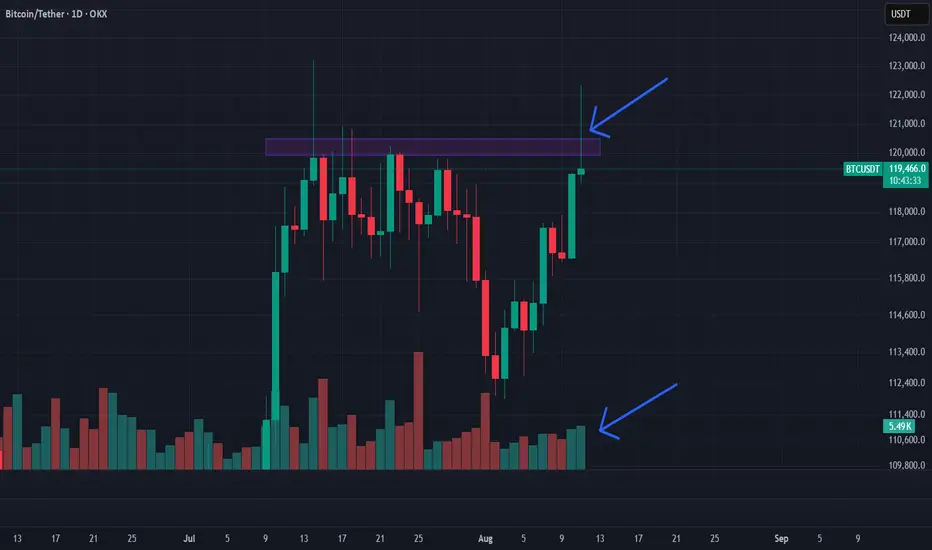
Bitcoin’s Next Move? ETH Heating Up & Altcoin Liquidity Shifthey I’m Skeptic,
in this one we’re looking at BTC’s breakout attempt, the good & bad signs in the daily candle, and why ETH & other alts are moving while BTC is ranging.
also sharing my triggers for both BTC & ETH, plus what I’m watching on BTC.D for the week ahead.
manage your risk, don’t fomo — peace out :)

TradeCityPro | Bitcoin Daily Analysis #145👋 Welcome to TradeCity Pro!
Let’s get into Bitcoin analysis. Yesterday, Bitcoin was rejected from the zone I had mentioned, and today it will probably begin its new downward move.
⏳ 4-Hour Timeframe
In yesterday’s analysis, I told you that a pullback to SMA25 and the 0.5 Fibonacci zone was possible. That happened, and now, given the current candle, the probability of a corrective scenario has increased.
✔️ I still won’t open any position on Bitcoin and am waiting for it to exit the box between 110000 and 116000. But if certain conditions occur in the market, I might open a position inside this box as well.
✨ First of all, Bitcoin is still above the 111747 support, which is a very important support zone. As the price reaches it, there’s a chance it gets stuck there again.
📊 On the other hand, seller strength is very high, and as you can see, the RSI has been rejected from the 50 ceiling, and a red engulfing candle with very high volume is forming — all of which indicate the power of sellers.
🔽 I still stand by my opinion that as long as the price is above 110000, I won’t open a short position. But for a long position, we can move to the 1-Hour timeframe to review the trigger that has formed.
⏳ 1-Hour Timeframe
Before reviewing the triggers, there’s a very important point that explains why I currently prefer to remain without a position.
💫 Bitcoin in the HWC and MWC cycles has a very strong upward trend. Right now, in the LWC, it’s moving downward. So this Fibonacci drawn on the bearish leg doesn’t really mean much and won’t give us very strong and accurate resistances.
🔍 On the other hand, the LWC is moving against the higher cycles — meaning the higher cycles are stronger. That’s why shorting doesn’t make sense, since it’s against the main market cycle.
🔑 But also, since LWC has gained downward momentum, long positions — if not set with wide stop-losses — will likely get stopped out, because this momentum may cause small downward legs that hit stop-losses.
👀 So opening a long position is also difficult right now, and that’s why I say it’s better to wait for the price to move out of the 110000 to 116000 range, and then enter a position more comfortably.
🎲 If the price goes below 110000, we’ll receive the first sign of a trend reversal in the MWC, and then we can open short positions. And if it goes above 116000, LWC becomes bullish again and the continuation of the uptrend can begin.
Let’s now go to the triggers:
📈 The trigger we have for a long position is 115327 — an important ceiling that overlaps with the 0.5 Fibonacci level and has been touched several times.
☘️ If we get another touch to this level, I myself will likely try to open a long position, and I think it’s a good entry point that’s worth the risk to anticipate a breakout of 116000.
🔽 For a short position, a break below the 112205 low will start the continuation of the correction. I won’t open this position myself, but if you believe Bitcoin wants to reverse its trend, this is a very good trigger in terms of price level and you can open the position.
❌ Disclaimer ❌
Trading futures is highly risky and dangerous. If you're not an expert, these triggers may not be suitable for you. You should first learn risk and capital management. You can also use the educational content from this channel.
Finally, these triggers reflect my personal opinions on price action, and the market may move completely against this analysis. So, do your own research before opening any position.

Sellers – the final bastion
summery
We will analyze Bitcoin on the daily timeframe regarding this critical week
Analysis
A daily candle that has drilled through the heavy resistance level of 120,000 up to around 123,000 can only mean one thing: if the candle closes in this manner, I anticipate a healthy bullish move in the lower timeframes this week .
However, we must remember that today’s candle needs to close green, and tomorrow’s candle should never be a weak or small one.
Trade Plan
You should be ready to open positions in the lower timeframes tomorrow, but never forget risk and capital management!
Disclaimer
This content is purely analytical in nature and should not be interpreted as financial advice or a trading signal. All trading decisions and their outcomes are entirely the responsibility of the trader. The cryptocurrency market is highly volatile and may lead to the loss of part or all of your capital. Always conduct your own analysis and apply proper risk and capital management before entering any trade.
#Bitcoin #BTC #CryptoAnalysis #TechnicalAnalysis #CryptoTrading #TradingPlan #PriceAction #CryptoMarket #CryptoStrategy #RiskManagement #Altcoins #CryptoSignals #MarketAnalysis #DayTrading #SwingTrading
BTCUSDTlet see what will happen my expactation it is. it is doing w and high. there is idm level and below of it exist fvg and order block when you check daily and weekly you will see the level which i mention.