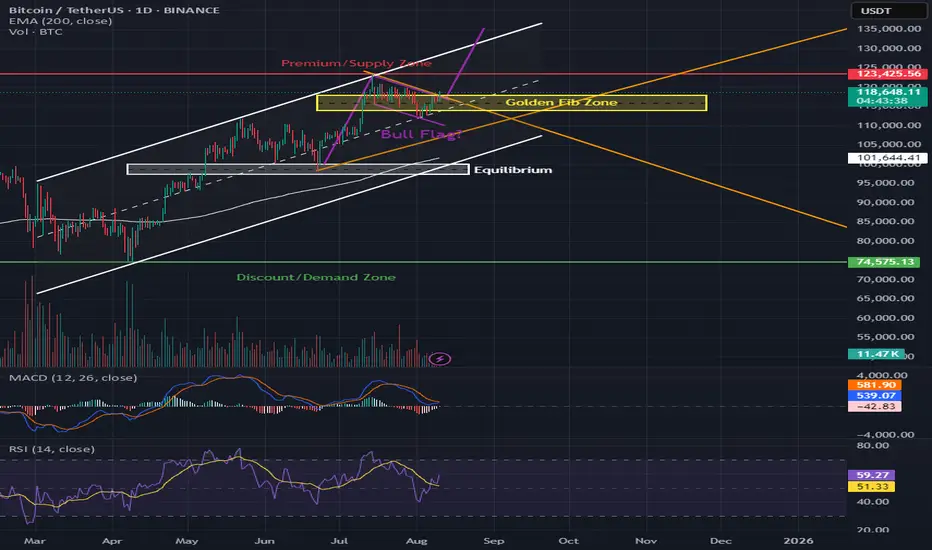
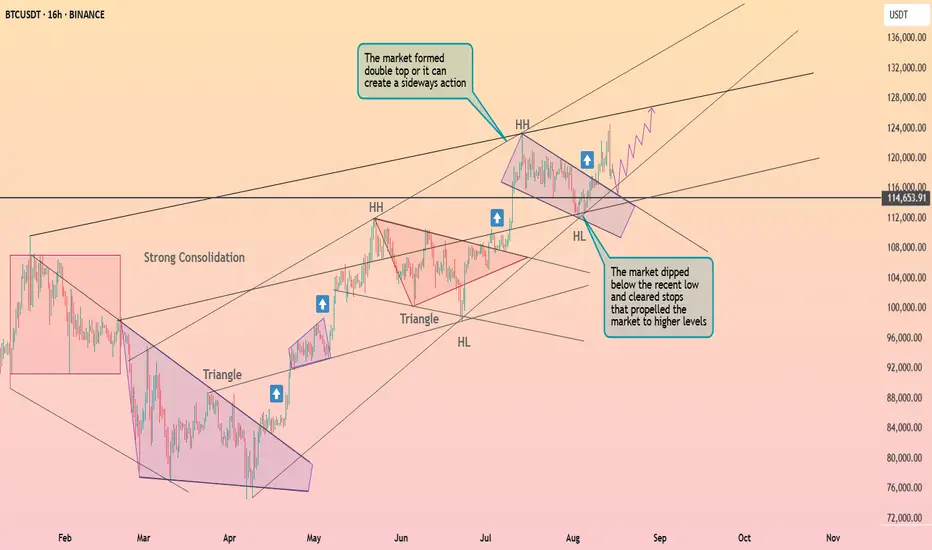
Bitcoin Bull Flag at Golden Fib – Ready for $123K or Breakdown?📊 Market Breakdown
BTC is trading at $118,603, consolidating in a bull flag pattern right inside the Golden Fib Zone (~$116K–$119K). The 200 EMA at $101,643 remains well below, showing this is still a bullish mid-term trend. If we break out, $123K (Premium/Supply Zone) is next — but if the flag fails, we could revisit equilibrium.
Trend: Higher highs and higher lows since the April 2025 bottom; now flagging under major resistance.
Key Structure: Golden Fib Zone acting as a launchpad; $116K equilibrium below as near-term support.
Volume: Consolidation volume dropping — typical for a flag before breakout.
Indicators:
MACD: Bearish crossover still present but flattening — momentum could flip.
RSI: 59.16 – mid-zone, leaving room for an upside push.
🛒 LONGS (Bullish Scenario)
Buy Zones:
🎯 Aggressive Entry: $116K–$117K bounce within flag
✅ Confirmation Entry: Daily close above $119.5K
Take Profits:
1️⃣ $123K – Premium/Supply Zone
2️⃣ $128K – Upper channel resistance
3️⃣ $135K – Extension target if breakout is strong
Stop-Loss: $114.5K
Why This Works: Bull flag breakouts often lead to sharp continuation moves; $123K is the first magnet above.
🛑 SHORTS (Bearish Scenario)
Sell Zones:
🚨 Aggressive Entry: Rejection at $119.5K
📉 Breakdown Entry: Close below $116K
Take Profits:
1️⃣ $112K – Mid-channel support
2️⃣ $107K – Pre-breakout base
3️⃣ $101.6K – 200 EMA & strong demand
Stop-Loss: $121K
Why This Works: Losing $116K invalidates the bull flag and opens the door for a retest of the lower supports.
🔍 Technical Highlights
Bull Flag in Play: Textbook consolidation before a possible leg higher.
Golden Fib Zone: Price coiling in a key retracement area before breakout/rollover.
Macro Watch: BTC’s next move will heavily influence crypto-related stocks (MSTR, RIOT, MARA).
USDTBTC trade ideas
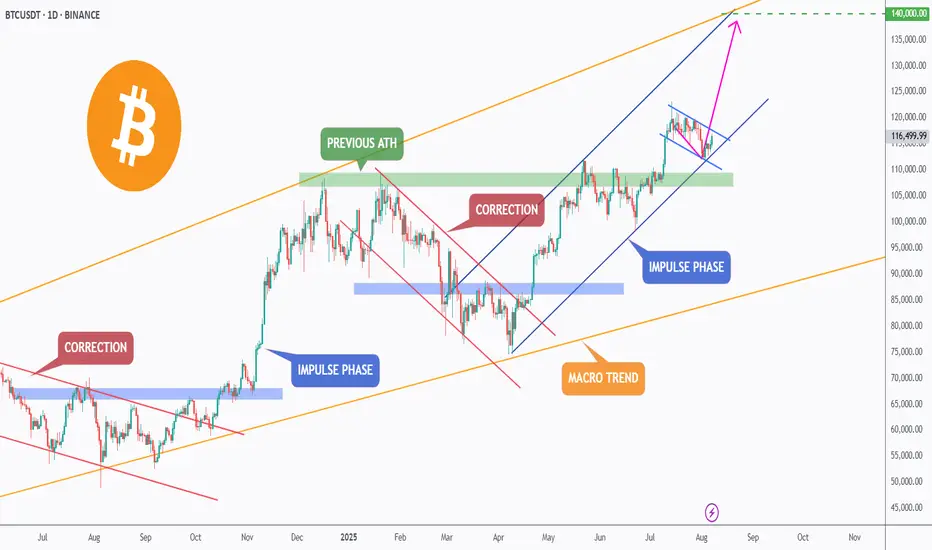
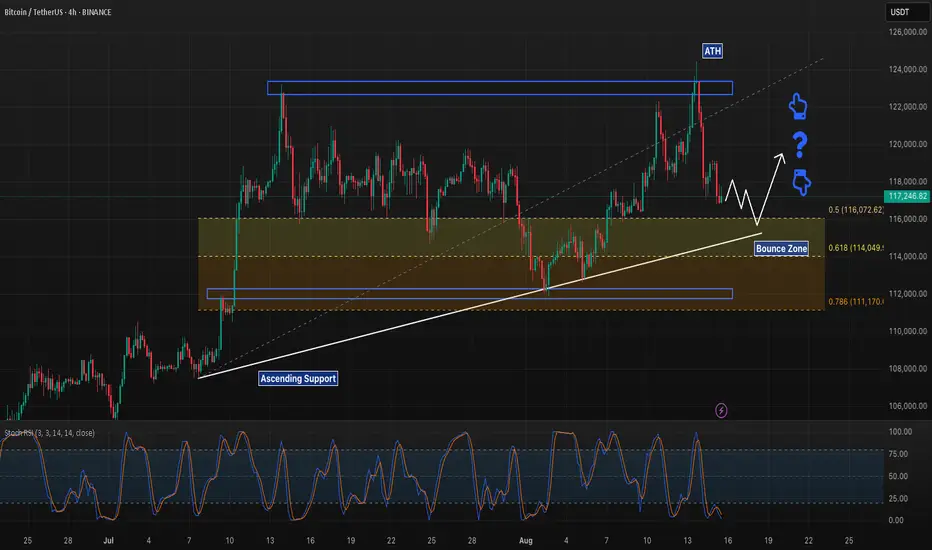
BTC – Breakout Loading?Bitcoin continues to respect its macro bullish trend (🟠), trading within a large ascending channel that has guided price action for over a year.
After breaking above the previous ATH 🟢, BTC entered a correction phase 🔻, retesting the green zone — a key structure now acting as support.
The bulls stepped back in, initiating a new impulse phase 🔵. Currently, BTC is consolidating within a small blue descending channel — forming a classic bullish flag 🏁 pattern.
⚠️ For the bulls to take over and trigger the next impulsive wave toward $140,000 🎯, we need to see a confirmed break above this small blue channel. This would signal trend continuation and open the door to the upper boundary of the macro channel.
✅ Key levels to watch:
- Support: ~$110,000 (green demand zone) 🟩
- Resistance: Top of the blue flag 🟦
- Target: $140,000 💰
A breakout from here could fuel the next major rally — stay sharp and follow the trend!
💬 What’s your bias here? Are you bullish or waiting for a deeper pullback?
📚 Always follow your trading plan regarding entry, risk management, and trade management.
Good luck!
All Strategies Are Good; If Managed Properly!
~Richard Nasr
BTC LONG till 123ki am late on posting this BTC is bullish
#LONG
BTCUSDT #LONG till 123k and move upwards Mark My words
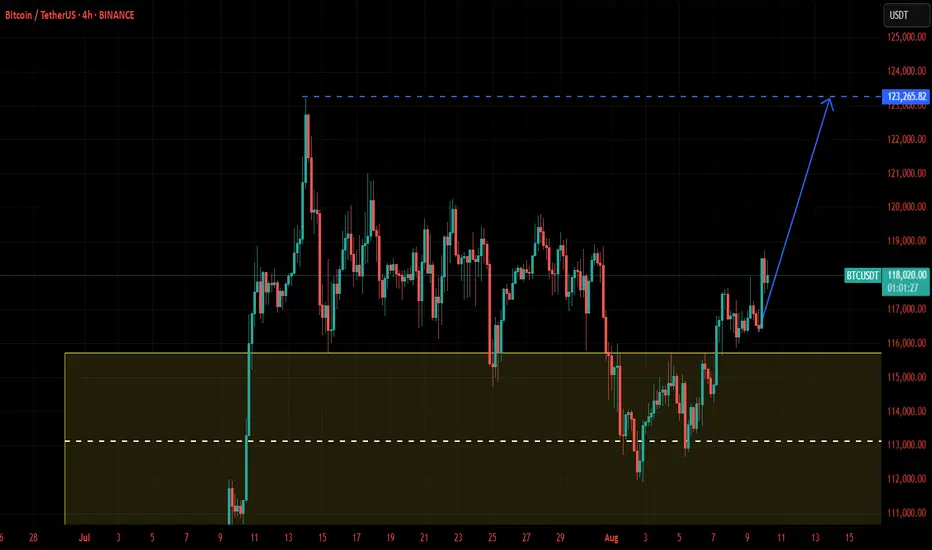
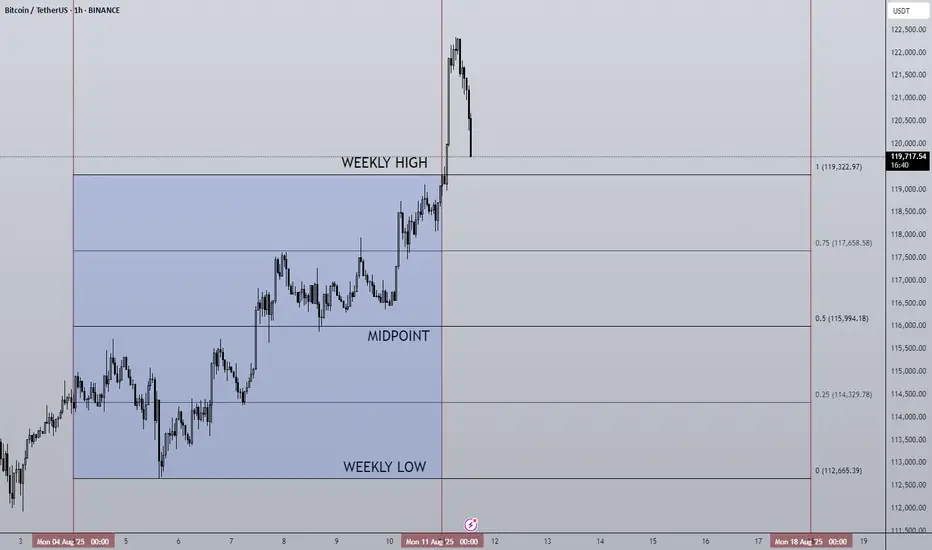
11/08/25 Weekly OutlookLast weeks high: $119,322.97
Last weeks low: $112,665.39
Midpoint: $115,994.18
BTC takes back the spotlight as the week ends! Breaking through the previous weeks high just hours after weekly close and stopping just shy of ATH. This rally comes off the back of a successful bounce from $112,000 area and mirrors the previous weeks drawdown almost perfectly setting up an interesting week ahead.
I am still wary of August seasonality, yes BTC and the broader altcoin market especially ETH have seen great gains so far this month but history shows August is not kind to the bulls;
August '24: -8.74%
August '23: -11.27%
August '22: -13.99%
August '21: +13.42%
August '20: +2.74%
August '19: -4.84%
August '18: -9.0%
Now history doesn't necessarily repeat itself but it does rhyme. Should BTC SFP and accept below the weekly high I would say a $115,000/ Midpoint retest is a logical move. RSI has been posting bearish deviations on HTF (1W&1M) which can suggest a shift in trend is coming but further proof of this would be needed before then
This week CPI & PPI take place on Tuesday and Thursday respectively. With a September interest rate cut on the horizon this data release may be more important than it has been in recent months so I'm keeping a close eye on the result.
Previous: 2.7%
Forecast: 2.8% (+0.1%)
For altcoins many have had great rallies, ETH predominantly after breaking through $4000, again many indicators are showing a local top is due so I am looking at price action context for any clues of a pullback to come, until then the trend is your friend.
Good luck this week everybody!
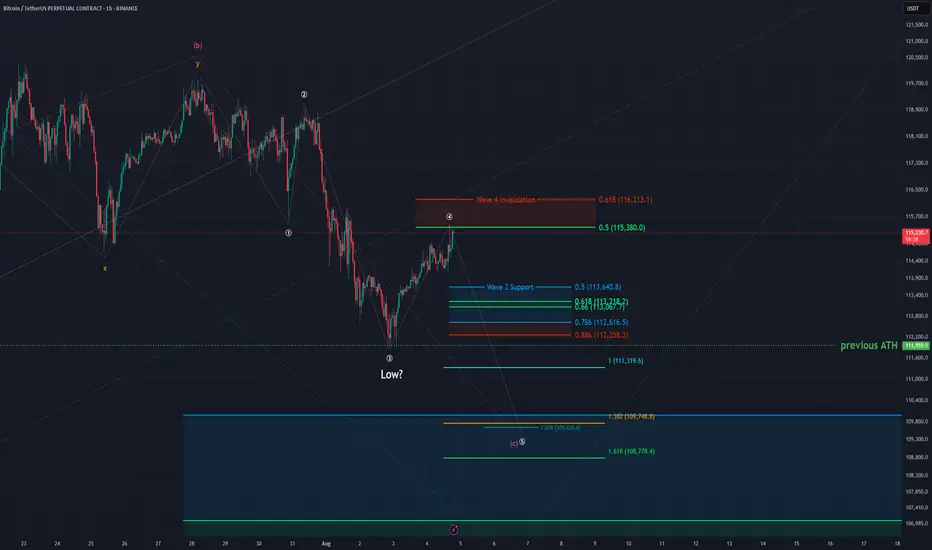
BTC - 1H Elliott Wave AnalysisWelcome back to another Elliott Wave Analysis for Bitcoin! :)
In this analysis we want to focus on the short term. We have been in a correction displayed as pink ABC and it seems that this correction is coming or has come to an end in the pink Wave C.
It is hard to say if the pink Wave C has finished yet. The last low at 111'850 USD is the 1 to 1 ratio of the pink Wave A to the pink Wave C which is a common target for Wave C.
Looking at the sub-count in white we think another low in white Wave 5 would look cleaner but it is not given to happen.
For now we added the white Wave 4 resistance of which we touched the 0.5 FIB retracement at 115'830 USD which is a rather deep but valid Wave 4. We also added the 0.618 FIB at 116'213 USD which would be the invalidation for the white Wave 4. If we hit it the probabilities shift to the case that the low at 111'850 USD is already the end of pink Wave C.
If we get white Wave 5 the first target would be at the 1 to 1 FIB at 111'319 USD which is right below the last ATH of which we bounced recently but that seems a bit shallow.
The next target would be at around 109'700 USD where we got some confluence between the 1.38 FIB target for white Wave 5 measured with the white Wave 1 as well as the 1.618 FIB target if we measure of the white Wave 4. It is also close to the 0.5 FIB of a bigger support area.
Be aware that the bigger support area below goes down to 103'000 USD which is the 0.786 FIB of the support area.
Due it looking likely that pink Wave C is finished we also added the support area for the potential Wave 2 in the bullish scenario.
It is between the 0.5 FIB at 113'640 USD and the 0.786 FIB at 112'616 USD. From this area we would like to see a bounce if the low is already in.
Thanks for reading.
We would appreciate a follow and boost if you like the analysis! :)
NO FINANCIAL ADVICE.
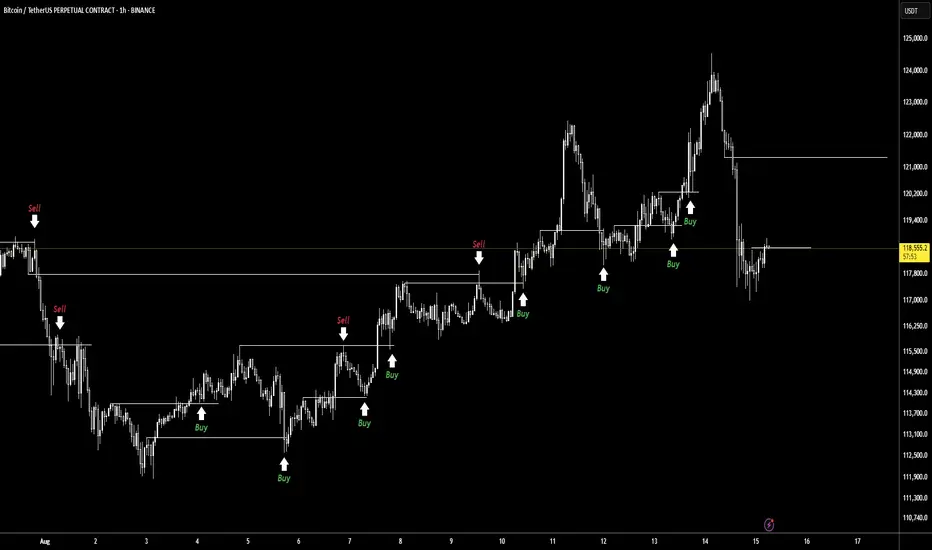
Analysis LearnOpen the image to see it in higher quality. 🕯 The points marked are potential entries based on market conditions and higher timeframe analysis. If confirmed, I may take the trade. The win rate usually ranges between 30% and 60%, which means that out of all these buy and sell setups, up to 60% might result in a loss.
📕 Many of you have asked for tutorials here and on TradingView. Please understand that I don’t have the time to provide them, and the best way to learn is by trading with your own money—which you’ve worked hard to earn—of course, not with large amounts but with proper risk management.
🙏 I hope this chart helps you.
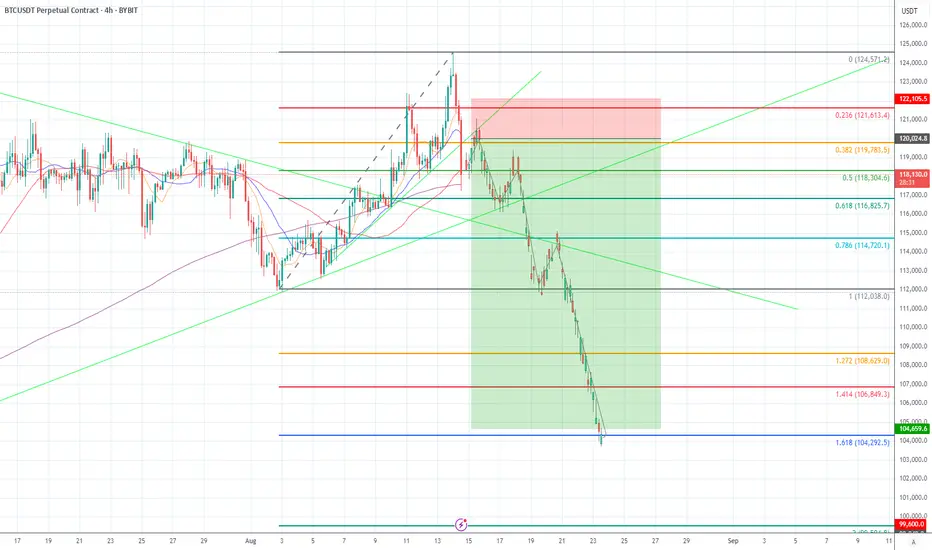
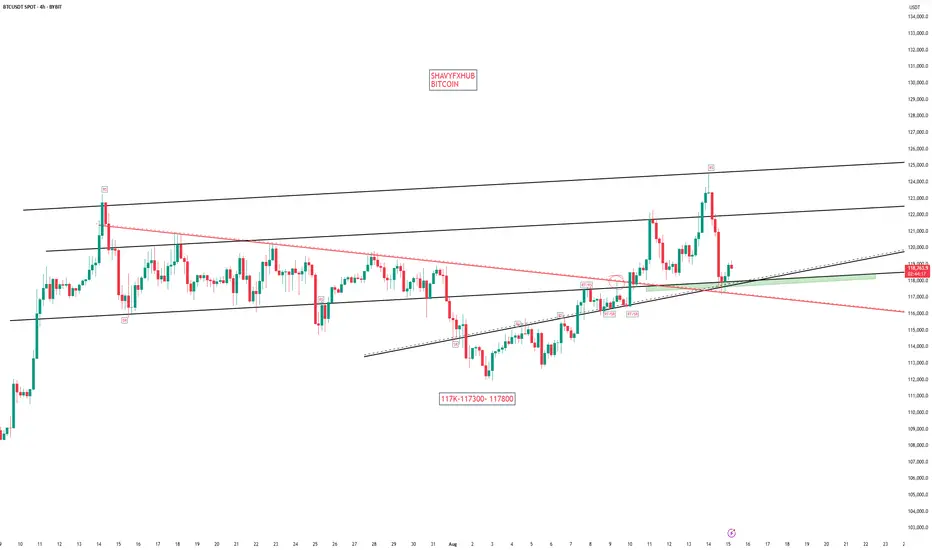
Short BTCBTC (4H) — post-breakdown short. Price lost the rising structure and the long up-trendline, then failed a retest into a heavy confluence zone (Fib 0.382–0.5 at 119,783–118,384 plus supply under ~120k–121.6k). Market is now printing lower highs/lows toward Fib extensions 1.272 → 1.414 → 1.618 at 108,629 → 106,849 → 104,293. Invalidation on a sustained reclaim of 121.6–122.1k.
What your image shows, step by step
Timeframe & instrument: BTCUSDT Perpetual, 4-hour (Bybit).
Structure break: A steep, dashed rising channel/wedge into the local high was impulsively broken. That drop also cut through the green diagonal up-trendline, turning it from support into resistance.
Failed retest (confluence): Price bounced back only to stall below a tight cluster:
Fib 0.382 @ 119,783 and 0.5 @ 118,384,
the prior up-trendline (now resistance),
and the 0.236 @ 121,613 just above.
This is classic “break → retest → reject.”
Trend now: Clear lower highs and lower lows with an accelerating, dotted descending channel guiding the move.
Targets marked on your chart:
First support/target around the prior range base (~112,038), then
Fib extensions: 1.272 = 108,629, 1.414 = 106,849, 1.618 = 104,293 (blue line).
There’s even a deeper extension labeled near ~99,600 if momentum overshoots.
Trade box (your R:R):
Entry region: ~118.3k (post-retest failure).
Stop/invalid: 121.6–122.1k (red box, above 0.236 and supply).
Profit zone: down to ~104.7–104.3k (green box near 1.618).
That’s roughly a 3.5–4R idea to the main target.
Why BTC looks weak here (the logic behind the short)
Loss of key structure: Breaking a steep wedge and the major rising trendline, then failing to reclaim it, shifts control to sellers.
Bearish retest at resistance: The rejection happened where multiple resistances overlap (trendline + Fib 0.382/0.5 + supply under ~120–122k). Confluence rejections are high-quality short triggers.
Momentum & market structure: The sequence after the break is a textbook impulsive leg down → shallow bounce → continuation, confirming a down-trend on 4H.
Clear, mechanical targets: With the prior range supports gone, Fib extensions (1.272/1.414/1.618) provide objective downside magnets—exactly the levels you’ve plotted.
Asymmetry: Tight invalidation just above ~122k versus multi-thousand-dollar downside to ~108k/106k/104k creates attractive risk/reward for a tactical short.
How to read/defend the setup (concise playbook)
Bearish while: Price stays below 118.4–119.8k and can’t close back above the broken trendline.
Invalidation: Sustained reclaim above 121.6–122.1k (back inside the red box and above 0.236) = idea is wrong; flatten.
Take-profit ladder: 112.0k → 108.6k → 106.8k → 104.3k (move stops down as each level tags).
Bonus confirmation (if you want it): Another lower-high under ~120k or a clean 4H close below 116.8k (Fib 0.618) often accelerates the move.
Not financial advice—just a precise explanation of your chart and the short thesis it supports.
BTC shortHere’s the English translation of your sentence:
"I see a BTC short opportunity here. The market will reverse from this area. Please confirm the trade according to your own analysis and place it. Thank you."
BTC Breaks the Cage – Is $125K Next? (With Built-In Invalidation🔥 Welcome to The Wick Syndicate 🔥
The $118K prison bars just snapped — and Bitcoin didn’t even pause to look back.
We’ve been shadowing this move for days, waiting for the exact moment the door would swing open.
Now it’s here — a textbook continuation setup for those who know how to ride the current.
In a bull run, pullbacks aren’t fear.
They’re the market leaning in, asking quietly: “Care for another bite before we run?”
📊 BTCUSDT.P – Long Setup
🎯 Direction: Long
📍 Entry Zone: $119,800 – $120,200 (Breakout base retest + POC support)
🩸 Stop Loss: $118,500 (Below base & liquidity sweep)
🎯 Take Profits:
• TP1: $122,500 (Intraday liquidity)
• TP2: $124,000 (HTF extension)
• TP3: $125,000 (Round number + major liquidity)
📐 RR Ratio: ~1:2.6
🧠 Logic: HTF breakout above $118K range, spot-led buying pressure, OI rising, low resistance ahead. Bull run momentum favors shallow pullbacks & fast legs higher.
⏱ Trust Meter: ████████▒▒ 80%
⸻
⚠️ Execution Rules – Read Before You Ape
We never enter without confirmation.
For this trade, confirmation means:
• Price retests $119,800–$120,200 and holds above with a clear bullish M15–M30 CHoCH/BOS or footprint/CVD absorption.
• A clean 30m close below $118,500 = setup invalidated, bias flips to neutral until new structure forms.
No confirmation = no trade. Fakeouts in bull runs are savage — trade smart, not desperate.
⸻
Candle Craft | Signal. Structure. Execution.
BTCUSD WILL FLY HIGHAccording to H1 analysis BTCUSD is in flying pressure from last few days and market break the resistance level and make RBS resistance become support
market will be falling soon and reached at support level if you want then go long from support level
TRADE AT YOUR OWN RISK
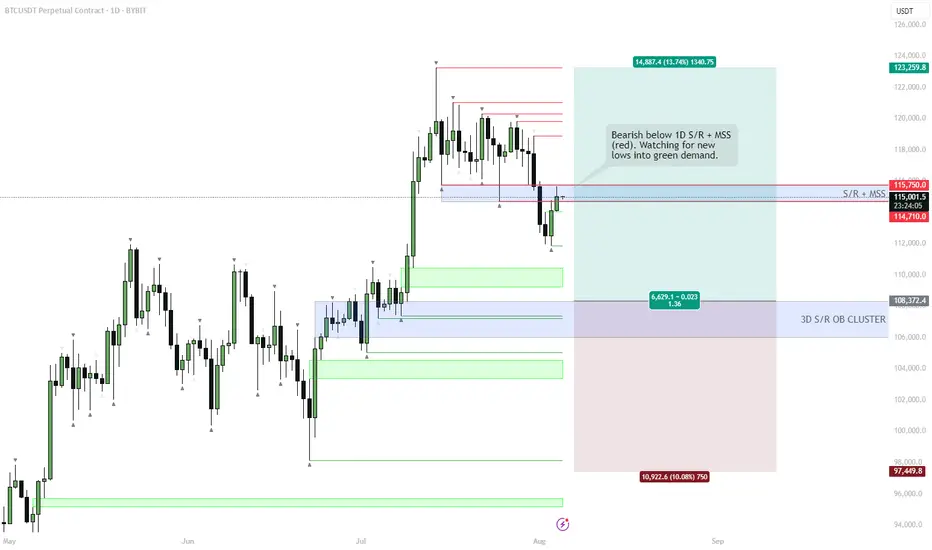
BTC – Still looking heavy below key resistanceDespite a short-term relief bounce after Monday’s drop, BTC remains below the critical 1D MSS + S/R (red box). Structure is weak until this level is reclaimed. Bears remain in control as long as price can’t close above 115.7k.
Plan:
Maintain bearish bias while below the red box — expecting new lows, targeting the green demand/OB cluster around 108.3k.
Flip the red box (close above 115.7k) and the outlook shifts to neutral or bullish.
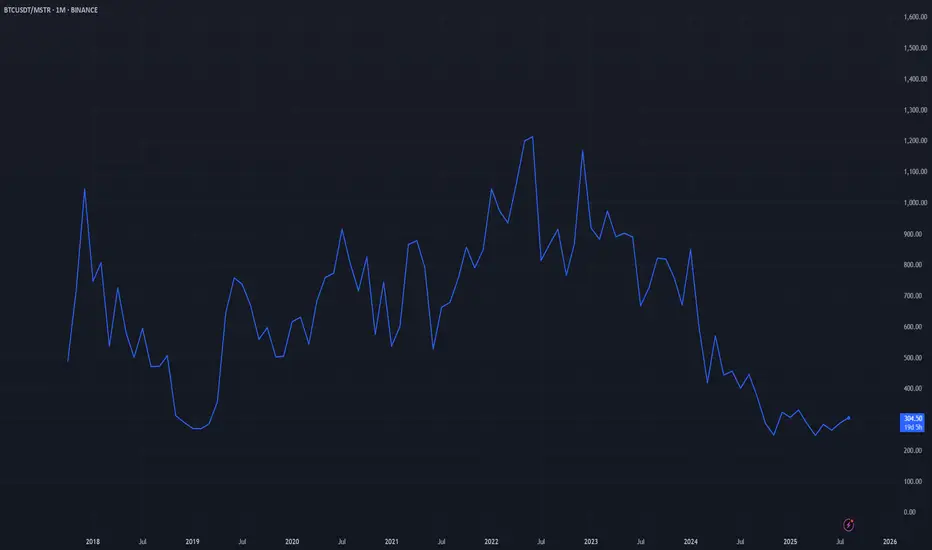
BTC/MSTR Pair Monthly ChartA 1M line chart that shows the BTCUSDT/MSTR Pair. Time to find a faster horse?
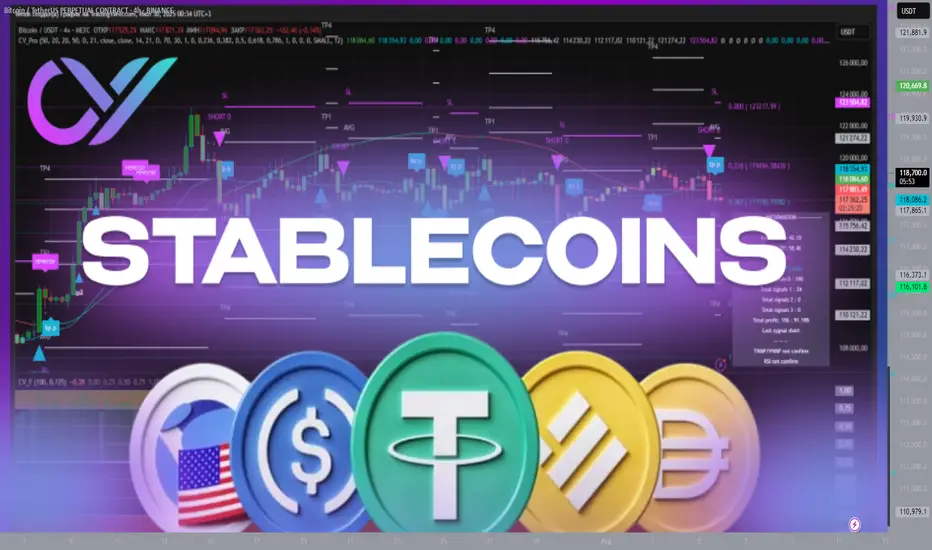
Stablecoins: Stability in a World of VolatilityIn the cryptocurrency space, everything changes rapidly: trends form within hours, and assets can rise or fall by double-digit percentages in a single day. In such conditions, traders need a tool that allows them to preserve capital and act without haste. That tool is the stablecoin — a digital asset with a fixed price.
They serve as a kind of “safe harbor” in the storms of the crypto market. Even if Bitcoin or Ethereum face a sharp correction, a stablecoin theoretically remains equal to 1 US dollar (or another pegged currency).
What is a Stablecoin
A stablecoin is a token whose value is pegged to a base asset at a 1:1 ratio. Most commonly, this peg is to the US dollar, but there are stablecoins linked to the euro, gold, or even a basket of assets.
The idea is simple: combine the convenience of cryptocurrencies (fast transfers, no borders, transparency) with the predictability of traditional money. This allows traders to quickly move capital between positions or exchanges without losing value to volatility.
Main Types of Stablecoins
1. Fiat-Backed
The issuer holds actual dollar reserves in bank accounts.
The peg is maintained by allowing token holders to redeem them for fiat at any time.
Examples: USDT (Tether), USDC.
Pros: high liquidity, easy to understand.
Cons: reliance on the issuer and a centralized structure.
2. Crypto-Backed
Backed by other cryptocurrencies used as collateral.
Collateral often exceeds the token’s face value to protect against volatility.
Example: DAI by MakerDAO.
Pros: decentralization and blockchain transparency.
Cons: risk of a sudden drop in collateral value, which can trigger liquidations.
3. Algorithmic
The peg to the dollar is maintained via smart contracts that regulate the supply of tokens.
Tokens are minted when the price rises and burned when it falls.
Examples: former UST (Terra) before its 2022 collapse.
Pros: decentralization, no need for real reserves.
Cons: highly vulnerable to market panic.
Why Stablecoins Matter to Traders
Locking in Profits
Closed a profitable ETH long? Instead of cashing out to fiat, you can convert to a stablecoin and preserve purchasing power until your next entry.
Protection from Volatility
When the market looks overheated or uncertain, stablecoins allow you to “go into cash” without leaving the crypto ecosystem.
Liquidity and Transfer Speed
A traditional bank transfer may take days, while moving USDT or USDC takes minutes — crucial for arbitrage or quick reactions to news.
A Tool for Margin Trading
Many futures platforms use stablecoins as the base currency for settlements, simplifying profit and loss calculations.
Risks and Pitfalls
Regulatory Pressure
Centralized issuers can freeze addresses or restrict operations in response to government requests.
Losing the Peg (Depeg)
If confidence in the issuer or system drops, the stablecoin’s price may deviate from $1. Algorithmic stablecoins are particularly vulnerable.
Centralization
Fiat-backed tokens depend on the issuing company, which controls reserves and redemption processes.
💡 Practical Use with CV_Pro
When trading crypto futures with CV_Pro, stablecoins can serve as a “parking spot” between trades. Closed a profitable position? Move funds into USDT, wait for the next signal, then re-enter. This reduces the impact of volatility and gives you time to make thoughtful entries.
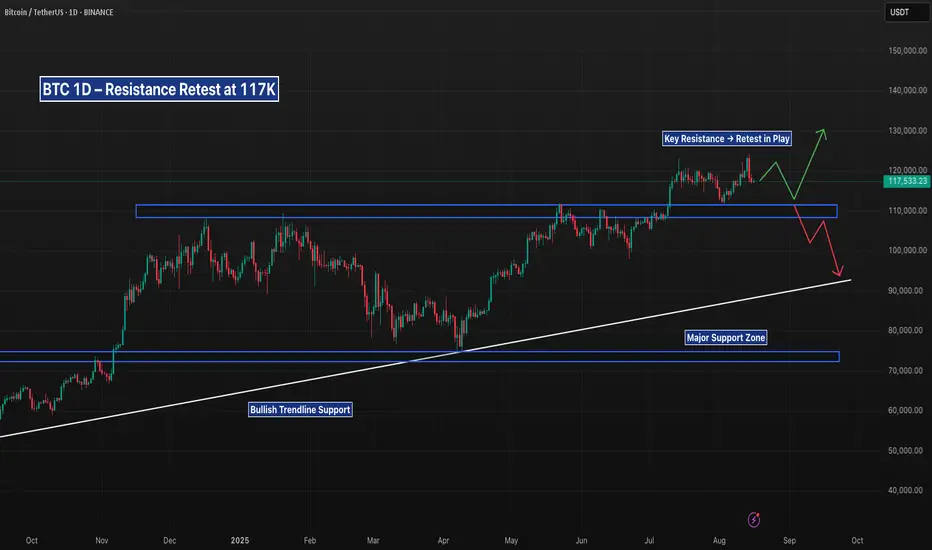
BTC 1D – Resistance Retest at 117K, Will Bulls Hold 112K SupportBitcoin is consolidating after another rejection from the 117K–120K resistance zone. This area previously acted as strong supply and is now being retested. The key level to watch is the 110K–112K support — holding this zone would confirm a higher-low structure and keep the bullish trend intact.
If price fails to hold, the next major support lies near 70K–75K, aligned with the macro demand zone and long-term ascending trendline. A clean break above 120K would likely open momentum toward new highs, but until then, the market remains range-bound between support and resistance.
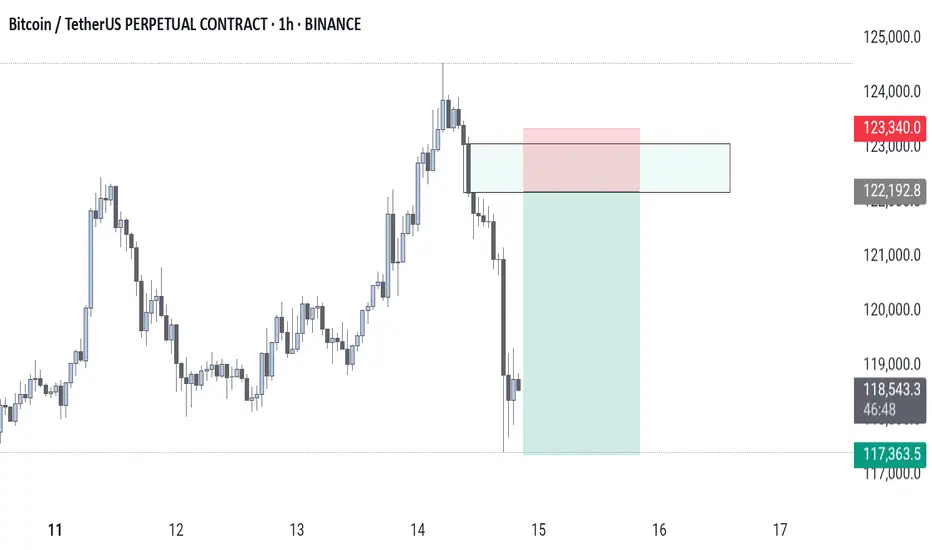
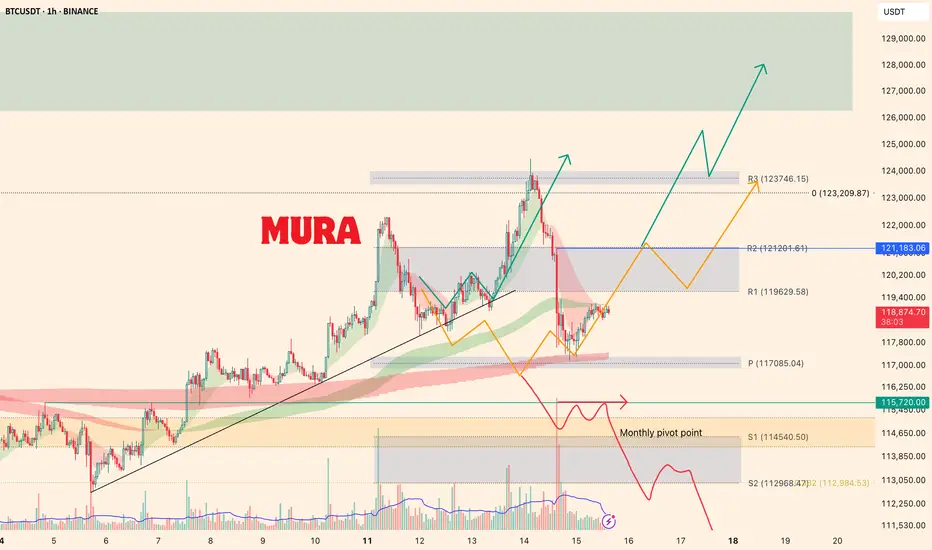
Market update for BitcoinYesterday, BINANCE:BTCUSDT reached our final target at 123,746 , after which a sharp correction began. The price found support at the moving averages and started to bounce.
At the moment, the price is above the weekly pivot point, so I expect the uptrend to continue. The key resistance is at 121,183 — once the price recovers above this level, we could see growth with a new ATH toward our target zone of 126K–130K .
btc buy midterm"🌟 Welcome to Golden Candle! 🌟
We're a team of 📈 passionate traders 📉 who love sharing our 🔍 technical analysis insights 🔎 with the TradingView community. 🌎
Our goal is to provide 💡 valuable perspectives 💡 on market trends and patterns, but 🚫 please note that our analyses are not intended as buy or sell recommendations. 🚫
Instead, they reflect our own 💭 personal attitudes and thoughts. 💭
Follow along and 📚 learn 📚 from our analyses! 📊💡"
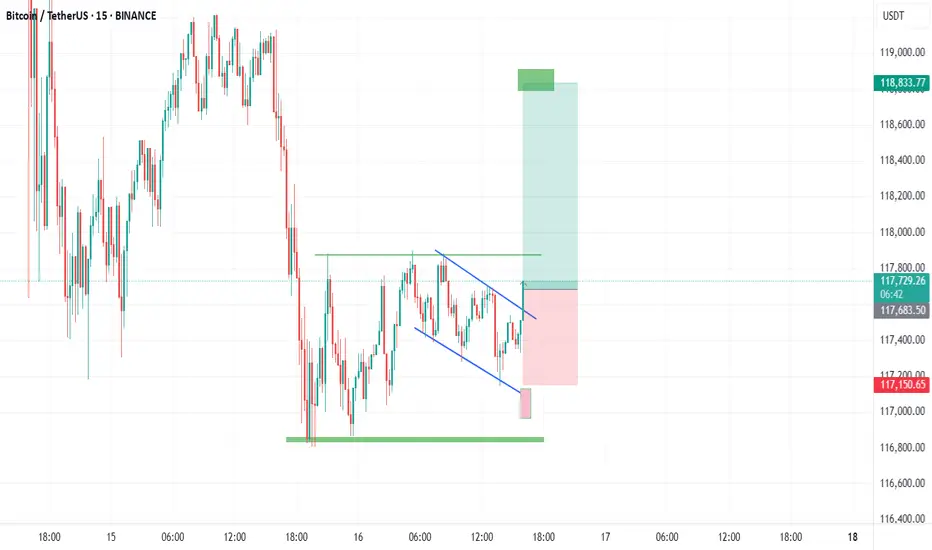
BITCOIN.BITCOIN , On 4hr we found a rejection using our 4hr line chart candle close and took advantage of the sale. The secret is to chart multiple brokers ,brokers candle stick closes are 100% different from line chart perspective while trading any thing in the financial market...(stocks,bonds,crypto,forex)
since we rely on the structure of the market for forward guidance we chart multiple broker for variation in candle closes .
the price action is watched in Realtime for a close into another structural buy zone .the current break out could retest 116k-117k and set up a buy wave based on the principles of break and retest.
the goal is to see if we break and sustain above 123k and look at 124k and 130k ascending trendline acting as dynamic supply roof and resistance to upswing which the current all-time high is a victim of the top layer supply roof .
united state economic data report will give a clear direction and signal into next FOMC OUTLOOK.
THE CPI measures the Change in the price of goods and services purchased by consumers, excluding food and energy
Core CPI m/m forecast 0.3% previous 0.2%
CPI m/m forecast 0.2% previous 0.3%
CPI y/y forecast 2.8% previous 2.7%
FOMC Member Barkin Speaks
14th
the core PPI m/m measures the Change in the price of finished goods and services sold by producers, excluding food and energy
Core PPI m/m forecast 0.2% previous 0.0%
PPI m/m forecast 0.2% previous 0.0%
Unemployment Claims forecast 225K previous 226.
this DATA will affect the 10 year treasury bond yield and dollar index as the signal will be watched by FEDS.
TRADING IS 100% PROBABILTY
LOWER YOUR EXPECTATION
RISK TO REWARD RATIO SHOULD BE IN YOUR CHECKLIST AND TRADE REASON.
ANY GOOD TRADE CAN TURN TO A BAD TRADE.
A TRADER WITHOUT LIQUIDITY IS A DEMO TRADER
A HUNTER GUN WITHOUT BULLET IS A TOY GUN.(HUNTERS MINDSET)
PROTECT YOUR CAPITAL.
GOOD LUCK
#BTC #BITCOIN

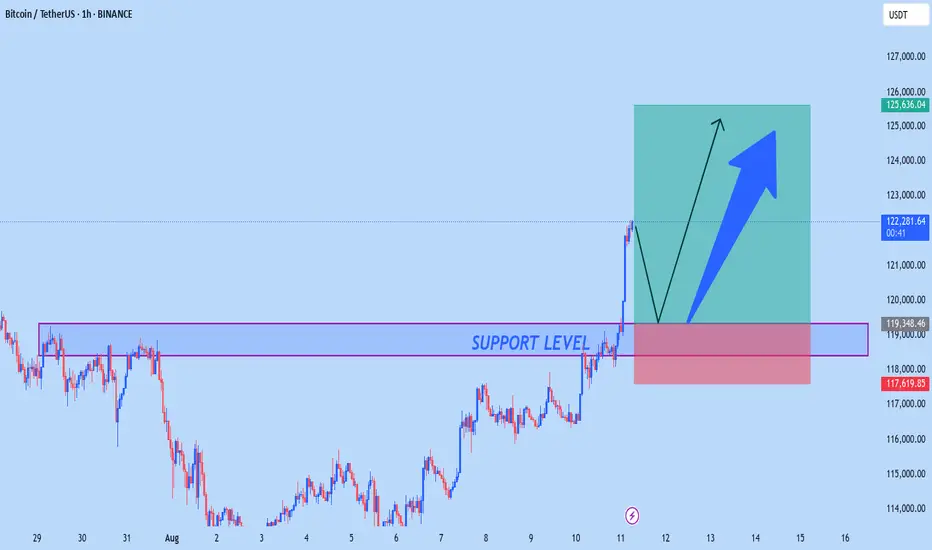
BTC 4H – Ascending Support RetestBTC is pulling back toward ascending support, with price action suggesting a potential bounce zone just above $116K. A hold here could send price back toward recent highs, while a break below would shift focus to deeper support. Structure remains bullish while holding the trendline.
Bitcoin held steady at $117k ┆ HolderStatBINANCE:BTCUSDT recovered after a stop-hunt below recent lows, with momentum now aiming toward $125,000+. Holding above $114,500 is key for bullish continuation.
BITCOIN BITCOIN COMPLETE ANALYSIS as shared yesterday ,and i was correct on the price movement.
the price could keep this path for bullish continuation or breakout and turn it to sell.
breakeven and protect your profit.
trading is 100% probability and education
manage your risk
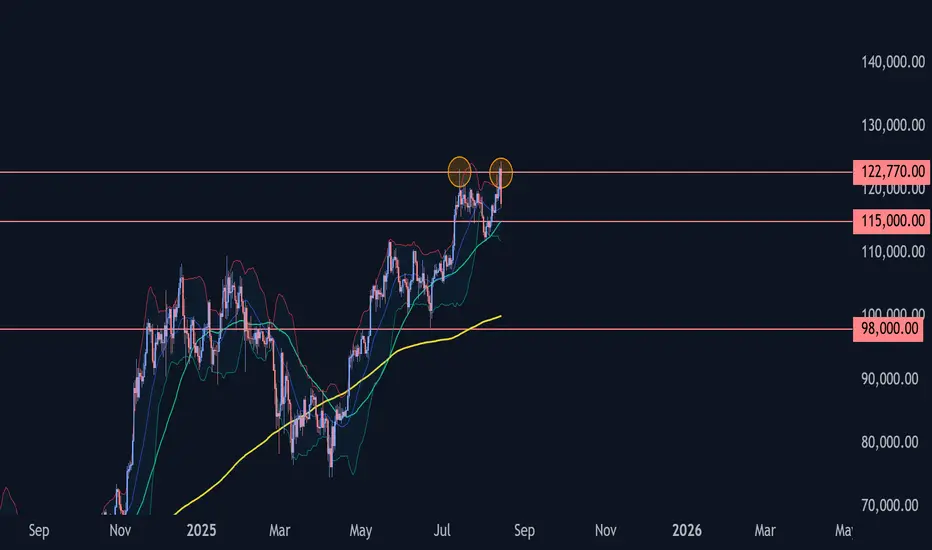
Bitcoin Wave Analysis – 14 August 2025
- Bitcoin reversed from the strong resistance 122770.00
- Likely to fall to support level 115000.00
Bitcoin today recently reversed down with the Bearish Engulfing from the strong resistance level 122770.00 (which stopped the previous minor impulse wave 1 at the start of July).
The resistance zone near the resistance level of 122770.00 was strengthened by the upper daily Bollinger Band.
Given the strength of the resistance level 122770.00 and the overbought daily Stochastic, Bitcoin can be expected to fall to the next support level 115000.00.