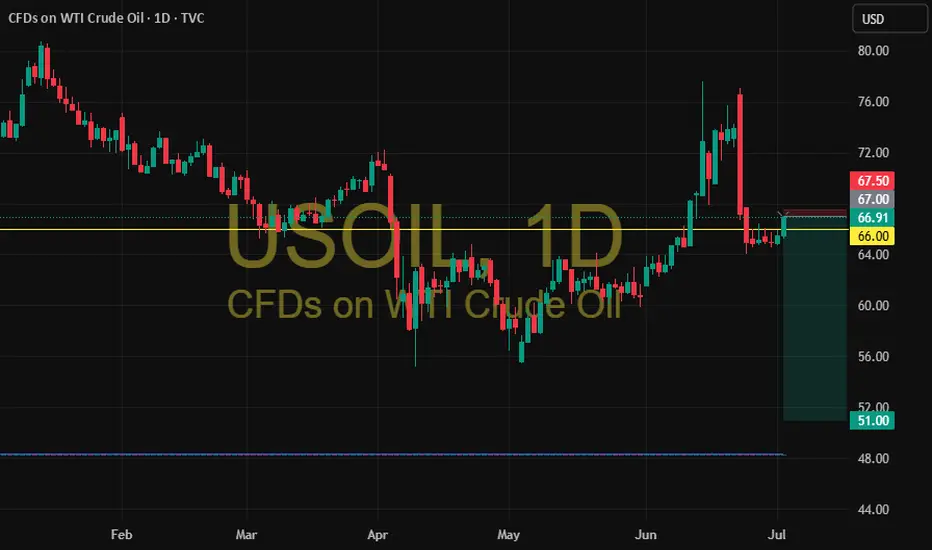
USOIL:Today's Trading Strategy
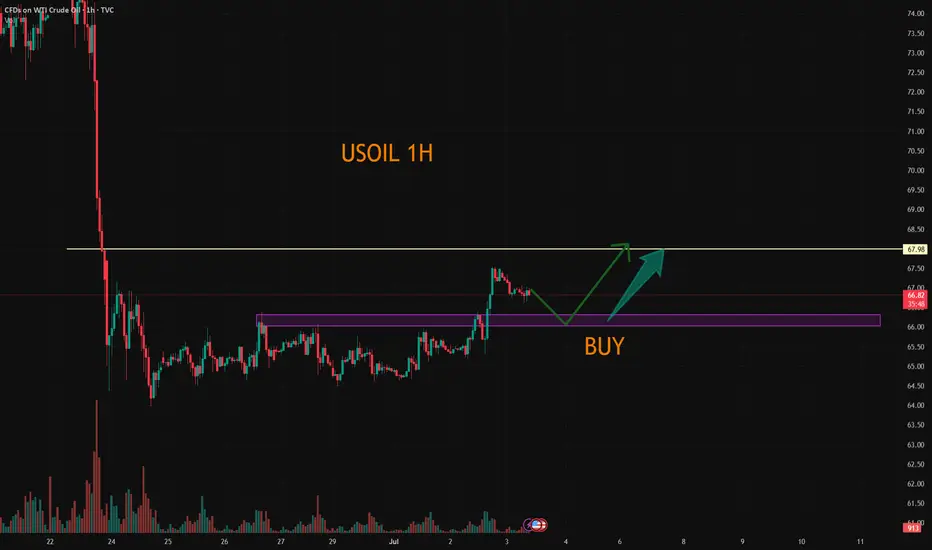
Oil prices have signs of upward breakthrough at present, yesterday's trend broke the short - term narrow range of shock range, on the idea of retracting to do more. The more appropriate long point is 66-66.3, if short, the more appropriate point is 67-67.4, but the short position is recommended not to be too heavy, not to do less than the point.
Trading Strategy:
SELL@67-67.4
TP: 66-66.3
BUY@66-66.3
TP: 67.5-68
More detailed strategies and trading will be notified here ↗↗↗
Keep updated, come to "get" ↗↗↗
USDWTI trade ideas
Market next move ❗ Disrupted Market Outlook:
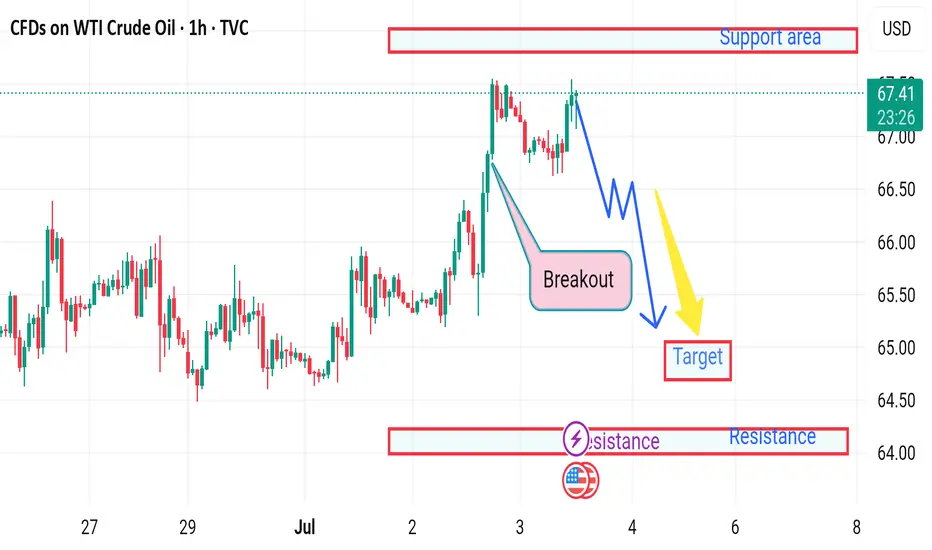
⚠️ False Breakout Risk:
The recent "Breakout" above previous highs may be a bull trap. Although price surged, the follow-up candles are showing lower highs, suggesting weakening bullish momentum.
📉 Bearish Divergence (not shown but likely):
Based on the price action, there's a potential bearish divergence with RSI/MACD (if overlaid), as price makes higher highs while momentum likely weakens.
🔄 Resistance Reversal Zone:
The area labeled as "Support area" at the top (near $67.50) is actually acting as resistance again — the market is failing to hold above this level.
🔁 Retest Failure:
After the breakout, price failed to establish strong support and is consolidating below the highs, hinting at a potential breakdown below $66.
---
🔻 Disruption Path:
1. Drop to $66.00 - immediate pullback from failed breakout.
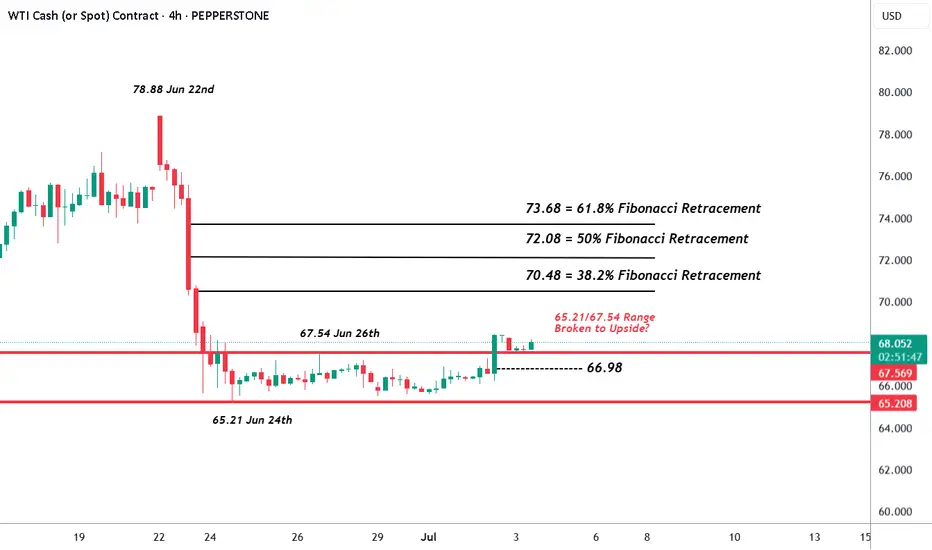
Oil (WTI) – Preparing for Potential Fresh VolatilityThe price of Oil (WTI) fell dramatically last week, from a high of 78.88 on Monday June 23rd to a low of 65.21 on Tuesday June 24th, as a ceasefire was first agreed and then held between Israel and Iran. This shifted the focus for traders back to US trade talks and looming tariffs, the direction of US economic growth and the potential for another OPEC+ production increase. Although, it must be said that nervousness about the sustainability of the ceasefire is still drawing the focus of traders this week and may continue to do so.
In terms of trade, Oil prices jumped higher yesterday as a trade deal between the US and Vietnam was announced, but the question remains, could this rally be short lived?
President Trump stated on Tuesday that he doesn’t expect to delay his July 9th tariff deadline, which could see higher import penalties reimposed on key trading partners, such as Japan and the EU. While it seems that traders may still be unsure whether he really means this, any potential impact on Oil prices could increase the closer we move to the deadline.
Today’s data releases could provide some key insights into the health of the US economy, with Non-farm payrolls released at 1330 BST and the US ISM Services PMI due at 1500 BST. Traders expect jobs growth to continue to moderate, so any bigger downside surprises could increase Oil price volatility, and the direction of service activity (bars, restaurants etc), the main driver of US growth for many months, may also be crucial for sentiment. Traders may be watching for whether there has been any major deterioration in this services PMI reading, back towards, or below 50, which is the dividing line between economic contraction and expansion.
Then, Sunday’s (July 6th) OPEC+ meeting, where the group is expected to agree to an August supply increase for a fourth month in a row, moves into focus. Depending on this OPEC+ decision and any tariff or geo-political developments over the weekend, Oil prices could potentially open up at very different levels on Monday morning.
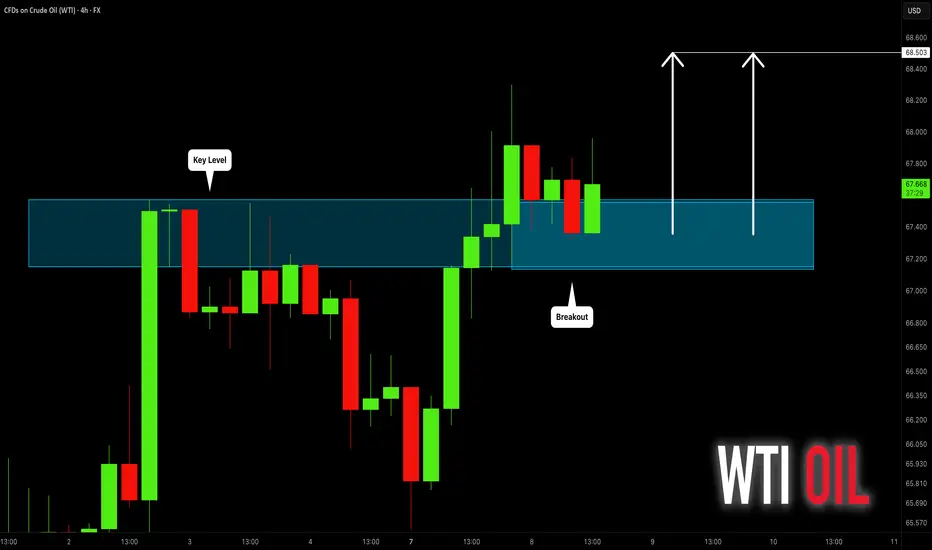
Technical Update: Breaking Higher From Range?
Following the aggressive sell-off in the price of Oil from the 78.88 June 22nd high into the 65.21 June 24th low, a period of stability materialised as traders assessed the developing geo-political backdrop.
This saw price activity held by support offered by the 65.21 price low and resistance by the 67.54 June 26th high. However, as the 4 hourly chart above shows, the latest activity has now seen prices move out of this range, with a closing break above the previous 67.54 high.
While a break higher from such a sideways range in price is not a guarantee of continued upside, traders may now be viewing this type of activity as reflecting potential for a more extended phase of price strength.
Next Possible Resistance Levels.
If further price strength is to emerge, it might now suggest possibilities to test the 70.48 level, which is equal to the 38.2% Fibonacci retracement of the June 22nd to June 24th decline.
Closing breaks above this resistance may then lead to further attempts at price strength towards 72.08, which is the higher 50% retracement level.
Next Possible Support Levels
While some traders might view a move back into the old sideways price range, which would be represented by closes back under the 67.54 recent high, as marking the possibility of increasing downside pressure again, it might in fact be breaks under the 66.98 level, which is equal to half latest strength, that indicates the potential of further price declines.
Such downside closing breaks may well suggest potential to retest the 65.21 June 24th low trade, possibly further if this in turn gives way.
The material provided here has not been prepared accordance with legal requirements designed to promote the independence of investment research and as such is considered to be a marketing communication. Whilst it is not subject to any prohibition on dealing ahead of the dissemination of investment research, we will not seek to take any advantage before providing it to our clients.
Pepperstone doesn’t represent that the material provided here is accurate, current or complete, and therefore shouldn’t be relied upon as such. The information, whether from a third party or not, isn’t to be considered as a recommendation; or an offer to buy or sell; or the solicitation of an offer to buy or sell any security, financial product or instrument; or to participate in any particular trading strategy. It does not take into account readers’ financial situation or investment objectives. We advise any readers of this content to seek their own advice. Without the approval of Pepperstone, reproduction or redistribution of this information isn’t permitted.
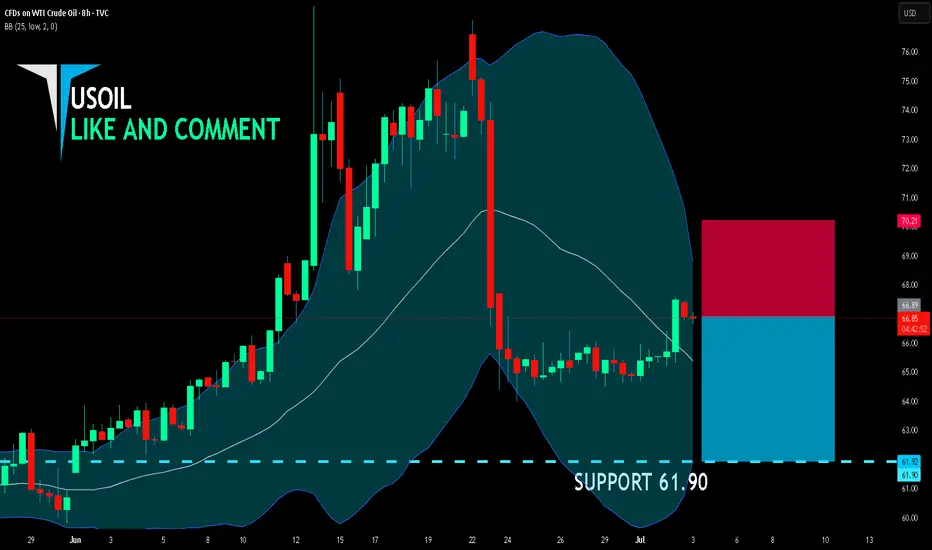
USOIL BEARS ARE GAINING STRENGTH|SHORT
USOIL SIGNAL
Trade Direction: short
Entry Level: 66.89
Target Level: 61.90
Stop Loss: 70.21
RISK PROFILE
Risk level: medium
Suggested risk: 1%
Timeframe: 8h
Disclosure: I am part of Trade Nation's Influencer program and receive a monthly fee for using their TradingView charts in my analysis.
✅LIKE AND COMMENT MY IDEAS✅
WTI CRUDE OIL (USOIL): More Growth Ahead
Crude Oil broke and closed above a significant resistance.
The price is now retesting that.
I think that the market is going to rise.
Next resistance - 68.5
❤️Please, support my work with like, thank you!❤️
CRUDE OIL (#WTI): Consolidation is Over
📈Crude Oil was consolidating for 6 trading days in a row
after a test of a key daily support.
The yesterday's Crude Oil Inventories data made the market bullish
and the price successfully violated a minor resistance of a sideways movement.
We can expect that the market will grow more.
Next resistance - 69.27
—————————
Daily time frame
—————————
WTI USOIL WTI oil Prices are supported by supply cuts and production adjustments but tempered by inventory levels and economic concerns.
The market remains sensitive to geopolitical developments, OPEC+ policies, and US economic data.
#oil
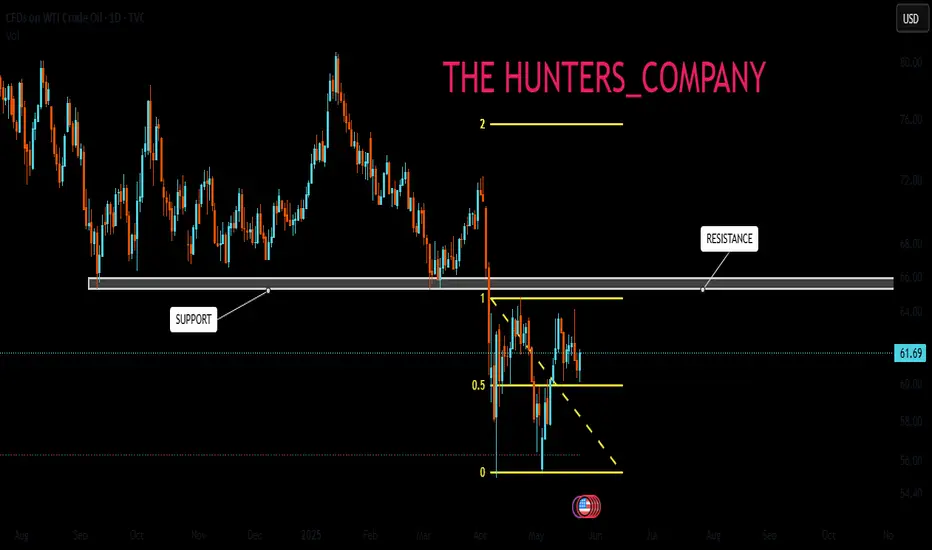
USOIL : What will happen to the price of oil?Hello friends
As you can see, we had support in the past, which has now become a strong resistance for the price after it was broken.
Now we need to see if the price will manage to break it at this moment when it is close to its key and sensitive resistance.
*Trade safely with us*
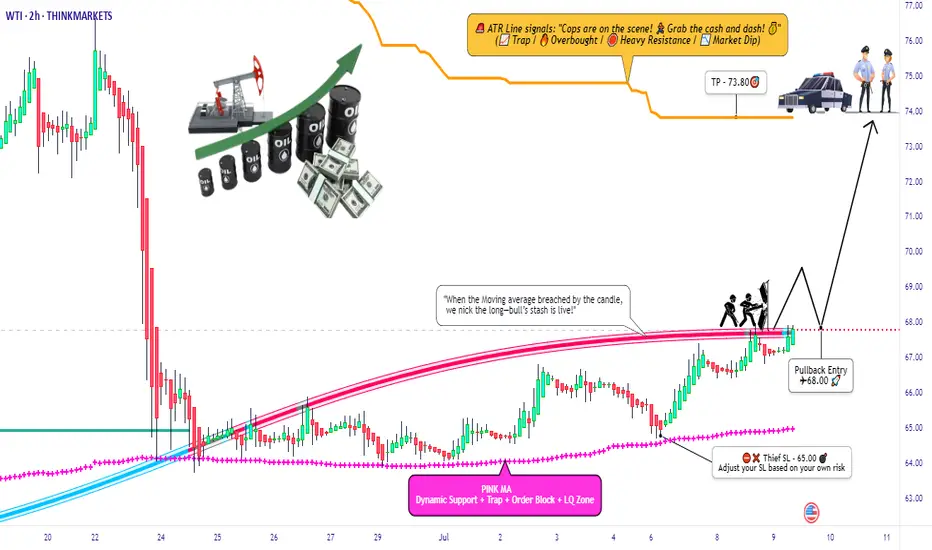
WTI Oil Heist: Bullish Breakout Plan for Big Gains!🚨 Ultimate WTI Oil Heist Plan: Bullish Breakout Strategy for Big Profits! 🚀💰
🌟 Hello, Wealth Chasers & Market Mavericks! 🌟
Hola, Bonjour, Hallo, Marhaba! 🗺️
Get ready to execute the Ultimate WTI / US Oil Spot Heist using our 🔥 Thief Trading Style 🔥, blending sharp technicals with powerful fundamentals! 📈💡 This swing trade plan targets the energy market’s bullish potential, but stay sharp—volatility lurks! 🚨 Follow the chart setup for a long entry, and let’s aim for those juicy profits while dodging the high-risk ATR zone where the market “police” might trap overzealous traders. 🏦⚠️
📊 The Heist Plan: WTI / US Oil Spot (Swing Trade)
Entry 📈:
The breakout is your signal! 🎯 Wait for the Moving Average crossover and a confirmed pullback at $68.00 on the 2H timeframe. Once it triggers, go long and ride the bullish wave! 🐂 Set an alert to catch the breakout in real-time. 🚨
Stop Loss 🛑:
Protect your capital like a pro! 💪 Place your stop loss below the recent swing low at $65.00 (2H timeframe, candle body wick). Adjust based on your risk tolerance, lot size, and number of positions. Rebels, beware—straying too far from this level could burn you! 🔥
Target 🎯:
Aim for $73.80 or exit early if momentum fades. Scalpers, stick to long-side trades and use a trailing stop to lock in gains. 💰 Swing traders, follow the plan and secure profits before the market consolidates or reverses. 🏴☠️
📊 Market Context & Key Drivers
The WTI / US Oil Spot market is currently consolidating with a bullish bias 🐂, driven by:
Fundamentals: Check macroeconomic data, seasonal trends, and intermarket correlations. 📉
COT Report: shows net-long positions increasing, signaling bullish sentiment. 📅
Sentiment & Quantitative Analysis: Market mood leans positive, but overbought risks loom near the ATR zone. ⚠️
Stay informed! 📰 Monitor news releases, as they can spike volatility. Avoid new trades during major announcements and use trailing stops to protect open positions. 🔒
📊 Pro Tips for the Heist
Scalpers: Go long with tight trailing stops to safeguard profits. 💸
Swing Traders: Stick to the plan, adjust stops based on risk, and exit before the high-risk ATR zone ($73.80+). 🚪
Risk Management: Never risk more than you can afford. Tailor your lot size and stop loss to your account size. 🛡️
Stay Updated: Market conditions shift fast—keep an eye on fundamentals and sentiment to stay ahead. 👀
📊 Why Join the Heist?
This Thief Trading Style plan is your ticket to navigating the WTI market with confidence! 💪 Boost this idea to strengthen our trading crew and share the wealth-making vibe. 🚀💥 Like, follow, and stay tuned for more high-octane strategies! 🤑🐱👤
Disclaimer: This is a general market analysis, not personalized investment advice. Always conduct your own research and consider your risk tolerance before trading. Markets are dynamic—stay vigilant and adapt to new developments. 📡
Let’s make this heist legendary! 🌟💰 See you at the next breakout! 🤝🎉
Sudden Oil Spike - what you need to know!Iran suspended cooperation with the U.N. nuclear watchdog, amid a surprise build in US crude inventories.
Iran’s move added a modest risk premium to prices, though analysts noted that no actual supply disruptions have occurred.
$66 is a key level for WTI crude to hold above.
If it can maintain this area, we will likely see higher price. $66 is a multi year trendline of support going back to 2021.
Energy stocks / XLE basket is showing some bullish divergence, perhaps indicating this oil move has legs.

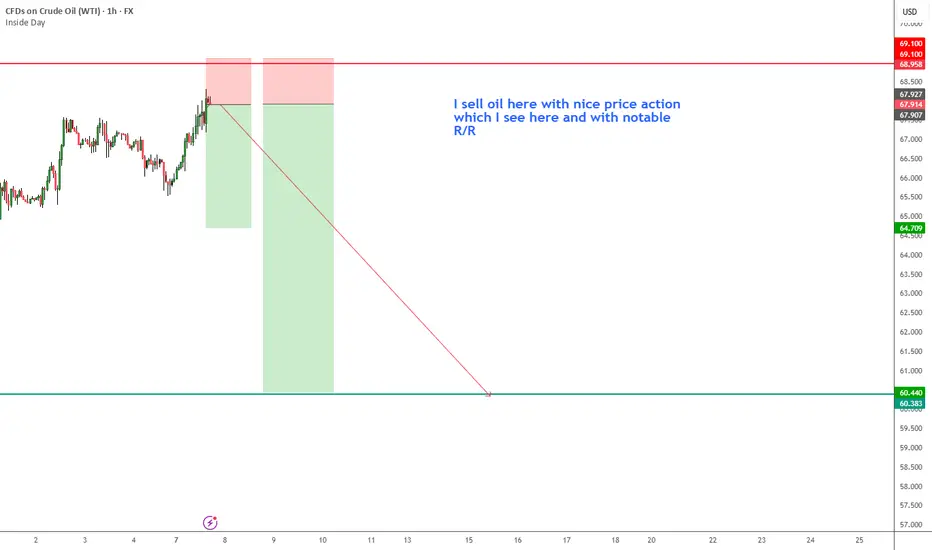
Sell oil here after decrearse tension in middle east I Can see notable price action for going to sell on oil
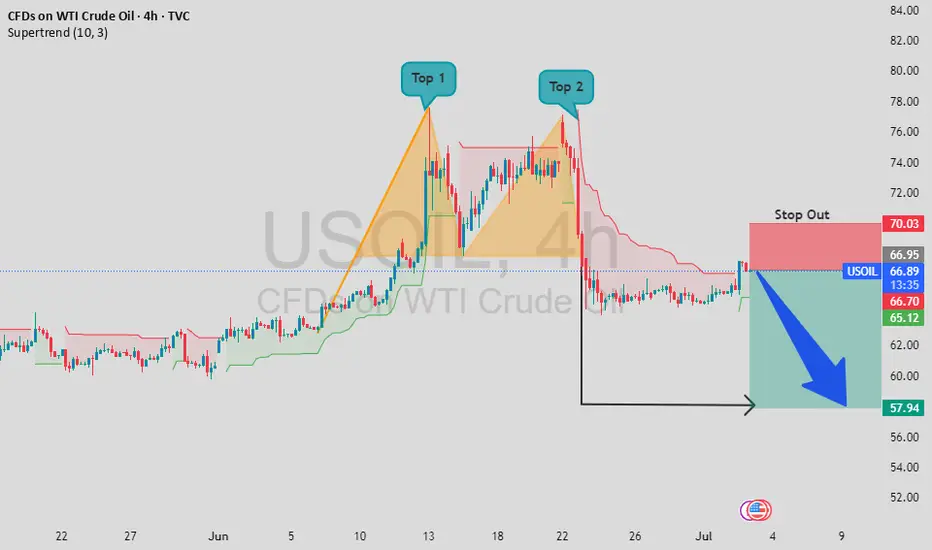
USOIL Double Top Breakdown | Short Setup Alert!USOIL Double Top Breakdown | Short Setup Alert!
Hey traders! A classic Double Top pattern has formed on the 4H USOIL chart (Top 1 & Top 2), signaling a potential trend reversal. After breaking the neckline, price action confirms bearish momentum. The stop-out level is clearly marked at 70.00 , while the target zone is set around 58.00. This setup offers a great risk-reward ratio.
📍 Supertrend also aligns with bearish confirmation.
💬 Drop your thoughts in the comments section – let's discuss the trade!
❤️ If you find this helpful, don’t forget to support with a like and follow!
Stay sharp and trade safe!
Classic Bear Flag on Oil 🚩 Classic Bear Flag on Oil 🛢
A textbook bear flag has formed on the oil chart:
📏 Flagpole: From $77 down to $64 – a move of 13 points
📉 If price breaks below the lower support of the flag:
🎯 Target = $64 − $13 = $51
⚠️ This sets a bearish target at $51,
assuming momentum continues and there's no invalidation.
usoil 67
sl 67.5
tp1 66
tp2 65.5
tp3 65
tp4 64.5
tp5 open
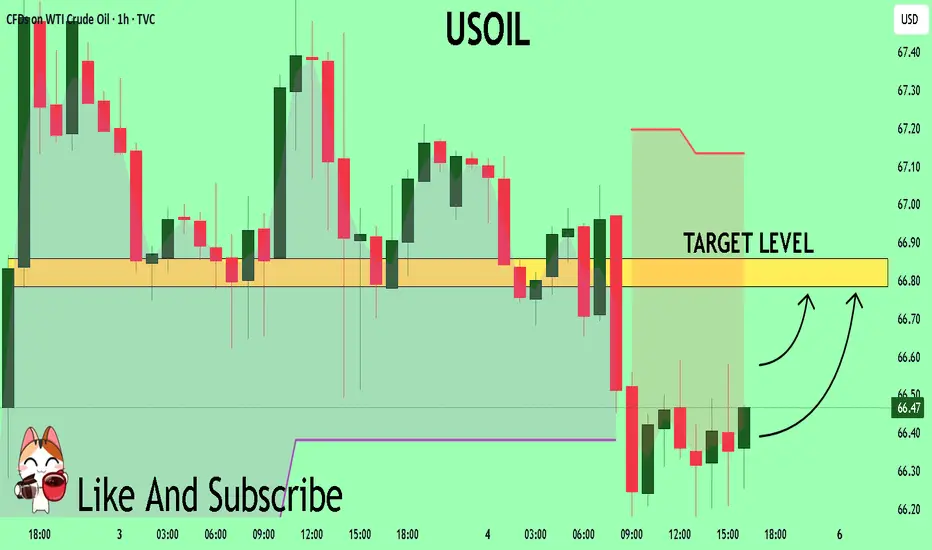
USOIL Set To Grow! BUY!
My dear friends,
USOIL looks like it will make a good move, and here are the details:
The market is trading on 66.47 pivot level.
Bias - Bullish
Technical Indicators: Supper Trend generates a clear (short / long) signal while Pivot Point HL is currently determining the overall Bullish trend of the market.
Goal - 66.79
About Used Indicators:
Pivot points are a great way to identify areas of support and resistance, but they work best when combined with other kinds of technical analysis
Disclosure: I am part of Trade Nation's Influencer program and receive a monthly fee for using their TradingView charts in my analysis.
———————————
WISH YOU ALL LUCK
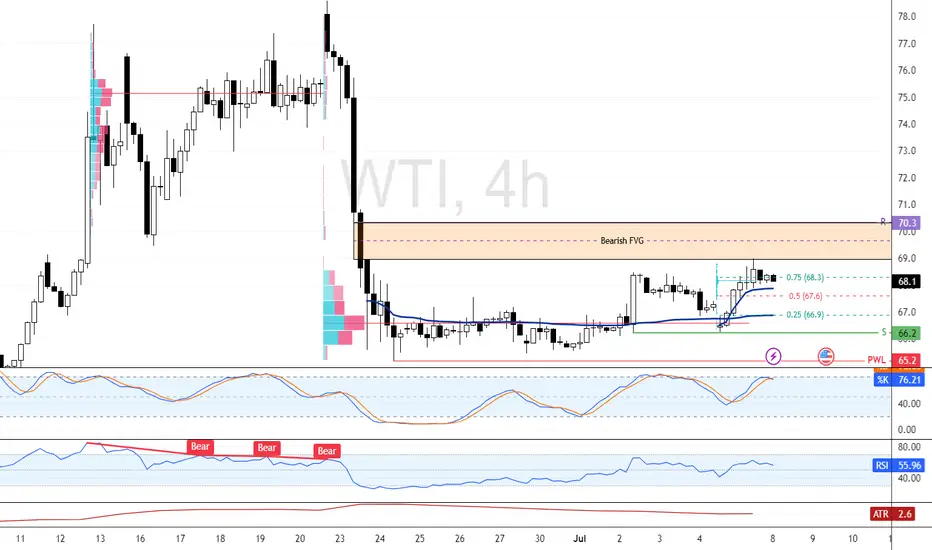
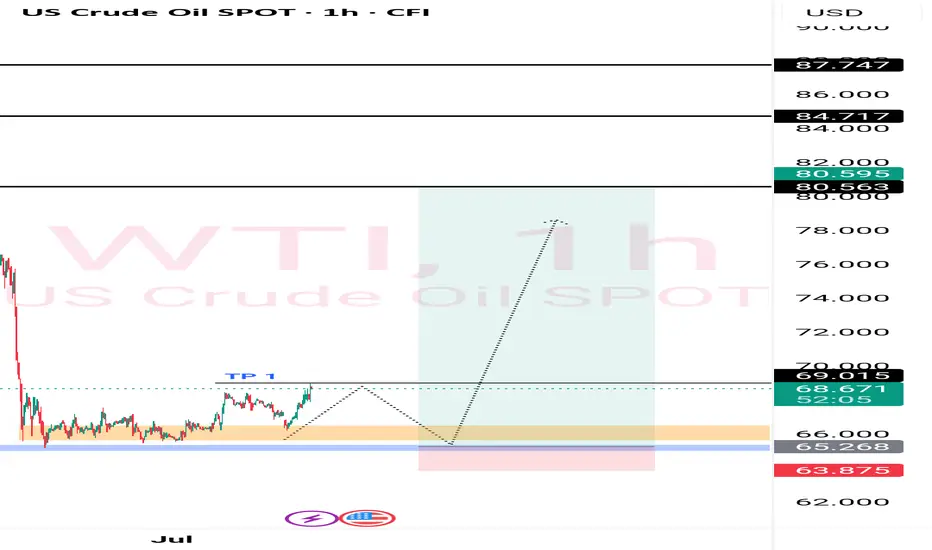
Momentum Cools as Oil Eyes Reentry From $67.6FenzoFx—Crude Oil bounced from $66.2, a support backed by the volume profile point of interest, but lost momentum after hitting the bearish FVG.
Currently trading near $68.2 with Stochastic overbought. A pullback to $67.6 can offer a low-risk reentry. The bullish bias remains intact above $65.2, with $70.3 as the next target.
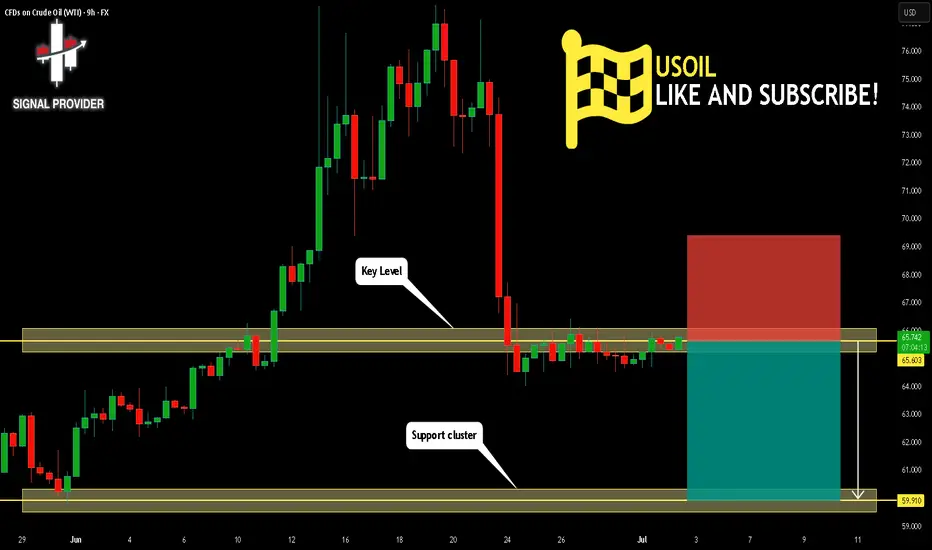
USOIL Will Fall! Sell!
Take a look at our analysis for USOIL.
Time Frame: 9h
Current Trend: Bearish
Sentiment: Overbought (based on 7-period RSI)
Forecast: Bearish
The market is testing a major horizontal structure 65.603.
Taking into consideration the structure & trend analysis, I believe that the market will reach 59.910 level soon.
P.S
The term oversold refers to a condition where an asset has traded lower in price and has the potential for a price bounce.
Overbought refers to market scenarios where the instrument is traded considerably higher than its fair value. Overvaluation is caused by market sentiments when there is positive news.
Disclosure: I am part of Trade Nation's Influencer program and receive a monthly fee for using their TradingView charts in my analysis.
Like and subscribe and comment my ideas if you enjoy them!
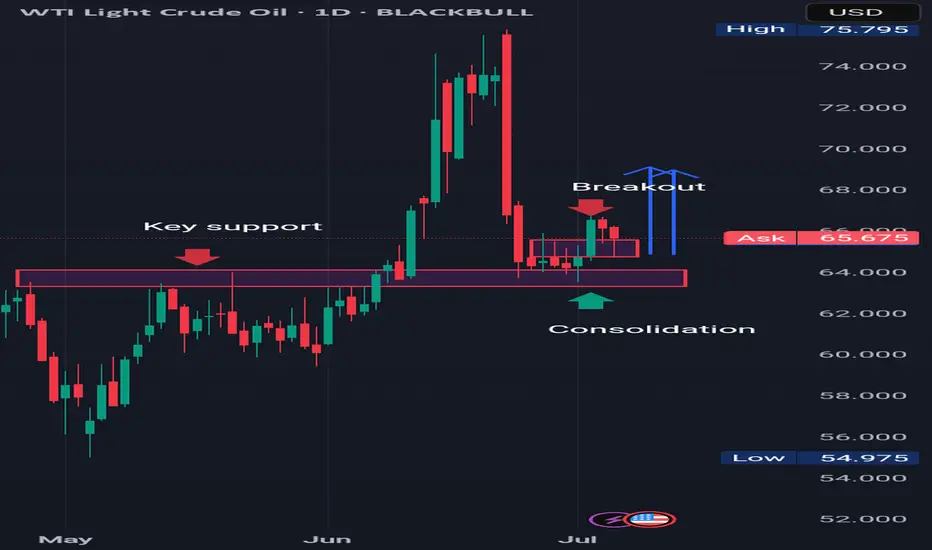
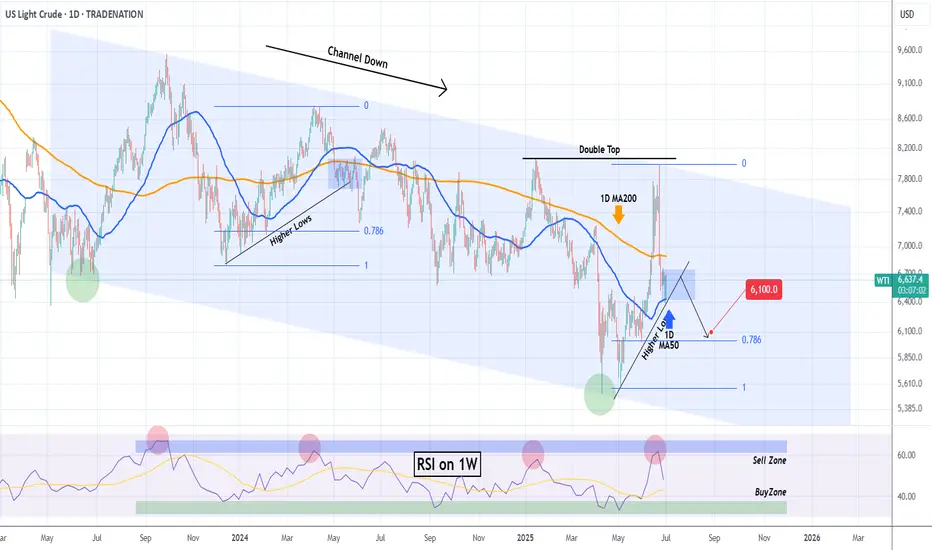
WTI OIL This is the only Support right now.WTI Crude Oil (USOIL) is so far holding its 1D MA50 (blue trend-line), the natural medium-term Support, following a quick price deflation after the Israel - Iran de-escalation.
In our opinion, the trend-line that currently matters most though, is the Higher Lows coming straight from the May 05 Low. If broken, we expect a quick test of the 0.786 Fibonacci retracement level, as it resembles the December 2023 - May 2024 Higher Lows trend-line.
Even the 1W RSI is similar among the two fractals, and it has to be said that both are part of the 2-year Channel Down pattern.
So if the Higher Lows trend-line breaks, we can target $61.00.
-------------------------------------------------------------------------------
** Please LIKE 👍, FOLLOW ✅, SHARE 🙌 and COMMENT ✍ if you enjoy this idea! Also share your ideas and charts in the comments section below! This is best way to keep it relevant, support us, keep the content here free and allow the idea to reach as many people as possible. **
-------------------------------------------------------------------------------
Disclosure: I am part of Trade Nation's Influencer program and receive a monthly fee for using their TradingView charts in my analysis.
💸💸💸💸💸💸
👇 👇 👇 👇 👇 👇
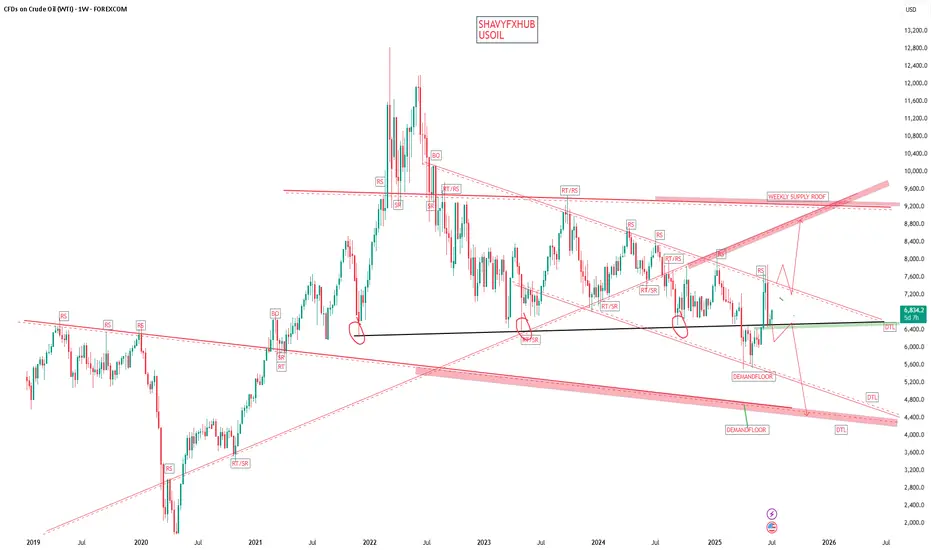
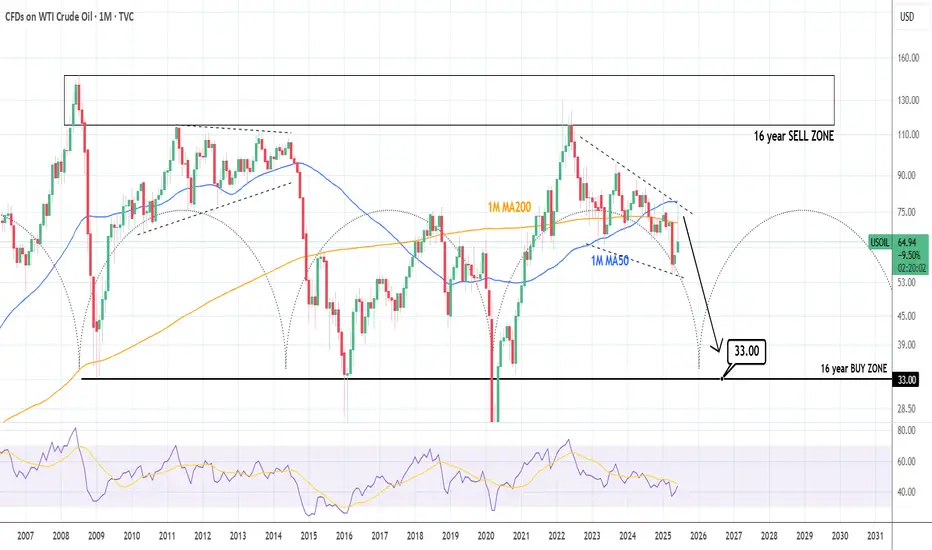
WTI CRUDE OIL: Brutal collapse expectedWTI Crude Oil has turned bearish again on its 1D technical outlook (RSI = 44.990, MACD = 0.310, ADX = 38.289) and is expected to accelerate the effect as based on the 16 year Cycles, late 2025 and most of 2026 should experience a price collapse. The most optimal Buy Zone starts at $33.00, it could go lower but that's a solid base from which to expect a bounce back above $110.00 by 2028.
## If you like our free content follow our profile to get more daily ideas. ##
## Comments and likes are greatly appreciated. ##
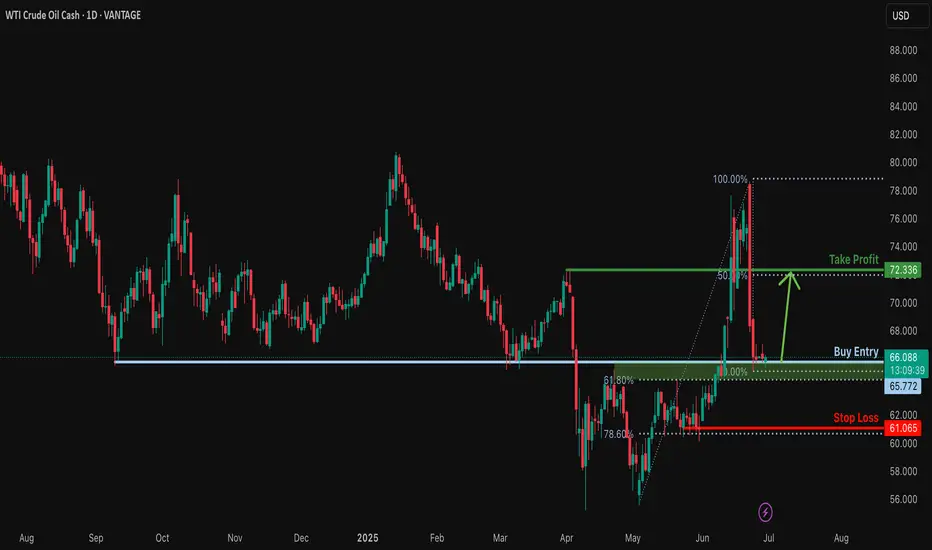
Could the Crude Oil reverse from here?The price is falling towards the support level which is a pullback support that is slightly above the 61.8% Fibonacci retracement and could bounce from this level to our take profit.
Entry: 66.77
Why we like it:
There is a pullback support level that is slightly above the 61.8% Fibonacci retracement.
Stop loss: 61.06
Why we like it:
There is a pullback support level that aligns with the 78.6% Fibonacci retracement.
Take profit: 72.33
Why we like it:
There a pullback resistance level that lines up with the 50% Fibonacci retracement.
Enjoying your TradingView experience? Review us!
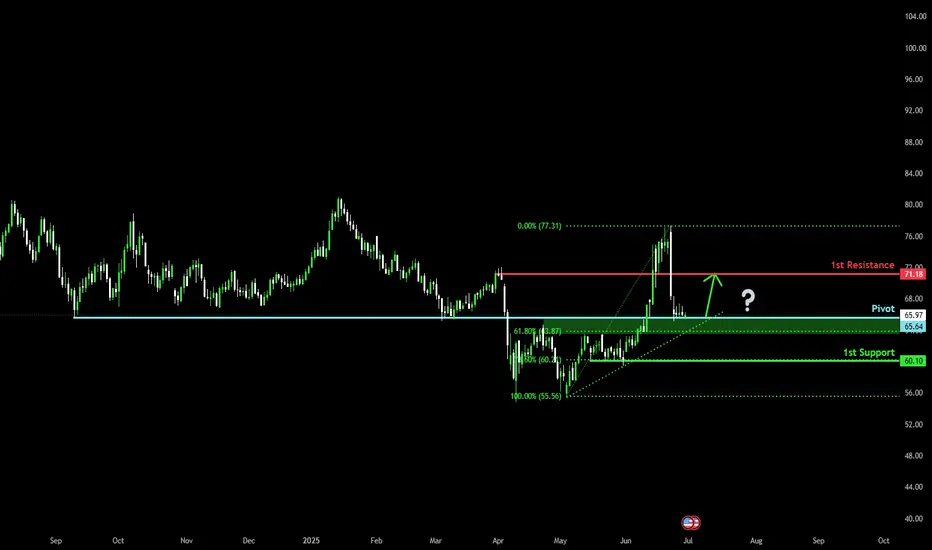
Major support zone?XTI/USD is falling towards the pivot and could bounce to the 1st resistance.
Pivot: 65.64
1st Support: 60.10
1st Resistance: 71.18
Risk Warning:
Trading Forex and CFDs carries a high level of risk to your capital and you should only trade with money you can afford to lose. Trading Forex and CFDs may not be suitable for all investors, so please ensure that you fully understand the risks involved and seek independent advice if necessary.
Disclaimer:
The above opinions given constitute general market commentary, and do not constitute the opinion or advice of IC Markets or any form of personal or investment advice.
Any opinions, news, research, analyses, prices, other information, or links to third-party sites contained on this website are provided on an "as-is" basis, are intended only to be informative, is not an advice nor a recommendation, nor research, or a record of our trading prices, or an offer of, or solicitation for a transaction in any financial instrument and thus should not be treated as such. The information provided does not involve any specific investment objectives, financial situation and needs of any specific person who may receive it. Please be aware, that past performance is not a reliable indicator of future performance and/or results. Past Performance or Forward-looking scenarios based upon the reasonable beliefs of the third-party provider are not a guarantee of future performance. Actual results may differ materially from those anticipated in forward-looking or past performance statements. IC Markets makes no representation or warranty and assumes no liability as to the accuracy or completeness of the information provided, nor any loss arising from any investment based on a recommendation, forecast or any information supplied by any third-party.
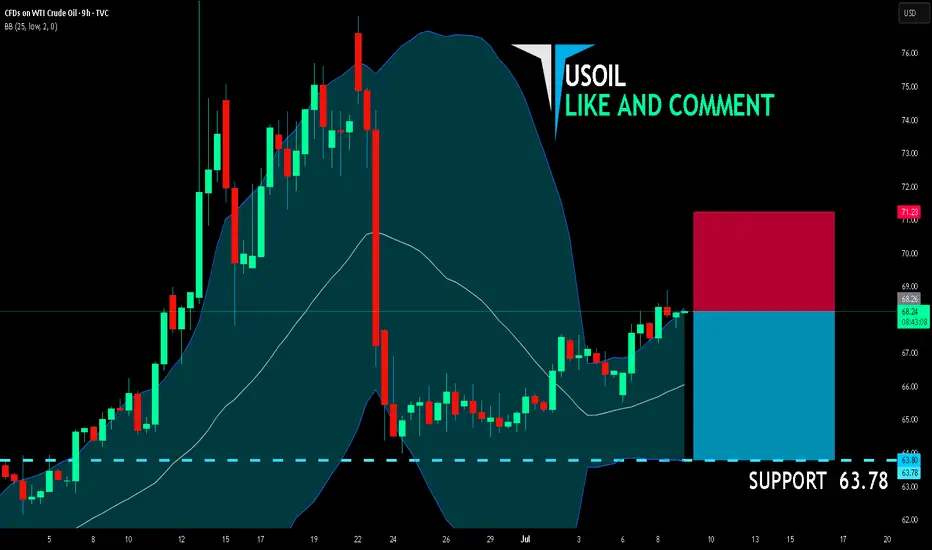
USOIL BEST PLACE TO SELL FROM|SHORT
USOIL SIGNAL
Trade Direction: short
Entry Level: 68.26
Target Level: 63.78
Stop Loss: 71.23
RISK PROFILE
Risk level: medium
Suggested risk: 1%
Timeframe: 9h
Disclosure: I am part of Trade Nation's Influencer program and receive a monthly fee for using their TradingView charts in my analysis.
✅LIKE AND COMMENT MY IDEAS✅
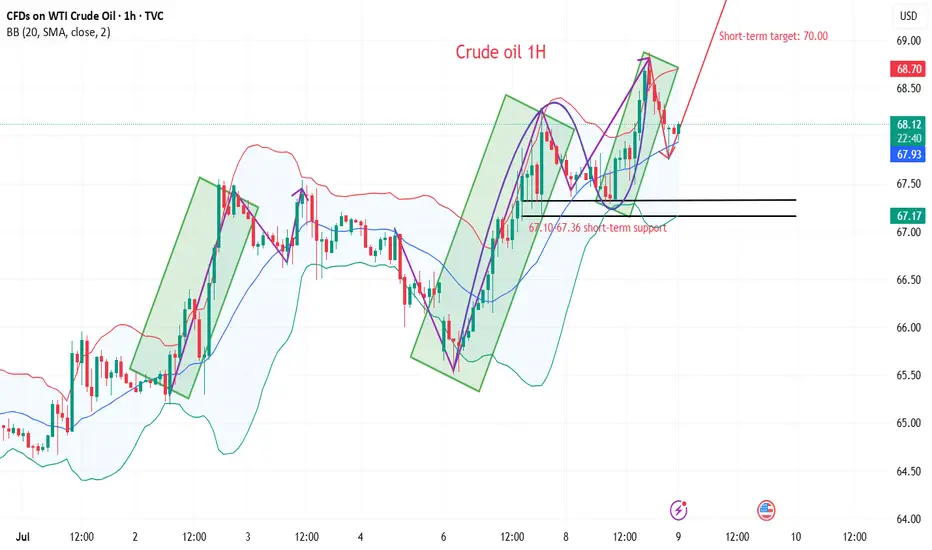
Crude oil shock trend direction
💡Message Strategy
During the European trading session on Monday, the West Texas Intermediate (WTI) crude oil futures on the New York Mercantile Exchange recovered the previous losses and rebounded to around $67.50 per barrel. Although OPEC+ confirmed that the increase in oil production in August will be higher than expected, oil prices still rebounded.
From the daily chart level, the medium-term trend of crude oil fluctuated upward and tested around 78. The K-line closed with a large real negative line, which has not yet destroyed the moving average system and is still supported. The medium-term objective upward trend remains unchanged. However, from the perspective of momentum, the MACD indicator crosses downward above the zero axis, indicating that the bullish momentum is weakening. It is expected that the medium-term trend of crude oil will fall into a high-level oscillating upward pattern.
📊Technical aspects
The short-term (1H) trend of crude oil failed to continue to hit a new low and showed a rebound rhythm. The oil price crossed the moving average system, and the short-term objective trend entered a transition period. From the perspective of momentum, the MACD indicator crossed the zero axis, and the red column indicated that the bullish momentum was sufficient. At present, the price is running in a wide range, with a range of 65.50-67.80. It is expected that the trend of crude oil will repeatedly test the upper edge of the range within the range.
💰Strategy Package
Long Position:67.00-67.50,SL:65.50,Target:70.00