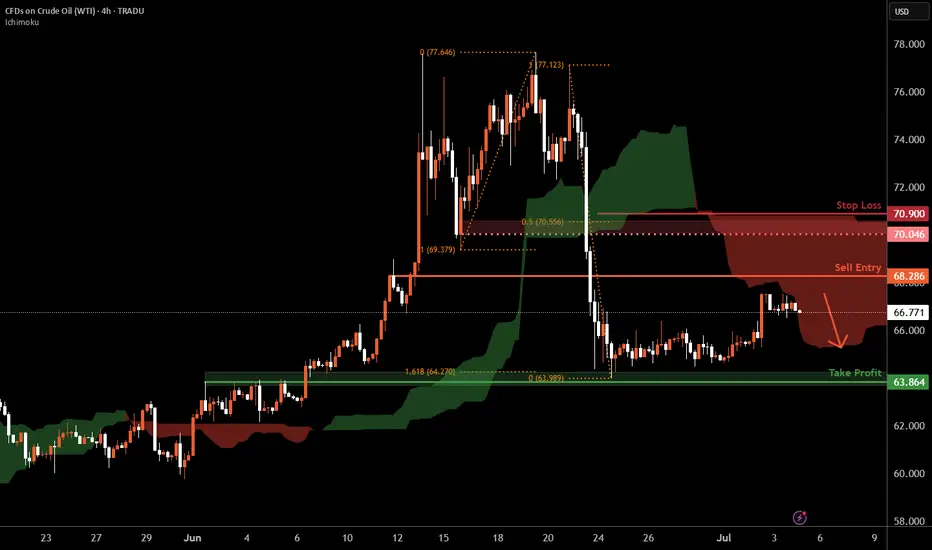
WTI Oil H4 | Heading into a pullback resistanceWTI oil (USOIL) could rise towards a pullback resistance and potentially reverse off this level to drop lower.
Sell entry is at 68.28 which is a pullback resistance.
Stop loss is at 70.90 which is a level that sits above the 50% Fibonacci retracement and a pullback resistance.
Take profit is at 63.86 which is a pullback support that aligns closely with the 161.8% Fibonacci extension.
High Risk Investment Warning
Trading Forex/CFDs on margin carries a high level of risk and may not be suitable for all investors. Leverage can work against you.
Stratos Markets Limited (tradu.com ):
CFDs are complex instruments and come with a high risk of losing money rapidly due to leverage. 63% of retail investor accounts lose money when trading CFDs with this provider. You should consider whether you understand how CFDs work and whether you can afford to take the high risk of losing your money.
Stratos Europe Ltd (tradu.com ):
CFDs are complex instruments and come with a high risk of losing money rapidly due to leverage. 63% of retail investor accounts lose money when trading CFDs with this provider. You should consider whether you understand how CFDs work and whether you can afford to take the high risk of losing your money.
Stratos Global LLC (tradu.com ):
Losses can exceed deposits.
Please be advised that the information presented on TradingView is provided to Tradu (‘Company’, ‘we’) by a third-party provider (‘TFA Global Pte Ltd’). Please be reminded that you are solely responsible for the trading decisions on your account. There is a very high degree of risk involved in trading. Any information and/or content is intended entirely for research, educational and informational purposes only and does not constitute investment or consultation advice or investment strategy. The information is not tailored to the investment needs of any specific person and therefore does not involve a consideration of any of the investment objectives, financial situation or needs of any viewer that may receive it. Kindly also note that past performance is not a reliable indicator of future results. Actual results may differ materially from those anticipated in forward-looking or past performance statements. We assume no liability as to the accuracy or completeness of any of the information and/or content provided herein and the Company cannot be held responsible for any omission, mistake nor for any loss or damage including without limitation to any loss of profit which may arise from reliance on any information supplied by TFA Global Pte Ltd.
The speaker(s) is neither an employee, agent nor representative of Tradu and is therefore acting independently. The opinions given are their own, constitute general market commentary, and do not constitute the opinion or advice of Tradu or any form of personal or investment advice. Tradu neither endorses nor guarantees offerings of third-party speakers, nor is Tradu responsible for the content, veracity or opinions of third-party speakers, presenters or participants.
USDWTI trade ideas
USOIL: Will Keep Growing! Here is Why:
The charts are full of distraction, disturbance and are a graveyard of fear and greed which shall not cloud our judgement on the current state of affairs in the USOIL pair price action which suggests a high likelihood of a coming move up.
Disclosure: I am part of Trade Nation's Influencer program and receive a monthly fee for using their TradingView charts in my analysis.
❤️ Please, support our work with like & comment! ❤️
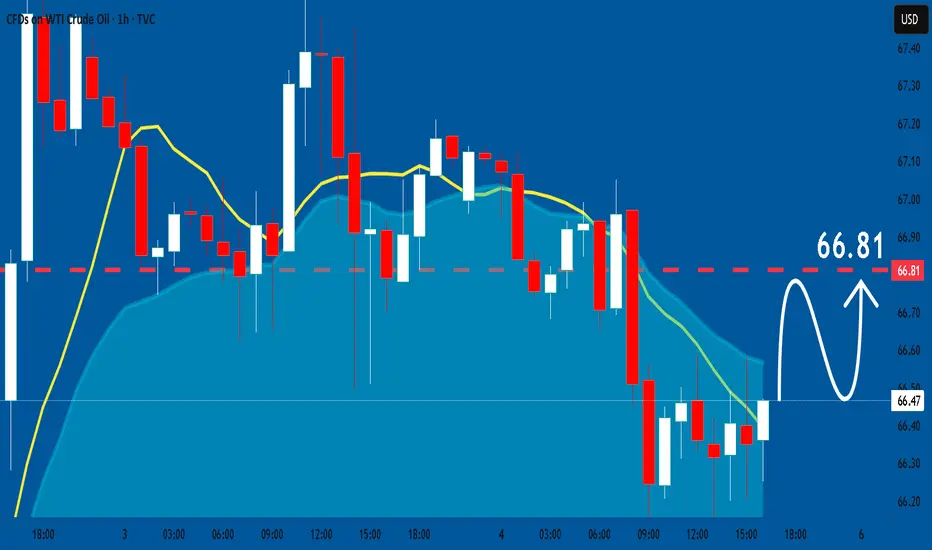
USOIL: Local Bearish Bias! Short!
My dear friends,
Today we will analyse USOIL together☺️
The recent price action suggests a shift in mid-term momentum. A break below the current local range around 66.47 will confirm the new direction downwards with the target being the next key level of 66.19.and a reconvened placement of a stop-loss beyond the range.
❤️Sending you lots of Love and Hugs❤️
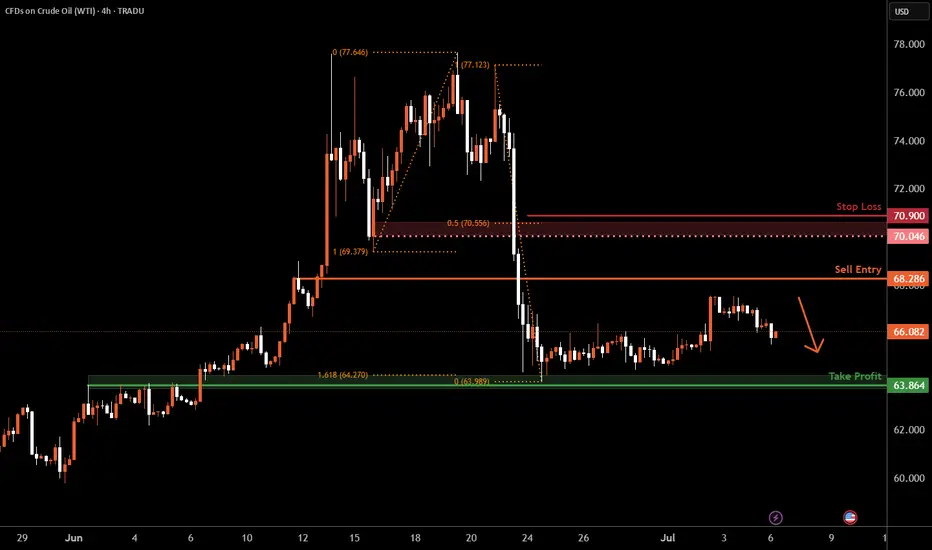
WTI Oil H4 | Potential bearish reversalWTI oil (USOIL) could rise towards a pullback resistance and potentially reverse off this level to drop lower.
Sell entry is at 68.28 which is a pullback resistance.
Stop loss is at 70.90 which is a level that sits above the 50% Fibonacci retracement and a pullback resistance.
Take profit is at 63.86 which is a pullback support that aligns closely with the 161.8% Fibonacci extension.
High Risk Investment Warning
Trading Forex/CFDs on margin carries a high level of risk and may not be suitable for all investors. Leverage can work against you.
Stratos Markets Limited (tradu.com ):
CFDs are complex instruments and come with a high risk of losing money rapidly due to leverage. 63% of retail investor accounts lose money when trading CFDs with this provider. You should consider whether you understand how CFDs work and whether you can afford to take the high risk of losing your money.
Stratos Europe Ltd (tradu.com ):
CFDs are complex instruments and come with a high risk of losing money rapidly due to leverage. 63% of retail investor accounts lose money when trading CFDs with this provider. You should consider whether you understand how CFDs work and whether you can afford to take the high risk of losing your money.
Stratos Global LLC (tradu.com ):
Losses can exceed deposits.
Please be advised that the information presented on TradingView is provided to Tradu (‘Company’, ‘we’) by a third-party provider (‘TFA Global Pte Ltd’). Please be reminded that you are solely responsible for the trading decisions on your account. There is a very high degree of risk involved in trading. Any information and/or content is intended entirely for research, educational and informational purposes only and does not constitute investment or consultation advice or investment strategy. The information is not tailored to the investment needs of any specific person and therefore does not involve a consideration of any of the investment objectives, financial situation or needs of any viewer that may receive it. Kindly also note that past performance is not a reliable indicator of future results. Actual results may differ materially from those anticipated in forward-looking or past performance statements. We assume no liability as to the accuracy or completeness of any of the information and/or content provided herein and the Company cannot be held responsible for any omission, mistake nor for any loss or damage including without limitation to any loss of profit which may arise from reliance on any information supplied by TFA Global Pte Ltd.
The speaker(s) is neither an employee, agent nor representative of Tradu and is therefore acting independently. The opinions given are their own, constitute general market commentary, and do not constitute the opinion or advice of Tradu or any form of personal or investment advice. Tradu neither endorses nor guarantees offerings of third-party speakers, nor is Tradu responsible for the content, veracity or opinions of third-party speakers, presenters or participants.
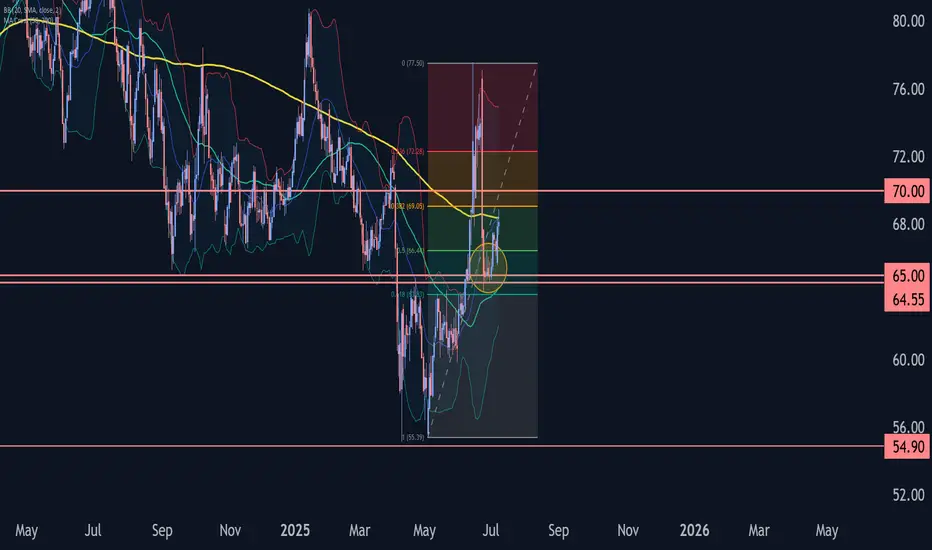
WTI crude oil Wave Analysis – 8 July 2025- WTI crude oil reversed from the support zone
- Likely to rise to resistance level 70.00
WTI crude oil recently reversed up from the support zone located between the key support level 64.55 (former resistance from the end of April), the lower daily Bollinger Band and the 61.8% Fibonacci correction of the upward impulse from May.
The upward reversal from this support zone started the active medium-term ABC correction (2).
WTI crude oil can be expected to rise to the next round resistance level 70.00 (target price for the completion of the active impulse wave i).
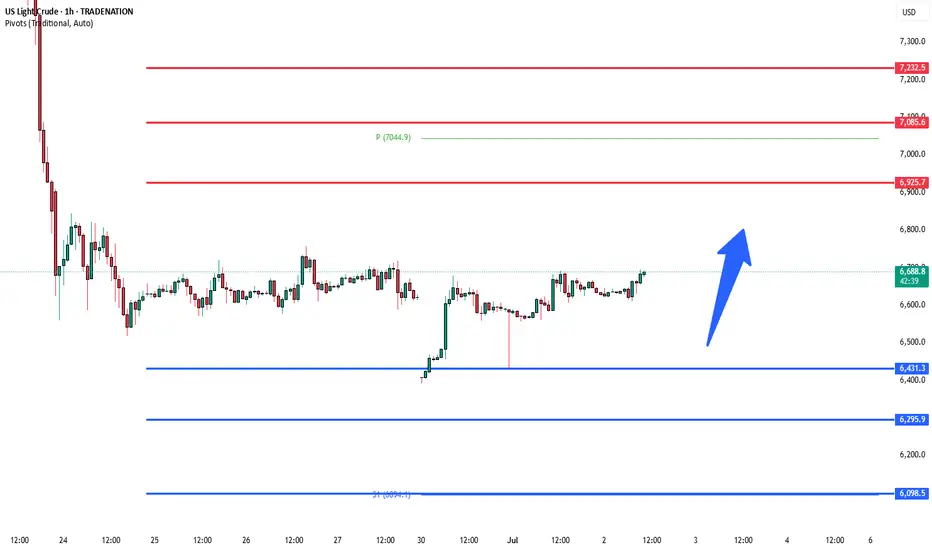
WTI Crude Oil sideways consolidation support at 6460Crude oil prices remain under pressure as easing geopolitical tensions between Iran and Israel reduce fears of supply disruptions in the Middle East. Adding to the bearish tone, the anticipated output increase by OPEC+—expected to raise August production by 411,000 bpd—acts as a supply-side headwind. Meanwhile, a modest rebound in the US Dollar from multi-year lows also weighs on oil demand, given its inverse relationship with USD-denominated commodities.
However, expectations that the Federal Reserve may soon resume rate cuts could limit USD upside, offering some support to oil prices. Traders are likely to stay cautious ahead of key US economic data, including Wednesday’s ADP report and Thursday’s Nonfarm Payrolls, which will shape Fed policy expectations. Additionally, the latest EIA stockpile data will be closely watched for immediate supply signals.
Conclusion:
WTI Crude Oil is likely to trade with a neutral-to-bearish bias in the near term, pressured by rising supply and a firmer dollar. However, Fed rate cut expectations and upcoming US labor and inventory data may help cushion the downside. Traders may remain on the sidelines until clearer direction emerges post-NFP and OPEC+ decisions.
Key Support and Resistance Levels
Resistance Level 1: 6925
Resistance Level 2: 7080
Resistance Level 3: 7230
Support Level 1: 6460
Support Level 2: 6300
Support Level 3: 6100
This communication is for informational purposes only and should not be viewed as any form of recommendation as to a particular course of action or as investment advice. It is not intended as an offer or solicitation for the purchase or sale of any financial instrument or as an official confirmation of any transaction. Opinions, estimates and assumptions expressed herein are made as of the date of this communication and are subject to change without notice. This communication has been prepared based upon information, including market prices, data and other information, believed to be reliable; however, Trade Nation does not warrant its completeness or accuracy. All market prices and market data contained in or attached to this communication are indicative and subject to change without notice.
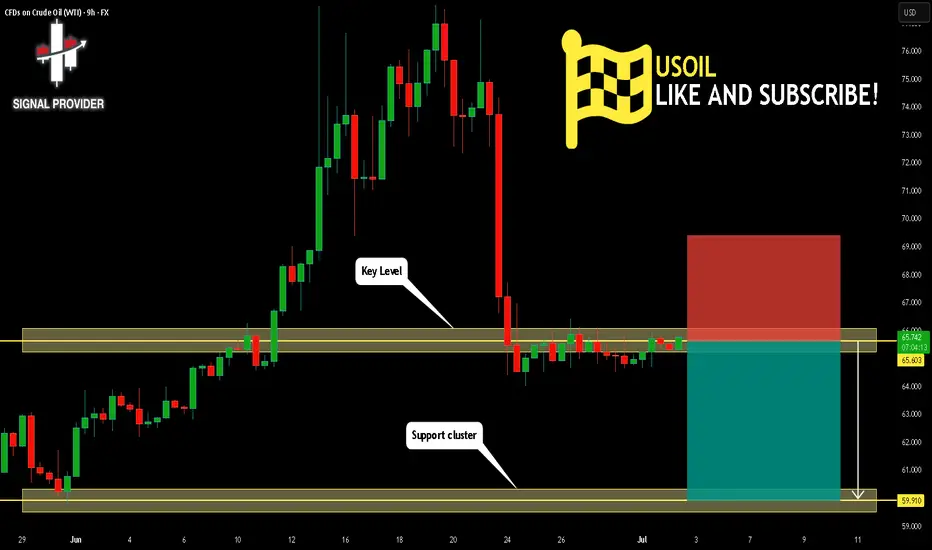
USOIL Will Fall! Sell!
Take a look at our analysis for USOIL.
Time Frame: 9h
Current Trend: Bearish
Sentiment: Overbought (based on 7-period RSI)
Forecast: Bearish
The market is testing a major horizontal structure 65.603.
Taking into consideration the structure & trend analysis, I believe that the market will reach 59.910 level soon.
P.S
The term oversold refers to a condition where an asset has traded lower in price and has the potential for a price bounce.
Overbought refers to market scenarios where the instrument is traded considerably higher than its fair value. Overvaluation is caused by market sentiments when there is positive news.
Disclosure: I am part of Trade Nation's Influencer program and receive a monthly fee for using their TradingView charts in my analysis.
Like and subscribe and comment my ideas if you enjoy them!
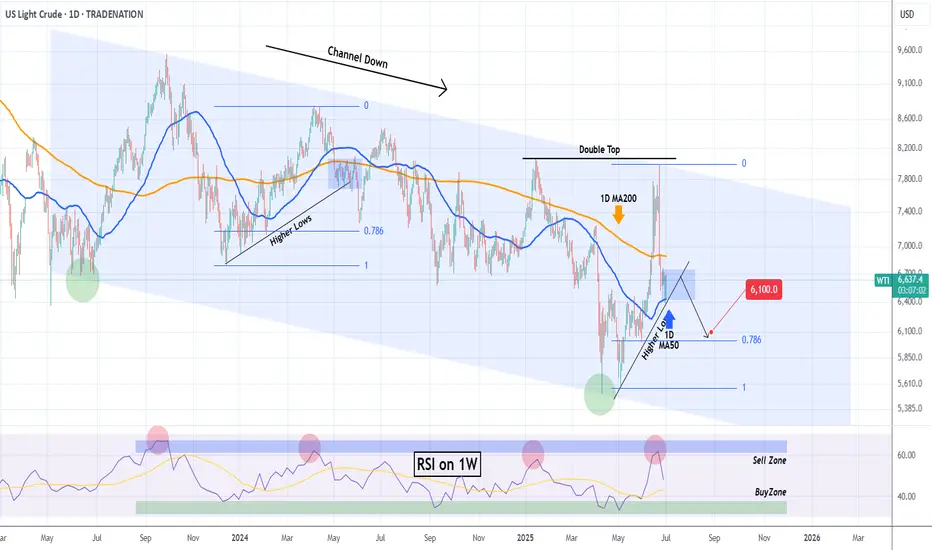
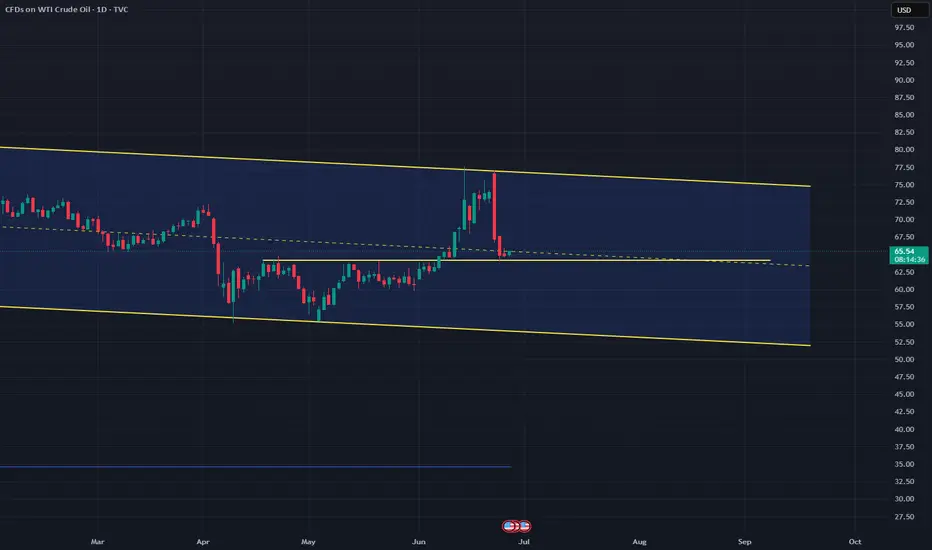
WTI OIL This is the only Support right now.WTI Crude Oil (USOIL) is so far holding its 1D MA50 (blue trend-line), the natural medium-term Support, following a quick price deflation after the Israel - Iran de-escalation.
In our opinion, the trend-line that currently matters most though, is the Higher Lows coming straight from the May 05 Low. If broken, we expect a quick test of the 0.786 Fibonacci retracement level, as it resembles the December 2023 - May 2024 Higher Lows trend-line.
Even the 1W RSI is similar among the two fractals, and it has to be said that both are part of the 2-year Channel Down pattern.
So if the Higher Lows trend-line breaks, we can target $61.00.
-------------------------------------------------------------------------------
** Please LIKE 👍, FOLLOW ✅, SHARE 🙌 and COMMENT ✍ if you enjoy this idea! Also share your ideas and charts in the comments section below! This is best way to keep it relevant, support us, keep the content here free and allow the idea to reach as many people as possible. **
-------------------------------------------------------------------------------
Disclosure: I am part of Trade Nation's Influencer program and receive a monthly fee for using their TradingView charts in my analysis.
💸💸💸💸💸💸
👇 👇 👇 👇 👇 👇
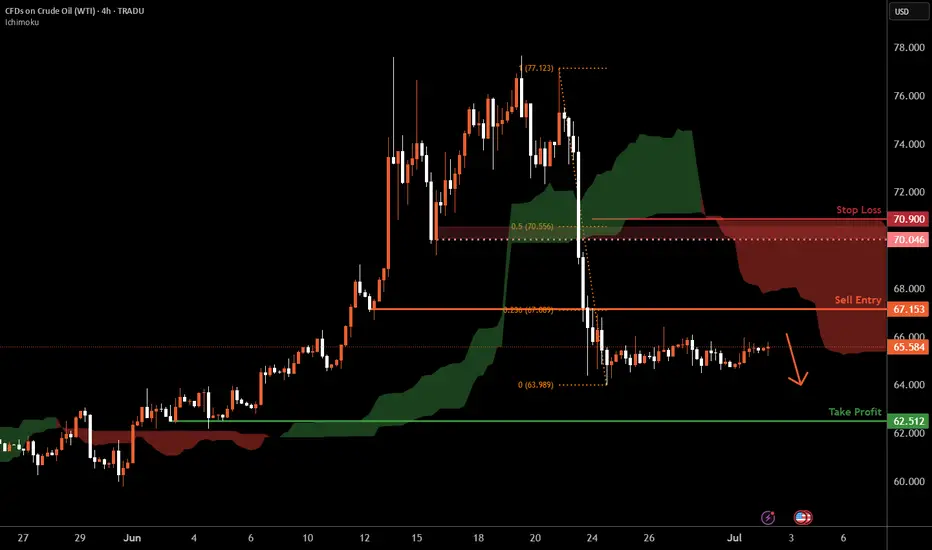
WTI Oil H4 | Potential bearish reversalWTI oil (USOIL) is rising towards a pullback resistance and could potentially reverse off this level to drop lower.
Sell entry is at 67.15 which is a pullback resistance that aligns with the 23.6% Fibonacci retracement.
Stop loss is at 70.90 which is a level that sits above the 50% Fibonacci retracement and a pullback resistance.
Take profit is at 62.51 which is a swing-low support.
High Risk Investment Warning
Trading Forex/CFDs on margin carries a high level of risk and may not be suitable for all investors. Leverage can work against you.
Stratos Markets Limited (tradu.com ):
CFDs are complex instruments and come with a high risk of losing money rapidly due to leverage. 63% of retail investor accounts lose money when trading CFDs with this provider. You should consider whether you understand how CFDs work and whether you can afford to take the high risk of losing your money.
Stratos Europe Ltd (tradu.com ):
CFDs are complex instruments and come with a high risk of losing money rapidly due to leverage. 63% of retail investor accounts lose money when trading CFDs with this provider. You should consider whether you understand how CFDs work and whether you can afford to take the high risk of losing your money.
Stratos Global LLC (tradu.com ):
Losses can exceed deposits.
Please be advised that the information presented on TradingView is provided to Tradu (‘Company’, ‘we’) by a third-party provider (‘TFA Global Pte Ltd’). Please be reminded that you are solely responsible for the trading decisions on your account. There is a very high degree of risk involved in trading. Any information and/or content is intended entirely for research, educational and informational purposes only and does not constitute investment or consultation advice or investment strategy. The information is not tailored to the investment needs of any specific person and therefore does not involve a consideration of any of the investment objectives, financial situation or needs of any viewer that may receive it. Kindly also note that past performance is not a reliable indicator of future results. Actual results may differ materially from those anticipated in forward-looking or past performance statements. We assume no liability as to the accuracy or completeness of any of the information and/or content provided herein and the Company cannot be held responsible for any omission, mistake nor for any loss or damage including without limitation to any loss of profit which may arise from reliance on any information supplied by TFA Global Pte Ltd.
The speaker(s) is neither an employee, agent nor representative of Tradu and is therefore acting independently. The opinions given are their own, constitute general market commentary, and do not constitute the opinion or advice of Tradu or any form of personal or investment advice. Tradu neither endorses nor guarantees offerings of third-party speakers, nor is Tradu responsible for the content, veracity or opinions of third-party speakers, presenters or participants.
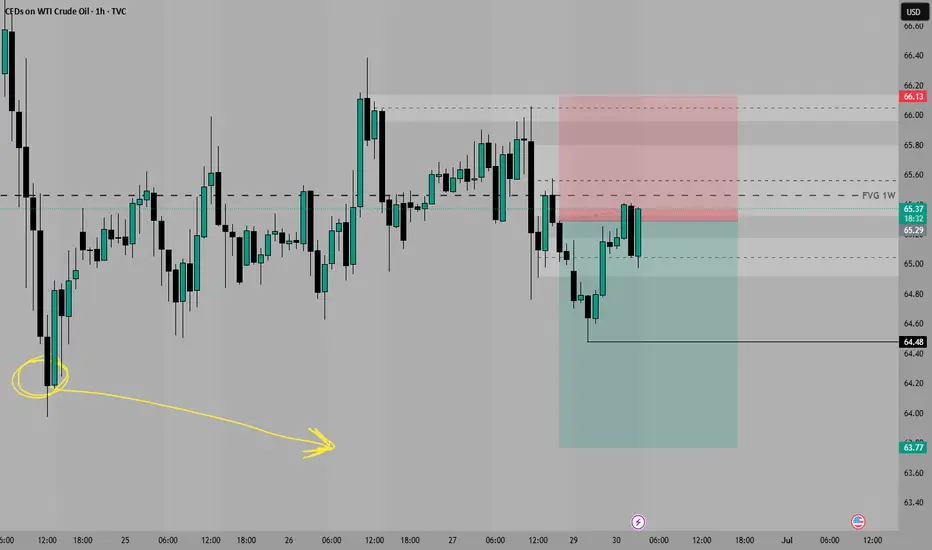
#USOIIL #WTI 1H📈 #USOIL 1H Buy Setup – Liquidity Sweep in Play
Crude Oil is consolidating after a sharp decline, forming a potential setup for a liquidity sweep below the current range, followed by a bullish reversal. We're anticipating a fakeout move to grab sell-side liquidity before price targets the Fair Value Gap (FVG) and premium supply zone above.
🟩 Buy Limit: 64.50 / 64.00
🎯 Targets: 70.00 → 72.00+
❌ Stop Loss: 63.00
This setup offers high risk-to-reward potential if the liquidity sweep plays out as expected. Monitor price action closely at the buy zone.
#CrudeOil #WTI #SmartMoney #TradingStrategy

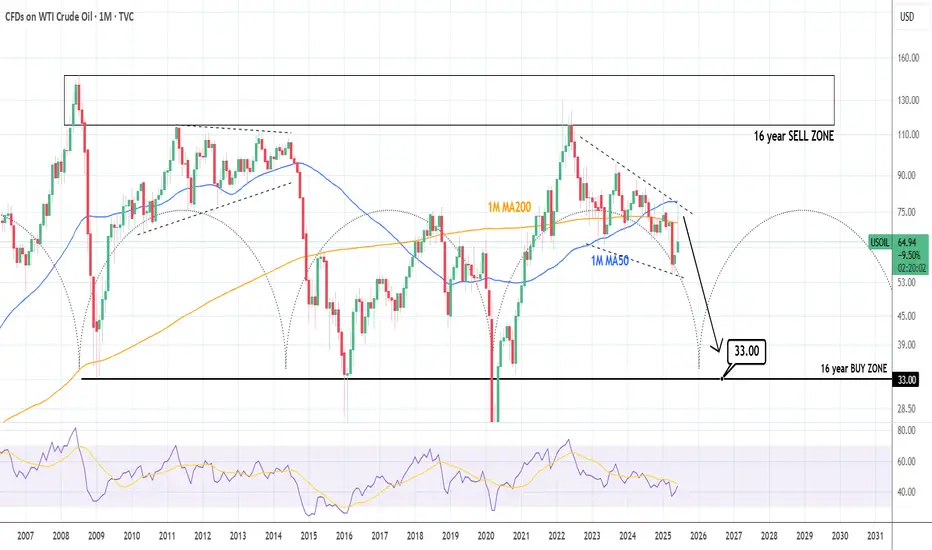
WTI CRUDE OIL: Brutal collapse expectedWTI Crude Oil has turned bearish again on its 1D technical outlook (RSI = 44.990, MACD = 0.310, ADX = 38.289) and is expected to accelerate the effect as based on the 16 year Cycles, late 2025 and most of 2026 should experience a price collapse. The most optimal Buy Zone starts at $33.00, it could go lower but that's a solid base from which to expect a bounce back above $110.00 by 2028.
## If you like our free content follow our profile to get more daily ideas. ##
## Comments and likes are greatly appreciated. ##
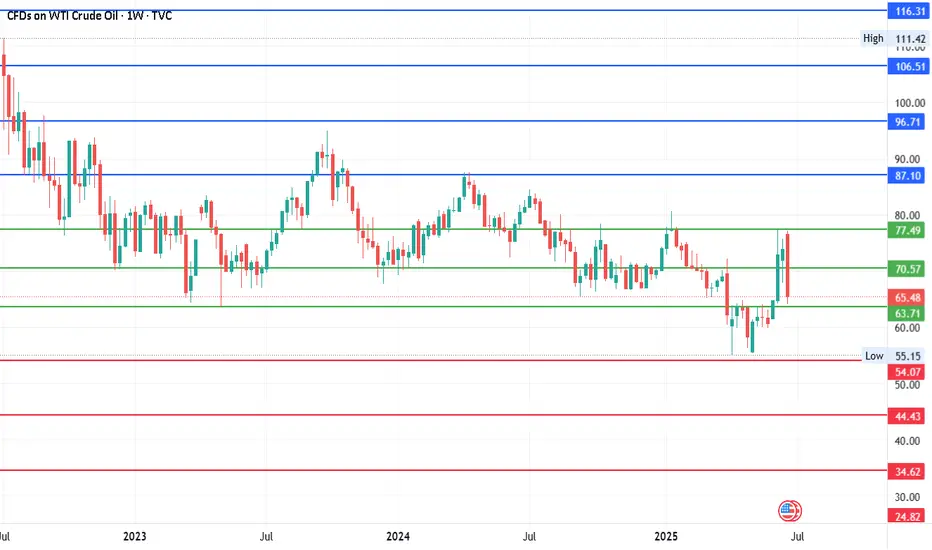
# USOIL - $40 Move? Something Major is coming?Date: 25-06-2025
#USOIL Current Price: $65.45
Pivot Point: 70.57 Support: 63.71 Resistance: 77.49
#USOIL Upside Targets:
Target 1: 87.10
Target 2: 96.71
Target 3: 106.51
Target 4: 116.31
#USOIL Downside Targets:
Target 1: 54.07
Target 2: 44.43
Target 3: 34.62
Target 4: 24.82
WTI Oil – From Conflict to StrategyBack on April 24, I marked a short zone. On June 11, price broke above that level, giving a long opportunity — which I took.
Unfortunately, it coincided with the tragic military strike by Israel on Iran, pushing oil sharply higher. I’ve pinned that analysis.
Following the ceasefire, price dropped again — just a reminder that geopolitics can shake the charts.
As traders, we stay prepared to act, even while acknowledging the deep sadness of lives lost.
Now I wait for price to reach my marked level again. If I get a valid signal, I’ll short.
But if price breaks and holds above, I’ll buy the pullback — with no bias, just pure execution.
Risk-managed. Emotion-neutral. Opportunity-focused.
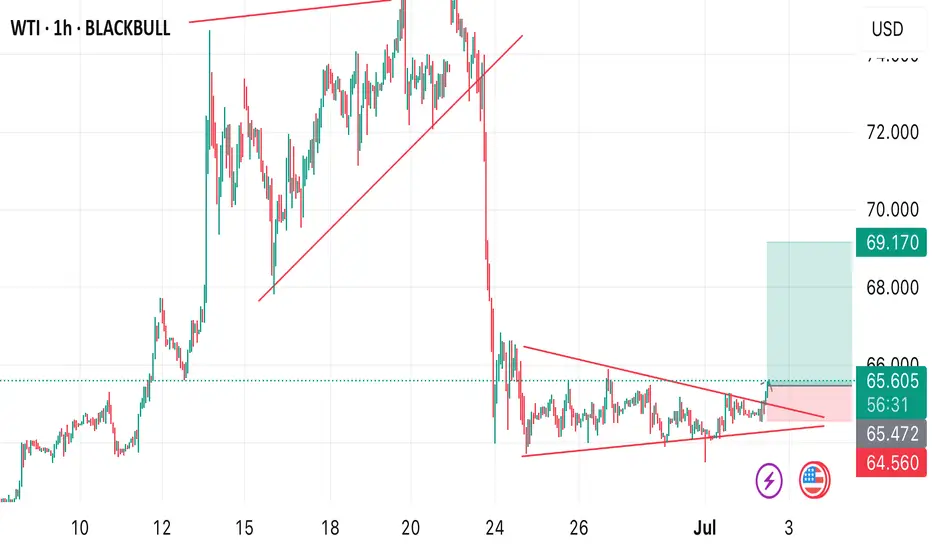
USOILThe first higher high after a downtrend indicates a potential trend reversal to the upside. It shows that buyers are starting to regain control, signaling the possibility of a new bullish trend.
Trendline Break: A break above a significant trendline further confirms the shift in sentiment from bearish to bullish. The trendline break signifies that selling pressure has weakened, and the market is poised for further upward movement.
Retest of Trendline: After breaking the trendline, the price often retests the broken trendline, which now acts as support. This retest offers a low-risk buying opportunity as it confirms the strength of the new uptrend.
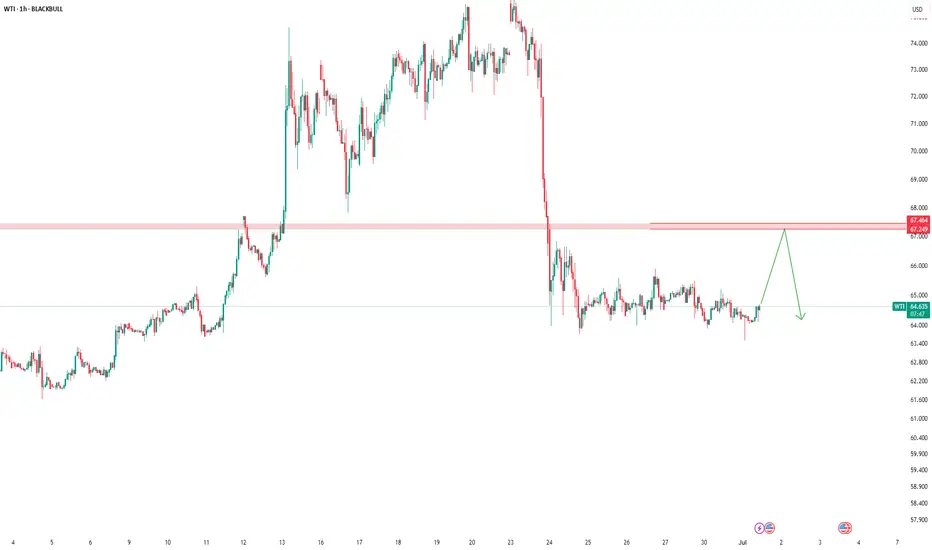
WTI BUY OPPORTUNITY!!!Price just offered a buy opportunity as it trades at $65.605 per barrel. I anticipate a bullish price action to develop away from the current market price. The massive pullback that occurred from the daily timeframe is completed and it’s due for a buy.
Take advantage of this opportunity now!
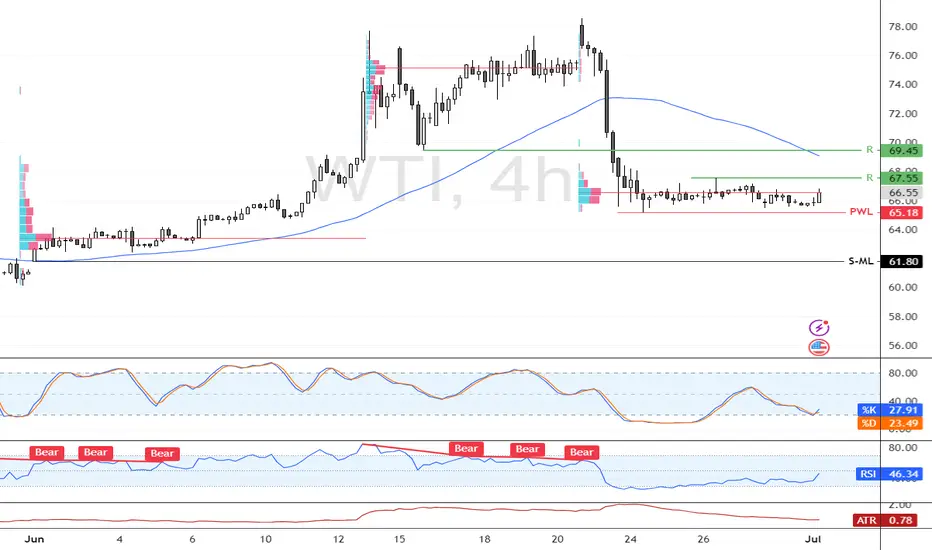
Bullish Setup Forms as Institutions Accumulate CrudeCrude Oil is consolidating above support at $65.18, with momentum indicators turning bullish. The Stochastic is rising from 27, and RSI is approaching the 50.0 mark. Institutional buying reported in the latest COT data reinforces the bullish bias.
A move above $67.55 could open the door to $69.45, while the bullish outlook stays intact as long as the price remains above $61.80.
Analysis of Crude Oil's Opening Market Strategy on MondayWTI crude oil futures stabilized for the second consecutive day, maintaining fluctuations within the broad range of Tuesday and oscillating around the key level of $65.12. A sustained break below this level would confirm the resurgence of selling pressure, and a breach of $64.00 could trigger a decline toward $61.90. On the upside, if the price holds above $65.12, it may drive a short-term rebound to $67.44, and if momentum strengthens, it could further test $71.20.
Crude oil prices remain range-bound, but downward pressure is building. Robust U.S. demand provides support, yet macroeconomic caution and uncertainties over OPEC+ intentions are suppressing market sentiment. A decisive break below $65.12 would confirm the bearish trend, with bears targeting $61.90. Conversely, if this level holds, neutral-to-bullish logic remains valid, though upside potential remains constrained unless supply-demand signals converge overall.
you are currently struggling with losses,or are unsure which of the numerous trading strategies to follow,You have the option to join our VIP program. I will assist you and provide you with accurate trading signals, enabling you to navigate the financial markets with greater confidence and potentially achieve optimal trading results.
Trading Strategy:
buy@63.1-63.3
TP:66.3-69.9
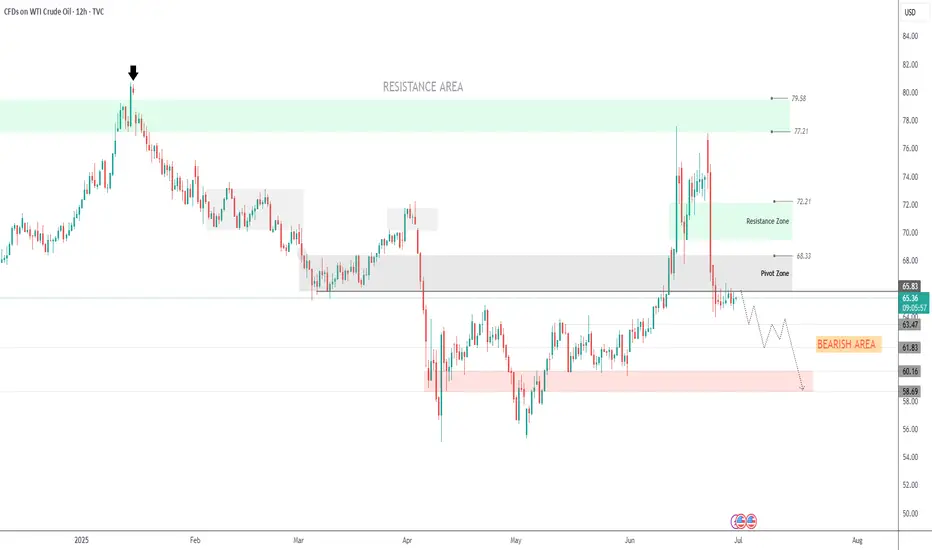
OIL |Bearish Pressure Builds as OPEC+ Prepares Fresh Output Hike OIL | Market Overview
Oil prices edged lower on Monday despite strong seasonal demand, as the market prepares for an increase in supply. OPEC+ is set to raise production by 411,000 barrels per day starting Tuesday, marking the fourth monthly increase in output. Another similar hike is reportedly under consideration for August, which may further pressure prices.
Technical Outlook
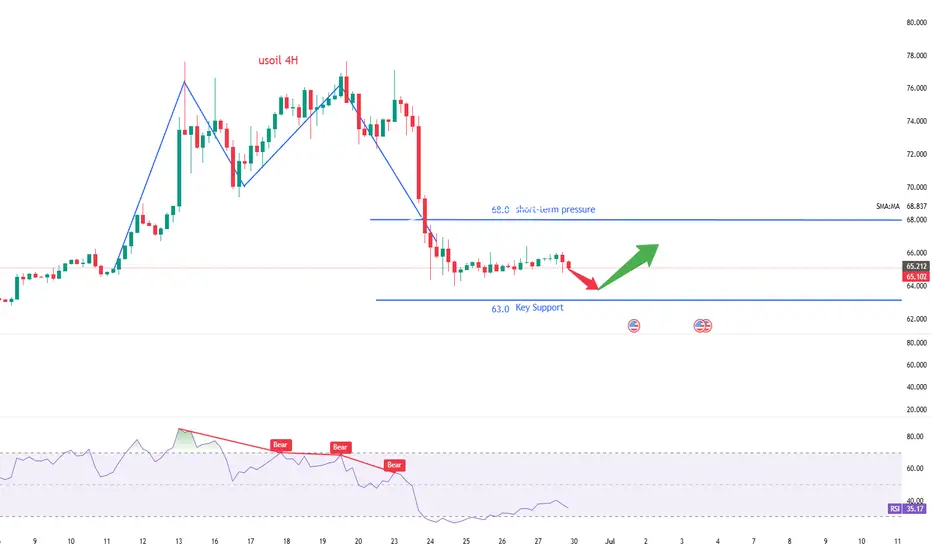
The price remains within the bearish zone and is expected to continue its decline as long as it trades below the pivot level at 65.83.
A daily candle close above 65.83 is required to confirm a potential bullish reversal.
Until then, the bearish trend remains intact, targeting 63.47, 61.83, and potentially 60.16.
Key Levels
Pivot: 65.83
Support: 63.47 / 61.83 / 60.16
Resistance: 68.33 / 69.55
OIL IDEA /30 06 25So we are looking for this Short position, but first we need a better Premium position
OIL Bouncing at SupportLooking for a short bounce on US Oil here after a massive sell off earlier this week when the ceasefire was announced in the middle east. Again this is a short, countertrend bounce trade . Once you get a few percent, take your profits and get out.
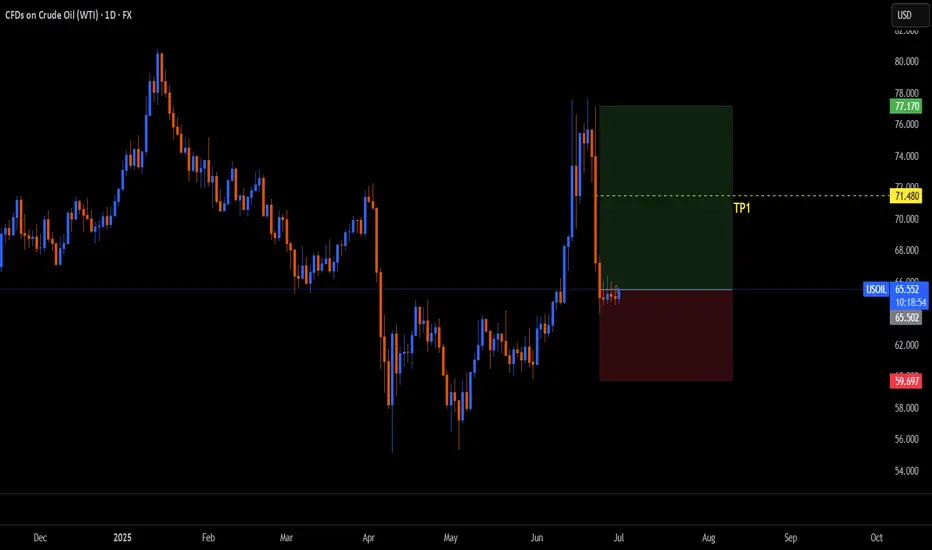
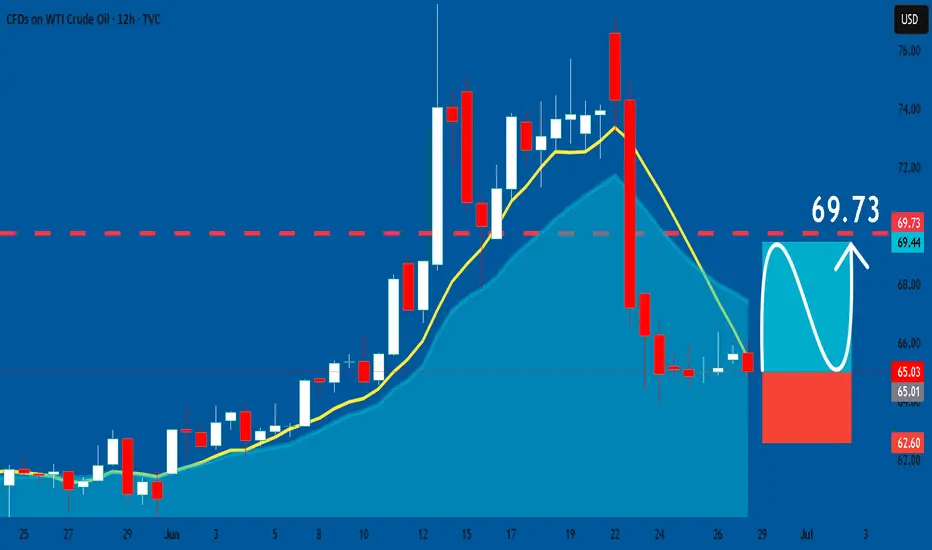
USOIL: Long Trading Opportunity
USOIL
- Classic bullish pattern
- Our team expects retracement
SUGGESTED TRADE:
Swing Trade
Buy USOIL
Entry - 65.03
Stop - 62.60
Take - 69.73
Our Risk - 1%
Start protection of your profits from lower levels
Disclosure: I am part of Trade Nation's Influencer program and receive a monthly fee for using their TradingView charts in my analysis.
❤️ Please, support our work with like & comment! ❤️
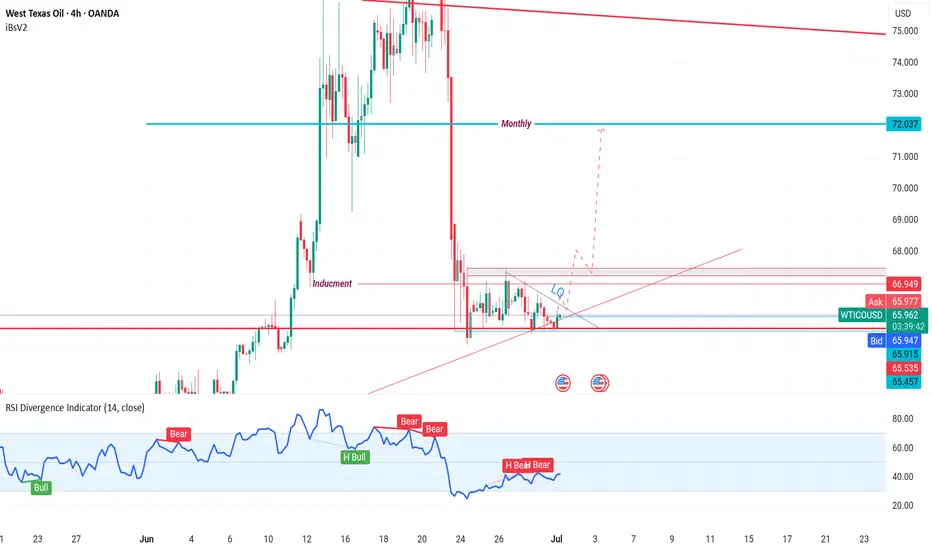
WTI on high time frame
"Hello traders, focusing on WTI crude oil, the price surged to $78 but sharply retreated to the $65 zone. Over the last five days, the price has consolidated. I believe that the signals from the recent 4-hour candle suggest a potential move towards higher prices, with the next target possibly being around $72. I will be monitoring the price action around $72 closely for a potential rejection or continuation towards even higher prices."
If you need further assistance or have additional insights to share, feel free to let me know.
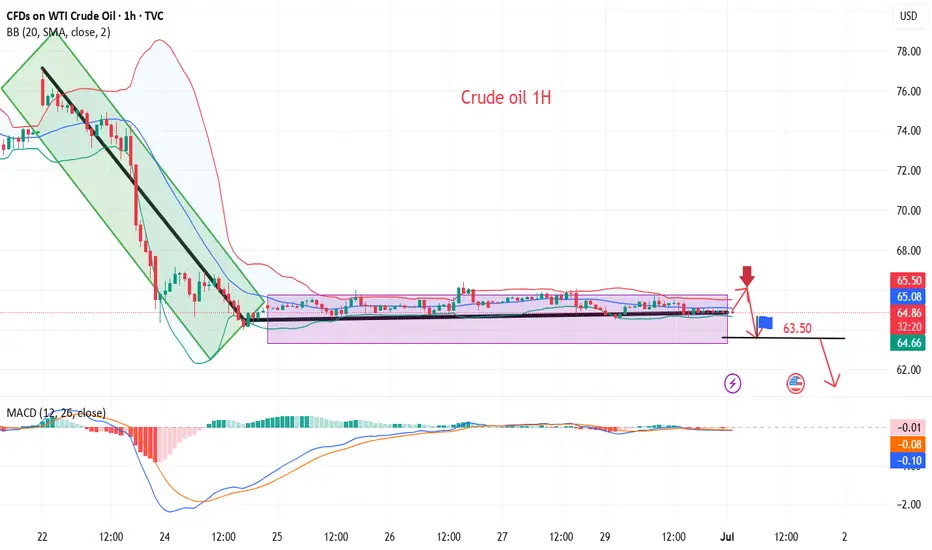
Crude oil continues to correct, short-term ideas
💡Message Strategy
WTI crude oil prices recovered from a two-week low but remained about $12 below the previous Monday's high as upside was limited by Middle East peace and expectations that OPEC+ countries will agree to increase supply again this week.
📊Technical aspects
From the daily chart level, crude oil fluctuates upward in the medium term and tests around 75. The K-line closes with a large real negative line, which has not yet destroyed the moving average system and is still supported. The medium-term objective upward trend remains unchanged.
However, from the perspective of momentum, the MACD indicator crosses downward above the zero axis, indicating that the bullish momentum is weakening. It is expected that the medium-term trend of crude oil will fall into a high-level oscillation pattern.
The short-term trend of crude oil (1H) continues to fluctuate in a narrow range, and the oil price falls back to the lower edge of the range. Pay attention to the support strength of 64. In terms of momentum, the MACD indicator is at the zero axis position, and the long and short forces are equal. It is expected that the trend of crude oil will maintain a fluctuating consolidation pattern during the day.
💰Strategy Package
Short Position:65.50-66.50,SL:67.50,Target: 64.00-63.00