Market next move 🔄 Disruption Analysis: Contrarian View
⚠️ Original Viewpoint Summary:
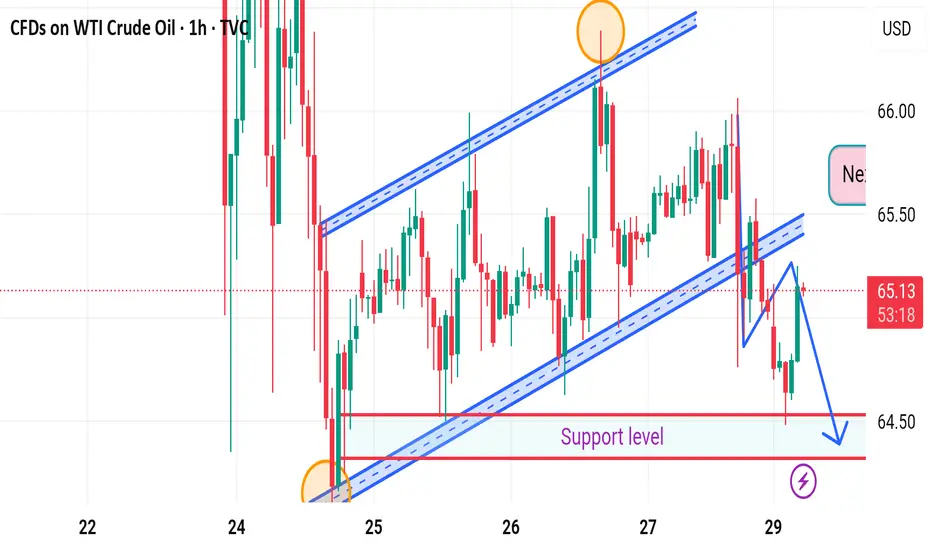
The original analysis suggests a bearish breakdown from the rising channel, with a short-term target of 64.36, pointing to a move towards the support zone.
---
📉 Disrupted (Contrarian) Perspective:
🔁 Fakeout Scenario Possibility:
The sharp drop below the trendline may be a bear trap.
Price quickly bounced back into the channel region, showing buyer interest near the support.
🔎 Key Observations:
Wick rejection near the lower support suggests that demand is active around 64.50–64.36 zone.
The structure of higher lows is still valid unless there's a confirmed close below the support box.
Momentum indicators (not shown) may help validate whether this is a temporary pullback or a deeper correction.
📈 Alternative Projection:
If price holds above the support zone, it could rebound back to test 65.50–65.80 resistance.
A false breakdown followed by consolidation may lead to retest of the upper channel (near 66.00).
---
🧭 Revised Strategy Suggestion:
Avoid early shorts unless there is a confirmed candle close below 64.36.
Watch for bullish price action near support (hammer, engulfing) for a potential long re-entry.
Reevaluate if WTI forms a base around 64.40 — possible reversal setup.
USDWTI trade ideas
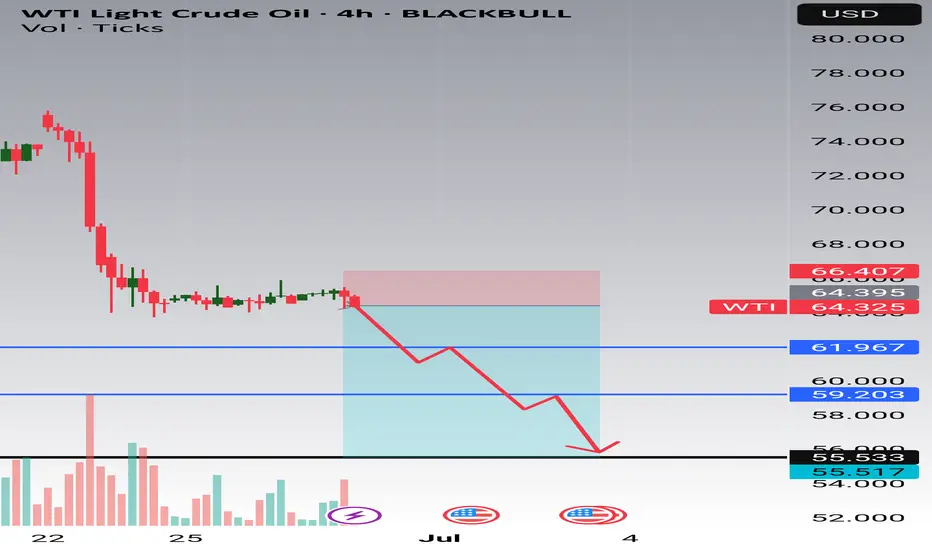
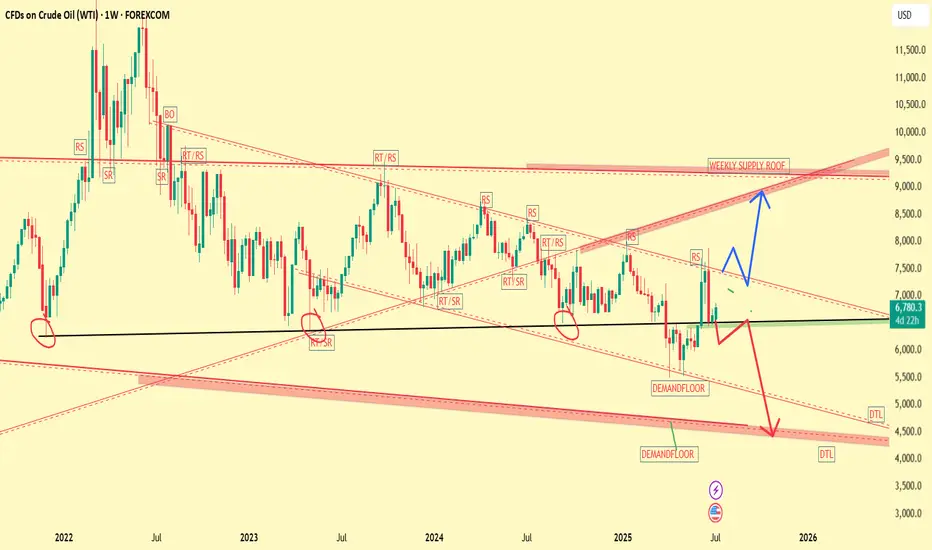
WTI will most likely fall to 55.There will be a lot of oil on the market in next few weeks. Im expecting a sharp fall on WTI after this consolidation and the most likely level which can hold is 55 weekly level. All lines represents target levels. If you decided to trade this idea, TP partially, use proper sizing. Wish you good luck.
Bulls on the Loose: US Oil Spot/WTI Heist Strategy! 🚨💰 THE OIL VAULT HEIST: US OIL SPOT/WTI TRADING STRATEGY 💸🔫
🌟Hi! Hola! Ola! Bonjour! Hallo! Marhaba!🌟
Dear Money Makers & Robbers 🤑💰💸✈️
Based on our 🔥Thief Trading style analysis🔥 (both technical and fundamental), here’s the master plan to heist the US Oil Spot/WTI Energy Market. Follow the blueprint carefully—this strategy focuses on long entries, with a daring escape planned near the high-risk Red ATR line Zone where bearish robbers and consolidation traps await. 🏆💸 Take your profit and treat yourself, fellow traders—you earned it! 💪🏆🎉
🕵️♂️ Entry 📈
💥 The vault is wide open! Time to swipe that bullish loot—heist is on!
Place buy limit orders within the 15 or 30-minute timeframe, near swing lows/highs for pullback entries.
🛑 Stop Loss 🛑
📍 Thief’s SL—recent swing low and below the moving average (4H timeframe) for day/swing trades.
📍 Adjust SL based on risk, lot size, and number of orders.
🎯 Target
🏴☠️💥 69.000 (Aim for the big loot!) OR escape before the target
🔥 Market Heist Overview
The UK Oil Spot/Brent market is currently showing bullishness 🐂, driven by key factors—perfect for a day/scalping trade robbery! ☝☝☝
📰 Additional Tools & Analysis
📊 Get the Fundamental, Macro, COT Report, Quantitative Analysis, Sentiment Outlook, Intermarket Analysis, Future Targets—check our bi0 liinks 👉👉👉🔗🔗
⚠️ Trading Alert: News Releases & Position Management
📰 News can rattle the vault! 💥
✅ Avoid new trades during news releases.
✅ Use trailing stop-loss orders to protect profits.
💖 Supporting our heist plan?
💥 Smash the Boost Button 💥 to empower the robbery team.
Let’s make money every day in this market with the Thief Trading Style! 🏆💪🤝❤️🎉🚀
👀 Stay tuned for the next robbery plan, thieves! 🤑🐱👤🤗🤩

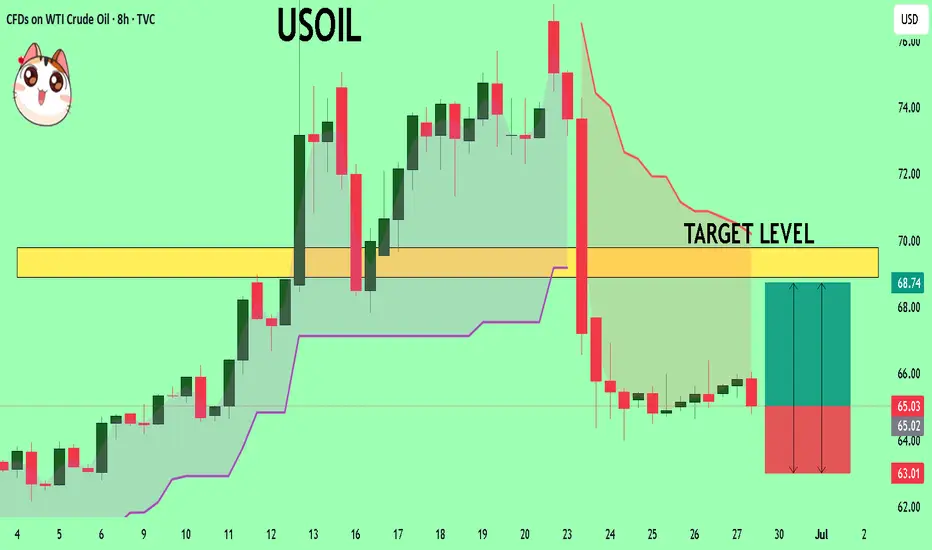
USOIL The Target Is UP! BUY!
My dear friends,
USOIL looks like it will make a good move, and here are the details:
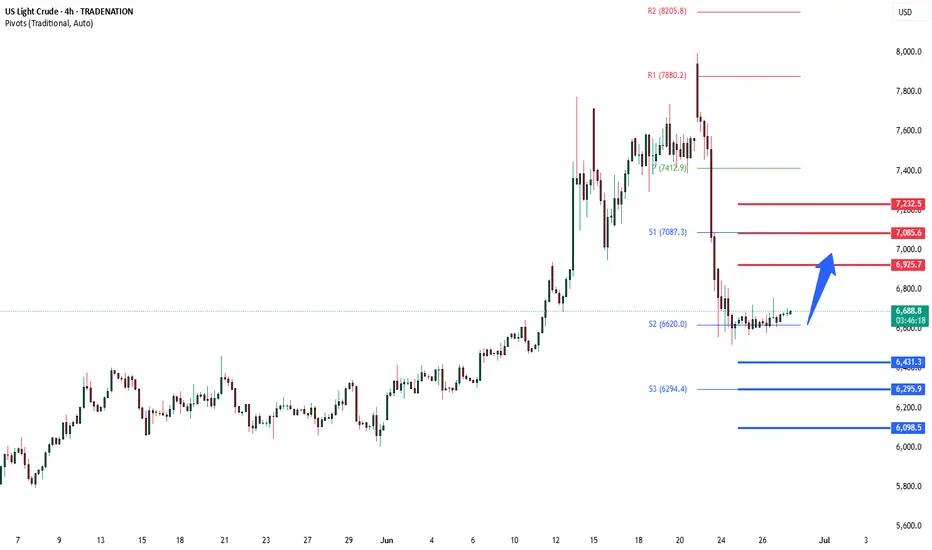
The market is trading on 65.03 pivot level.
Bias - Bullish
Technical Indicators: Supper Trend generates a clear long) signal while Pivot Point HL is currently determining the overall Bullish trend of the market.
Goal - 68.89
Recommended Stop Loss - 63.01
About Used Indicators:
Pivot points are a great way to identify areas of support and resistance, but they work best when combined with other kinds of technical analysis
Disclosure: I am part of Trade Nation's Influencer program and receive a monthly fee for using their TradingView charts in my analysis.
———————————
WISH YOU ALL LUCK
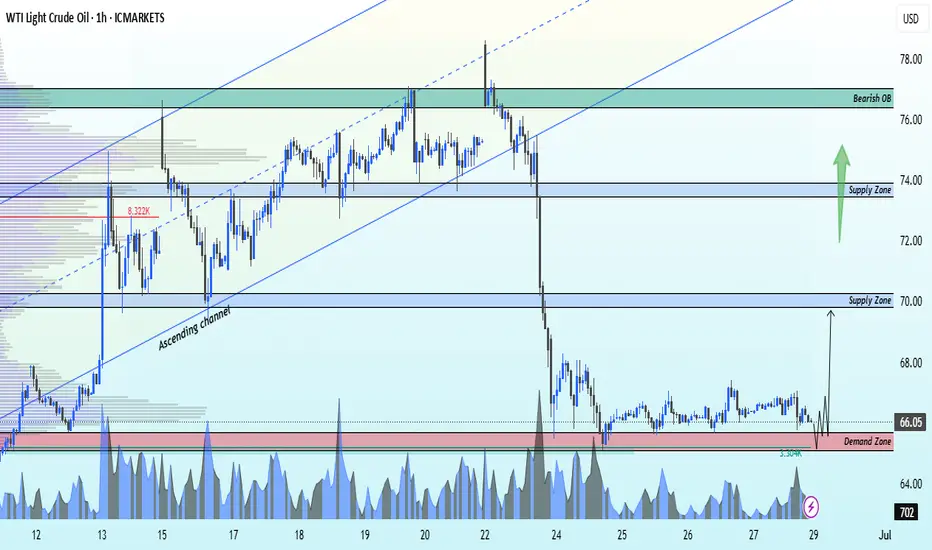
XTIUSD Breakdown from ascending channel now buy from supportXTIUSD Technical Update – 1H Timeframe 🚨
Crude Oil (XTIUSD) has broken down from the ascending channel, but is now showing a strong bullish reaction from the key demand zone at 65.10.
📈 Upside Targets:
🔹 1st Target: 70.00 – Local supply zone
🔹 2nd Target: 74.00 – Key supply zone
🔹 3rd Target: 77.00 – Bearish order block
The momentum is shifting – bulls are stepping in! Watch for confirmations on lower timeframes and manage risk accordingly. 🔍
✅ Like
✅ Follow
✅ Comment
💬 Join us for more real-time updates and analysis!
— With 💖,
Livia 😜
WTI OIL Might be close to the end of correction or finished it.there are definetly more than 1 posibilities in this one, 1 more down wave can occur and that is why i have a invalidation level. long term definetly buy but short and mid term is just not very clear, i am thinking it s time to buy. what i am going to do is keep track of it a bit more in short term and if it gives me good buying opportunity near the below i will enter the trade with a stop loss. and if it upbrakes possible impulse wave will occur and i will buy again to mid term target. so for now keep an eye on it and buy if the opportunity arise.

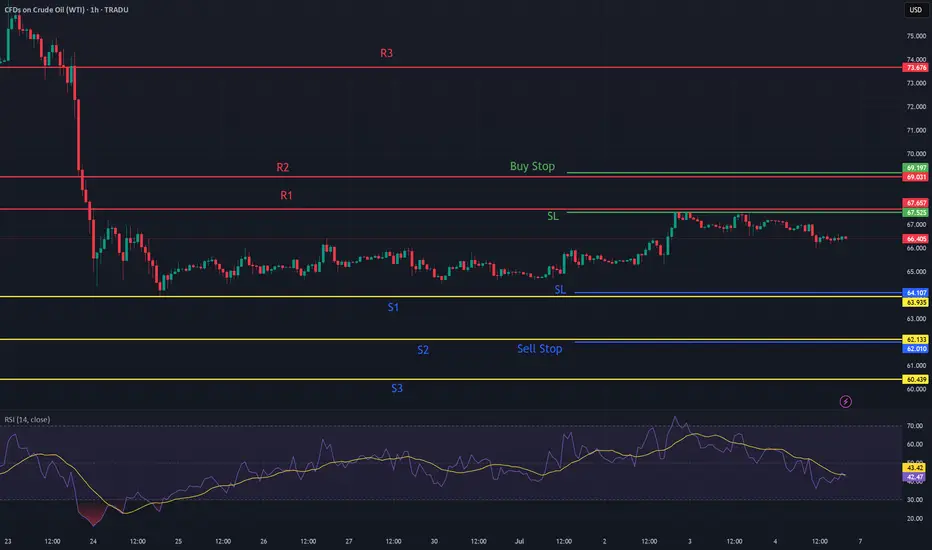
WTI Crude oversold rally support at 6400WTI crude oil is trading just above a two-week low of 6400, as demand concerns continue to weigh on prices.
The pressure comes from uncertainty around President Trump’s tariff policy, which could worsen when the current 90-day pause ends on July 9. So far, only a minor trade deal with the UK has been reached, adding to fears of a global slowdown and weaker oil demand.
Earlier this week, oil prices also dropped after Trump announced a ceasefire between Israel and Iran, easing fears about disruptions through the Strait of Hormuz, a major oil shipping route.
On the positive side, expectations for Federal Reserve rate cuts are rising. If Trump replaces Fed Chair Jerome Powell with someone more supportive of rate cuts, it could help lift oil prices slightly by boosting the economic outlook.
Overall, oil remains under pressure with limited upside unless demand outlook improves or further supportive policy measures emerge.
Key Support and Resistance Levels
Resistance Level 1: 6925
Resistance Level 2: 7080
Resistance Level 3: 7230
Support Level 1: 6460
Support Level 2: 6300
Support Level 3: 6100
This communication is for informational purposes only and should not be viewed as any form of recommendation as to a particular course of action or as investment advice. It is not intended as an offer or solicitation for the purchase or sale of any financial instrument or as an official confirmation of any transaction. Opinions, estimates and assumptions expressed herein are made as of the date of this communication and are subject to change without notice. This communication has been prepared based upon information, including market prices, data and other information, believed to be reliable; however, Trade Nation does not warrant its completeness or accuracy. All market prices and market data contained in or attached to this communication are indicative and subject to change without notice.
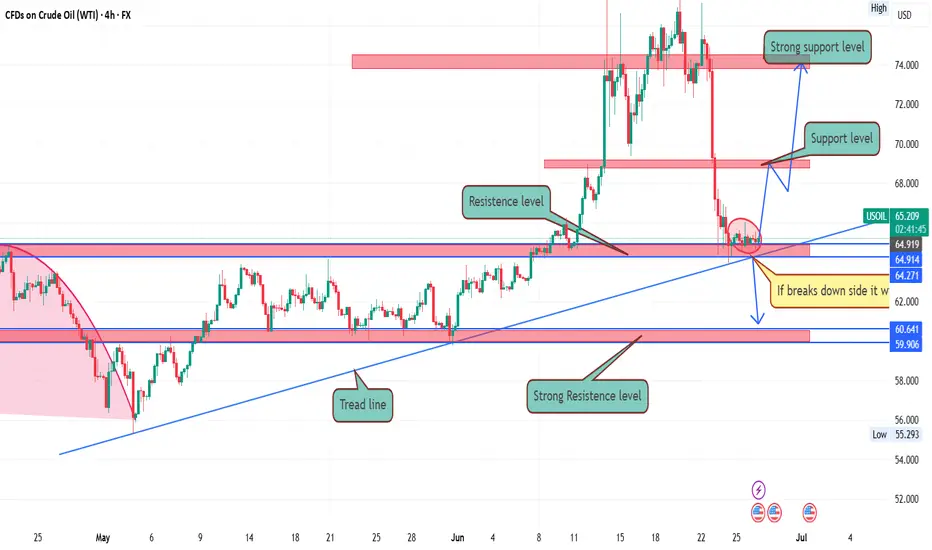
USOIL Technical analysisThere is a possibility of going up. If it breaks down, it will go down even further. Otherwise, it is likely to go up gradually.
USOIL:Go long
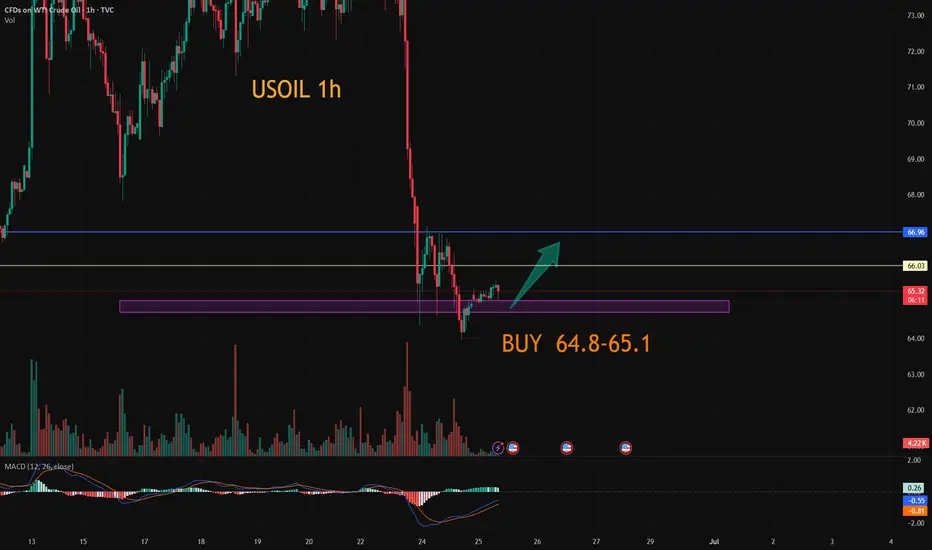
usoil: Let's start with a short-term rebound.
Trading idea:
BUY@64.8-65.2
TP: 66-66.4
More detailed strategies and trading will be notified here ↗↗↗
Keep updated, come to "get" ↗↗↗
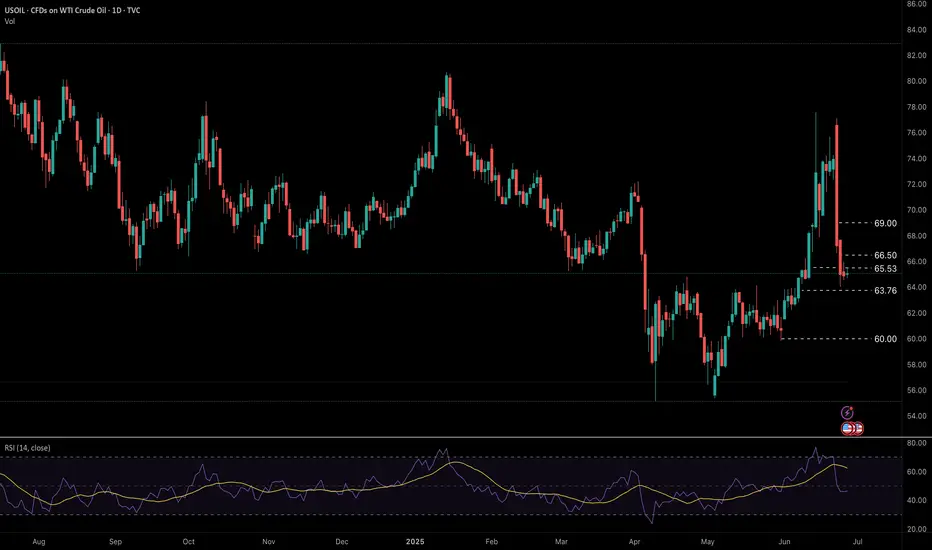
Oil volatility expected to remain on Middle East tensions.Fundamental
Oil prices remain under pressure. Volatility is expected to remain elevated as traders digest inventory data, watch for geopolitical shifts, and anticipate the upcoming OPEC+ meeting on July 6, where supply policy could change.
Technical
Technical indicators remain strongly bearish with RSI favouring further downside below pivot level 65.53 toward support levels at 63.76 and 60.00. A break above 65.53 sees a move towards resistance levels at 66.50 and 69.00 subsequently
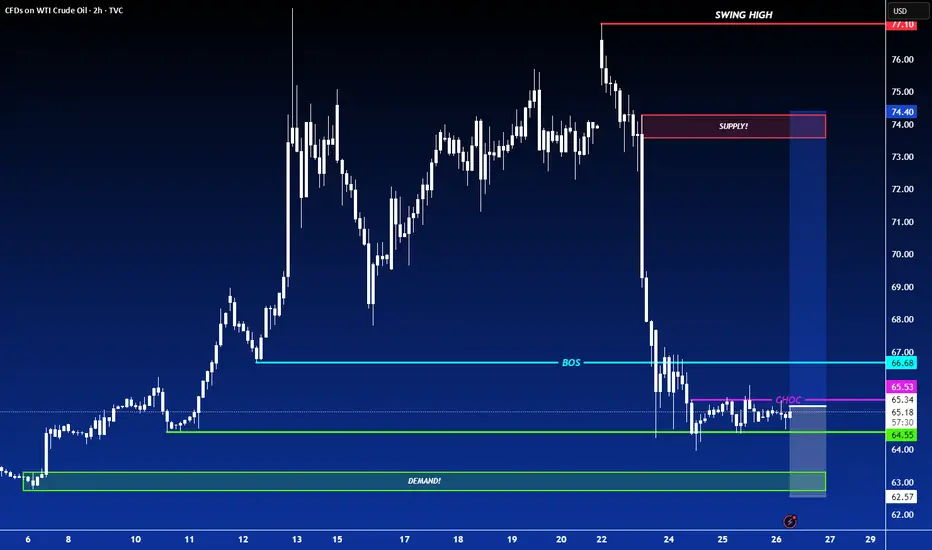
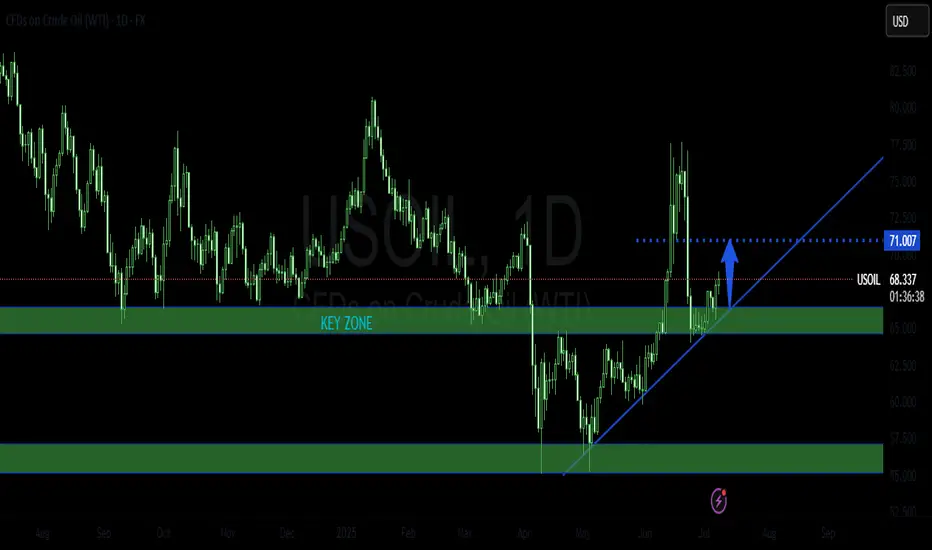
LONG ON OILUSOIL is consolidating at a major demand area.
We have a small choc (change of character) from down to up on the lower timeframe.
I will be buying oil to the next supply level looking to catch 500-1000 pips.
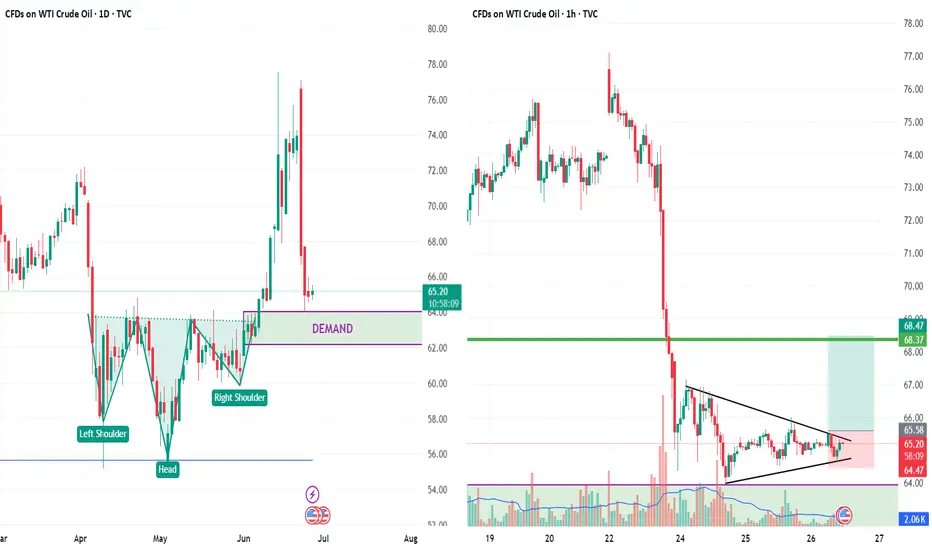
falling wedge formation on 1 Hr chartCrude oil is forming a falling wedge pattern on 1 hr time frame after retesting daily head and shoulder pattern and demand zone.
Breakout level 65.6
stoploss 64.4
target 68.3
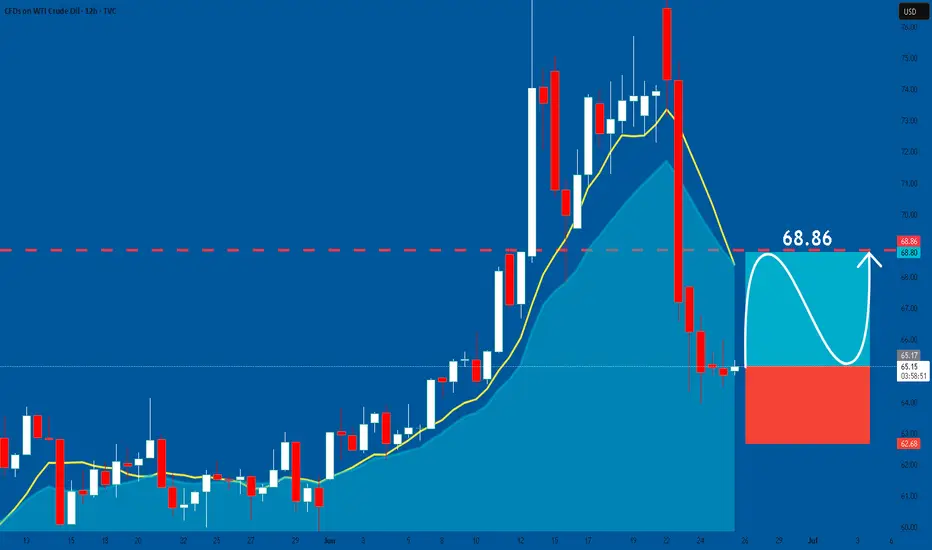
USOIL: Bullish Correction Ahead! Buy!
USOIL
- Classic bullish correction formation
- Our team expects growth
SUGGESTED TRADE:
Swing Trade
Buy USOIL
Entry Level - 65.16
Sl - 62.68
Tp - 68.86
Our Risk - 1%
Start protection of your profits from lower levels
Disclosure: I am part of Trade Nation's Influencer program and receive a monthly fee for using their TradingView charts in my analysis.
❤️ Please, support our work with like & comment! ❤️
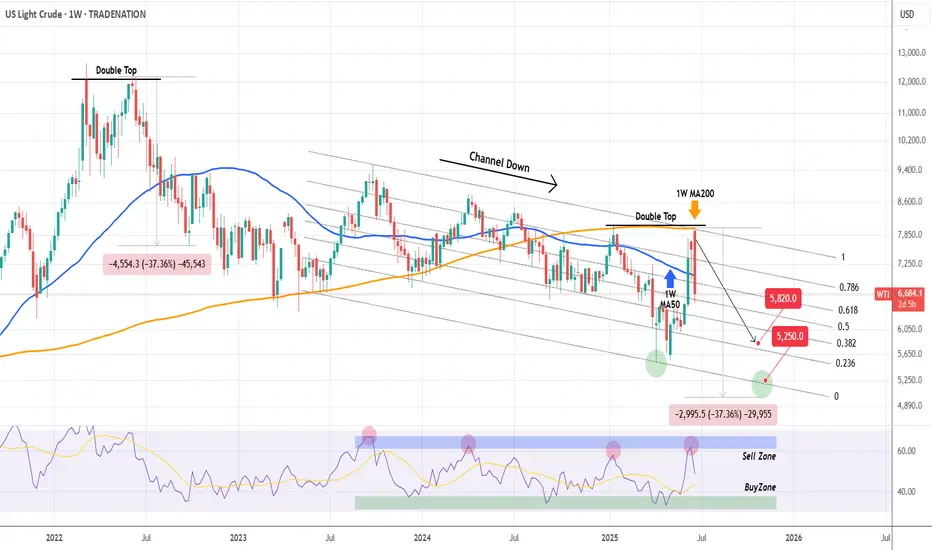
WTI OIL Progressively bearish on the long-term. Eyes $52.50.A week has passed since our sell signal on WTI Oil (USOIL) and the emerging geopolitical stability has already helped the price move much faster towards our $58.20 Target (see chart in related ideas below).
If we look at it from an even longer term perspective, the 1W time-frame in particular, we can see draw some very useful conclusions about the bearish case. First of all that this week's High got rejected exactly on the 1W MA200 (orange trend-line), which is the trend-line that made the last 3 major rejections on the market (January 13 2025, October 07 2024).
As you can see, that was a textbook Double Top formation. The last Double Top rejection took place on June 06 2022, the previous multi-year Top for the market. The result was a continued sell-off that didn't stop before testing the 1W MA200, which is now the Resistance.
As a result, even though our $58.20 Target stands, on the longer term we can even see a -37.36% decline towards the end of the year. Contact with the bottom of the Channel Down can be made at $52.50.
Alternatively, you can look at the 1W RSI, which has a clear Sell and clear Buy Zone. This week it was rejected on the Sell Zone, so you may look to book your profit as soon as it enters the Buy Zone.
-------------------------------------------------------------------------------
** Please LIKE 👍, FOLLOW ✅, SHARE 🙌 and COMMENT ✍ if you enjoy this idea! Also share your ideas and charts in the comments section below! This is best way to keep it relevant, support us, keep the content here free and allow the idea to reach as many people as possible. **
-------------------------------------------------------------------------------
Disclosure: I am part of Trade Nation's Influencer program and receive a monthly fee for using their TradingView charts in my analysis.
💸💸💸💸💸💸
👇 👇 👇 👇 👇 👇
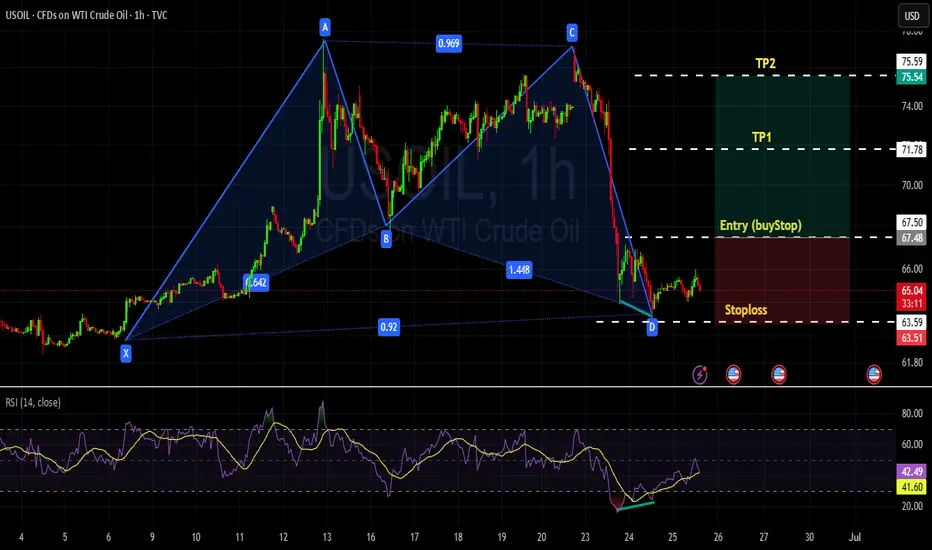
USOIL - REVERSAL Market is in bearish trend, however there is a bullish divergence on 1H time- which means market may take a deep correction. Futher harmonic pattern Bullish crab is also in formation.
Take the entry above the break of LH and stoploss below the D point / LL. and TPs with R:R ratio of 1:1 and 1:2
Thanks.
Bulish oil WTI)
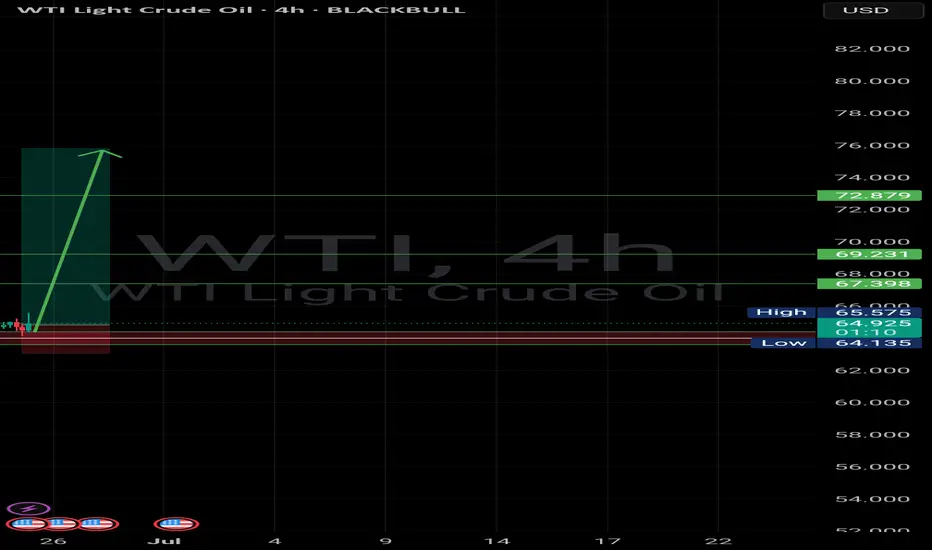
✅ Overall Market Structure:
After a steady bullish trend, price has experienced a sharp drop and is now reacting to a demand zone around 64.955. The recent price action suggests signs of potential stabilization and a possible bullish reversal.
---
🟩 Key Levels:
Major Support Zone:
The area between 64.00 – 65.00 acts as a strong demand zone, which has shown prior reactions.
Resistance / Target Levels:
67.398 (first resistance and short-term target)
69.231 (mid-level resistance)
72.879 (main target if bullish momentum continues)
---
📈 Bullish Scenario (Most Probable Based on Current Chart):
After touching the demand zone, price seems to be forming a potential bottom. If a strong bullish candlestick appears (such as a bullish engulfing or hammer), we can expect a corrective or impulsive move to the upside.
🔸 Suggested Stop-Loss: Below 63.80
🔸 Target 1: 67.40
🔸 Target 2: 69.20
🔸 Target 3: 72.80
---
⚠️ Important Notes:
1. Wait for bullish confirmation before entering a trade.
2. If the support at 64 breaks, price may drop further toward the next demand zone around 61.00–60.00 (next major support lies at 59.415).
3. Keep an eye on oil-related news and U.S. economic reports (noted with calendar icons on the chart), as they can strongly impact volatility.
---
WTI USOILKey Factors Affecting US Oil Prices Today:
Geopolitical Developments:
Oil prices had surged earlier in June due to US airstrikes on Iranian nuclear sites and fears of supply disruptions through the Strait of Hormuz. However, prices fell sharply after a ceasefire was announced between Israel and Iran, easing immediate supply concerns.
Inventory Data:
Market participants are awaiting US crude and fuel inventory reports. Recent data showed a significant drawdown in US crude stocks, supporting prices despite geopolitical easing.
Demand Signals:
US refinery utilization has increased, and gasoline demand is near multi-year highs, indicating strong domestic consumption that underpins oil prices.
Market Sentiment:
After a recent two-day plunge (Brent fell over 6%), oil prices are recovering as investors reassess the durability of the ceasefire and ongoing demand fundamentals.

• close prices • EMA 50 • EMA 200time close EMA50 EMA200
2025-06-19 21:25:12.549789 72.14901424590337 72.14901424590337 72.14901424590337
2025-06-20 01:25:12.549789 72.10753495555201 72.12785980782418 72.12817090250181
2025-06-20 05:25:12.549789 72.30184151698222 72.18818862071848 72.18664096938144
2025-06-20 09:25:12.549789 72.75875047390463 72.33949929722188 72.33182087158828
2025-06-20 13:25:12.549789 72.68850446148763 72.41499378197972 72.40459142161178
2025-06-20 17:25:12.549789 72.61826337440287 72.45234831244049 72.44109961879877
2025-06-20 21:25:12.549789 73.0920272190551 72.55505461411224 72.53690209467362
2025-06-21 01:25:12.549789 73.32225763780096 72.66490629604796 72.63854165130137
2025-06-21 05:25:12.549789 73.18141532202048 72.73189745073235 72.7013017237441
2025-06-21 09:25:12.549789 73.34418333509628 72.80472143296298 72.7685212246802
2025-06-21 13:25:12.549789 73.20515802725252 72.84883192568134 72.81022980707691
2025-06-21 17:25:12.549789 73.06543910118145 72.87111195319427 72.83268634979835
2025-06-21 21:25:12.549789 73.13802778265126 72.89692392267146 72.85760911952539
2025-06-22 01:25:12.549789 72.56404370925392 72.86648291672806 72.83525006620647
2025-06-22 05:25:12.549789 72.04656835950001 72.79522579784962 72.77891145933532
2025-06-22 09:25:12.549789 71.87788210072772 72.71913046993551 72.71827553949738
2025-06-22 13:25:12.549789 71.57403276462739 72.62812285398904 72.64544859833047
2025-06-22 17:25:12.549789 71.66830696440597 72.55479294263496 72.58642631425838
2025-06-22 21:25:12.549789 71.39589974174962 72.46942777263845 72.51796880950207
2025-06-23 01:25:12.549789 70.97220863134902 72.36281354835991 72.4331194334039
2025-06-23 05:25:12.549789 71.41190326202549 72.29720011030736 72.37947406006685
2025-06-23 09:25:12.549789 71.34417037187953 72.23334242809354 72.32730984200495
2025-06-23 13:25:12.549789 71.36442883328591 72.17669512657842 72.28068015138489
2025-06-23 17:25:12.549789 70.93700437742187 72.09792199138396 72.2180205666587
2025-06-23 21:25:12.549789 70.77368956006431 72.01577523502505 72.1530504117647
2025-06-24 01:25:12.549789 70.80696633697728 71.94246146212632 72.09454913887467
2025-06-24 05:25:12.549789 70.46166826375058 71.85453652619158 72.02588453640922
2025-06-24 09:25:12.549789 70.57437766925429 71.78002684595481 71.96674535299645
2025-06-24 13:25:12.549789 70.39418606227865 71.7008691404117 71.90458810553207
2025-06-24 17:25:12.549789 70.30667793734067 71.62263510890696 71.84324316805137
2025-06-24 21:25:12.549789 70.12616595367184 71.54005727311154 71.77914626738874
2025-06-25 01:25:12.549789 70.68184940902452 71.49344406420292 71.73927677275842
2025-06-25 05:25:12.549789 70.67780024160315 71.44980165633504 71.70170020547494
2025-06-25 09:25:12.549789 70.36048696291637 71.39233724831294 71.65539924108124
2025-06-25 13:25:12.549789 70.60725043654733 71.35147487398547 71.62008312822586
2025-06-25 17:25:12.549789 70.24099734155602 71.29440879314608 71.57469418645512
2025-06-25 21:25:12.549789 70.30365642005745 71.24410756303885 71.53380036566699
2025-06-26 01:25:12.549789 70.0 71.18166483176832 71.48552536513994
2025-06-26 05:25:12.549789 70.0 71.12300000211118 71.43975493365097
2025-06-26 09:25:12.549789 70.0 71.0678231485971 71.39630120687369
2025-06-26 13:25:12.549789 70.0 71.01587255690653 71.35499464818014
2025-06-26 17:25:12.549789 70.0 70.96691137077022 71.3156818667734
2025-06-26 21:25:12.549789 70.0 70.92072470671299 71.27822374026687
2025-06-27 01:25:12.549789 70.0 70.87711716220463 71.24249379327549
2025-06-27 05:25:12.549789 70.0 70.83591065601463 71.20837679219481
2025-06-27 09:25:12.549789 70.0 70.79694255021155 71.17576752326983
2025-06-27 13:25:12.549789 70.0 70.76006401185381 71.144569726655
2025-06-27 17:25:12.549789 70.0 70.72513857941155 71.11469516371685
2025-06-27 21:25:12.549789 70.0 70.69204090466687 71.08606279854436
2025-06-28 01:25:12.549789 70.0 70.66065564552059 71.0585980776783
2025-06-28 05:25:12.549789 70.0 70.63087648898855 71.0322322945781
2025-06-28 09:25:12.549789 70.0 70.60260528685751 71.00690202741966
2025-06-28 13:25:12.549789 70.0 70.57575128911758 70.98254864053867
2025-06-28 17:25:12.549789 70.0 70.55023046249269 70.95911784126909
2025-06-28 21:25:12.549789 70.0 70.52596488323549 70.93655928512665
2025-06-29 01:25:12.549789 70.0 70.50288219490056 70.914826223294
2025-06-29 05:25:12.549789 70.0 70.48091512311373 70.89387518721286
2025-06-29 09:25:12.549789 70.0 70.4600010404563 70.87366570580448
2025-06-29 13:25:12.549789 70.0 70.44008157551634 70.85416005144745
2025-06-29 17:25:12.549789 70.0 70.42110226095237 70.83532301135766
2025-06-29 21:25:12.549789 70.0 70.40301221609126 70.81712168145555
2025-06-30 01:25:12.549789 70.0 70.38576386015987 70.79952528018171
2025-06-30 05:25:12.549789 70.0 70.3693126527457 70.78250498004435
2025-06-30 09:25:12.549789 70.0 70.35361685850748 70.76603375495921
2025-06-30 13:25:12.549789 70.0 70.3386373335235 70.75008624168116
2025-06-30 17:25:12.549789 70.0 70.32433733098235 70.734638613833
2025-06-30 21:25:12.549789 70.0 70.31068232419491 70.71966846721521
2025-07-01 01:25:12.549789 70.0 70.29763984514432 70.70515471523557
2025-07-01 05:25:12.549789 70.0 70.28517933699764 70.69107749343165
2025-07-01 09:25:12.549789 70.0 70.27327201918338 70.6774180721774
2025-07-01 13:25:12.549789 70.0 70.26189076379593 70.6641587767664
2025-07-01 17:25:12.549789 70.0 70.25100998222652 70.651282914155
2025-07-01 21:25:12.549789 70.0 70.24060552104028 70.63877470572656
2025-07-02 01:25:12.549789 70.19951966687174 70.23890629370506 70.63041595906961
2025-07-02 05:25:12.549789 70.0 70.22904673739735 70.61852747749866
2025-07-02 09:25:12.549789 70.0 70.21961345530433 70.60696617771923
2025-07-02 13:25:12.549789 70.0 70.21058645929388 70.59571929128006
2025-07-02 17:25:12.549789 70.0 70.20194682363554 70.584774704284
2025-07-02 21:25:12.549789 70.0 70.19367661861627 70.57412091596188
2025-07-03 01:25:12.549789 70.0 70.18575884907327 70.56374700035343
2025-07-03 05:25:12.549789 70.0 70.17817739742021 70.5536425708266
2025-07-03 09:25:12.549789 70.0 70.17091697078459 70.54379774719311
2025-07-03 13:25:12.549789 70.0 70.1639630519104 70.53420312520113
2025-07-03 17:25:12.549789 70.0 70.1573018535141 70.52484974820709
2025-07-03 21:25:12.549789 70.0 70.15092027581036 70.51572908084717
2025-07-04 01:25:12.549789 70.0 70.14480586695127 70.50683298454561
2025-07-04 05:25:12.549789 70.0 70.13894678614567 70.49815369471222
2025-07-04 09:25:12.549789 70.0 70.13333176924691 70.48968379949446
2025-07-04 13:25:12.549789 70.0 70.12795009661627 70.48141621996214
2025-07-04 17:25:12.549789 70.0 70.12279156308632 70.47334419161301
2025-07-04 21:25:12.549789 70.0 70.11784644986412 70.46546124709783
2025-07-05 01:25:12.549789 70.0 70.11310549822791 70.45776120007217
2025-07-05 05:25:12.549789 70.0 70.10855988488392 70.45023813008982
2025-07-05 09:25:12.549789 70.0 70.1042011988606 70.44288636846066
2025-07-05 13:25:12.549789 70.0 70.10002141982869 70.43570048500163
2025-07-05 17:25:12.549789 70.0 70.09601289774427 70.4286752756158
2025-07-05 21:25:12.549789 70.0 70.09216833372056 70.42180575063973
2025-07-06 01:25:12.549789 70.0 70.08848076204222 70.41508712390431
2025-07-06 05:25:12.549789 70.0 70.08494353324225 70.40851480245853
2025-07-06 09:25:12.549789 70.0 70.0815502981687 70.40208437690985
2025-07-06 13:25:12.549789 70.0 70.07829499297343 70.39579161233848
2025-07-06 17:25:12.549789 70.0 70.07517182496115 70.38963243974601
2025-07-06 21:25:12.549789 70.0 70.07217525924105 70.38360294800226
2025-07-07 01:25:12.549789 70.0 70.0693000061285 70.37769937625674
2025-07-07 05:25:12.549789 70.0 70.06654100924747 70.3719181067837
2025-07-07 09:25:12.549789 70.0 70.06389343428887 70.3662556582322
2025-07-07 13:25:12.549789 70.0 70.06135265838256 70.3607086792548
2025-07-07 17:25:12.549789 70.0 70.05891426004442 70.35527394248999
2025-07-07 21:25:12.549789 70.0 70.05657400966251 70.34994833887603
2025-07-08 01:25:12.549789 70.0 70.05432786048891 70.344728872275
2025-07-08 05:25:12.549789 70.0 70.05217194010609 70.33961265438724
2025-07-08 09:25:12.549789 70.0 70.05010254233932 70.3345968999384
2025-07-08 13:25:12.549789 70.0 70.04811611958803 70.32967892212207
2025-07-08 17:25:12.549789 70.0 70.04620927555133 70.32485612828211
2025-07-08 21:25:12.549789 70.0 70.04437875832446 70.32012601582042
2025-07-09 01:25:12.549789 70.0 70.04262145384442 70.31548616831631
2025-07-09 05:25:12.549789 70.0 70.04093437966479 70.31093425184487
2025-07-09 09:25:12.549789 70.0 70.0393146790406 70.30646801148258
2025-07-09 13:25:12.549789 70.0 70.03775961530597 70.3020852679891
2025-07-09 17:25:12.549789 70.0 70.03626656652783 70.29778391465493

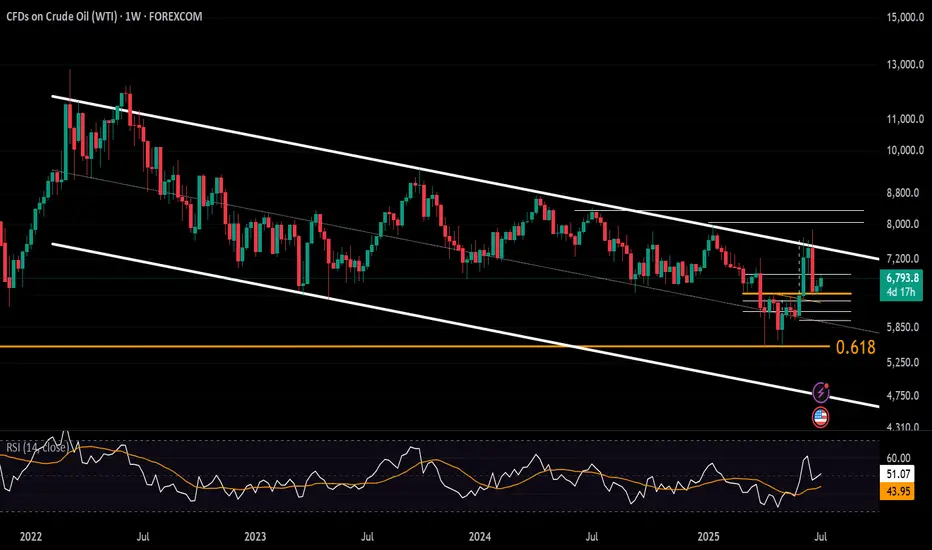
Crude Oil Eyes 3-Year Resistance Once AgainWTI has rebounded cleanly from the neckline of an inverted head-and-shoulders pattern—formed ahead of the June Middle East conflict—establishing a strong support zone above $63.40.
Prices are currently trading above $67. A sustained hold above this level could target $69 and $72, aligning with the upper edge of the 3-year declining channel. A confirmed breakout above $72 may extend gains toward $78, $80, $84, and $88 respectively.
On the downside, a close below $63.80 may trigger renewed selling pressure toward $60, $58, and $56—within the mid-zone of the broader down trending channel.
- Razan Hilal, CMT
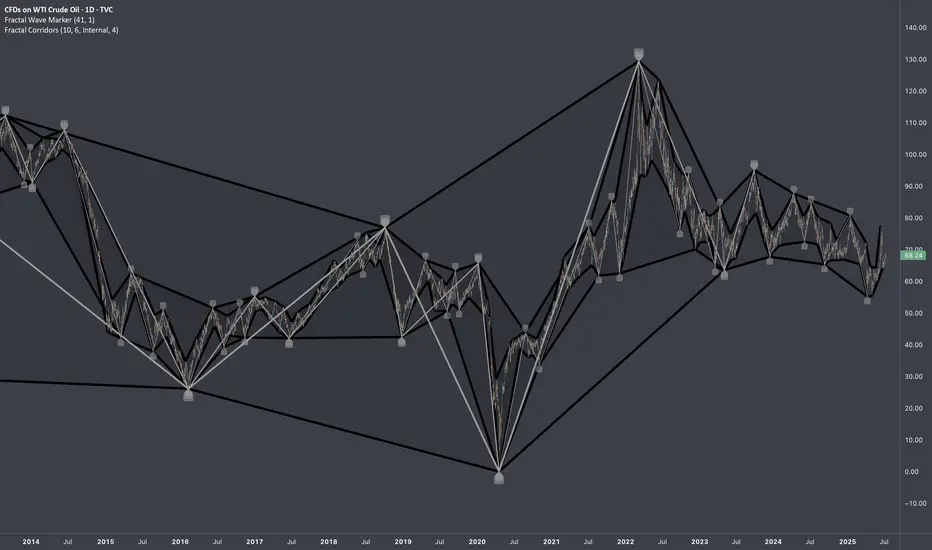
USOIL: Historic Full CyclesResearch Notes
Documenting historic examples of fractal loops for future references and research.
Fractal full cycles
70's; 80's; 90's
Late 90's & Early 00's
00's
10's
10's & 20's
USOILWTI oil Prices are supported by supply cuts and production adjustments but tempered by inventory levels and economic concerns.
The market remains sensitive to geopolitical developments, OPEC+ policies, and US economic data.
CRUDE OIL WTI LONG TRADE PLANThe instrument is trading in a global bull trend. It recently retested a strong confluence area. From this zone I expect the bullish rally to continue.
Please do your own analysis before placing any trades.
Cheers and Happy Trading !!!
OIL: Sideways - Waiting for R2/S2 BreakoutsOil has been in a clear sideways consolidation for several days, reflecting a period of indecision in the market. While this tight range holds, a patient approach to trading is warranted. A long position will be considered if a confirmed breakout and sustained price action above R2 occur, indicating strong bullish momentum. Conversely, if oil breaks down and holds below S2, a short position will be initiated, anticipating further bearish movement. This current consolidation phase suggests a significant directional move is likely imminent, and observation of these key resistance and support levels will be crucial for entry signals.