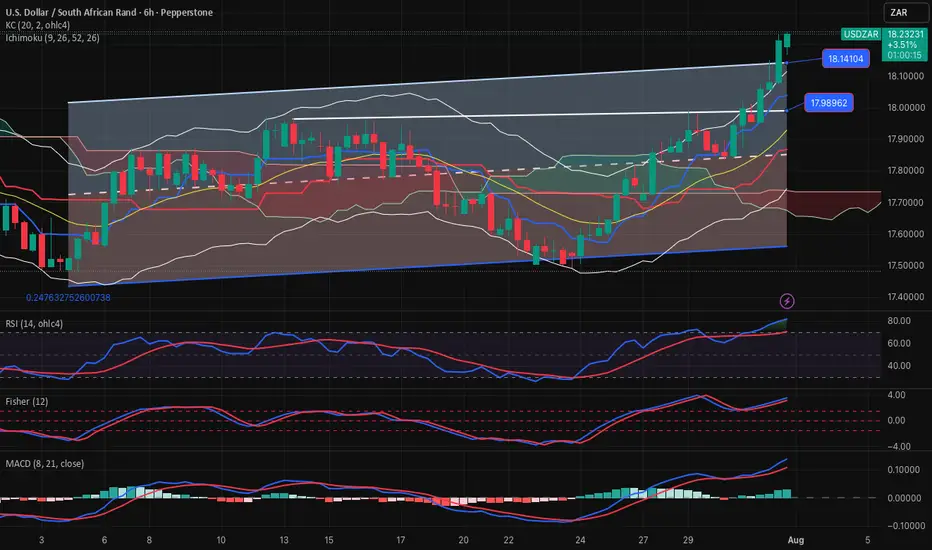
USDZAR-SELL strategy 6 hourly chart Reg. ChannelSame as the USDX of course, the pair is overbought. i felt yesterday we may see higher, but was not convinced to belong, however, we can add to our SELL, or have SELL position up here. The Reg. Channel is violated amidst this overbought status provides a good warning of potential corrective action.
About U.S. Dollar / South African Rand
The U.S. Dollar vs. the South African Rand. The Rand was and became legal tender in the late 50’s to early 60’s for South Africa, Swaziland, Lesotho and Namibia after moving away from the Pound. After the apartheid era sanctions the Rand experienced a great deal of volatility and depreciation.
Related currencies
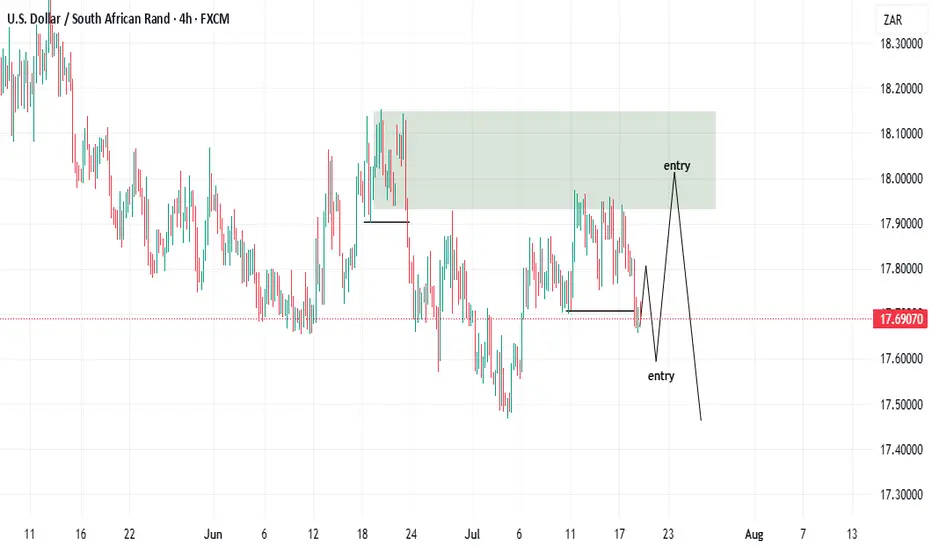
buy then sell!Hello all. I had a time to check some other pairs as USDZAR. I don't trade this pair but for who wants to trade, I think there is a very good OPP. to go buy and sell one after another. be happy(wink)
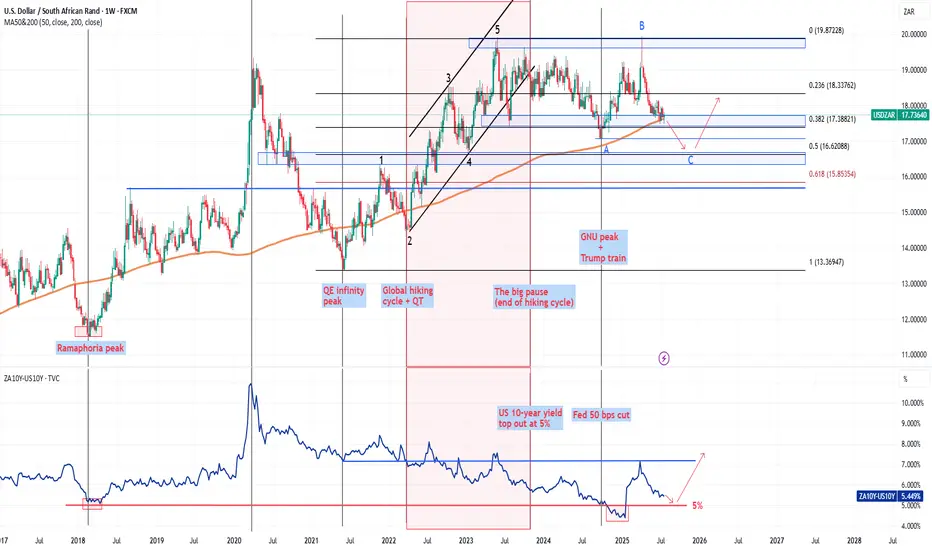
The dance between the USDZAR and (ZA10Y - US10Y)The chart shows the relationship between the USDZAR and the yield differential between the SA 10-year and the US 10-year (ZA10Y – US10Y).
2025 has been a wild ride for the rand and it has managed to put up a remarkable recovery in the 2Q2025 but where to now for the pair? The pair has not traded be
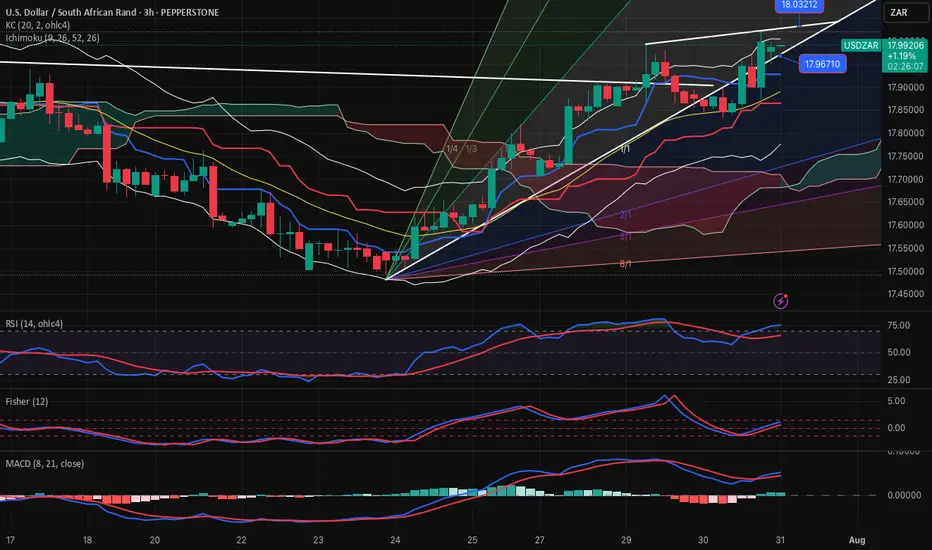
USD-ZAR-NEUTRAL RANGE 3 hourly chartThe pair is locked in between the large range 17.60-17.90 and we are consolidating within this range.
For now I prefer to play from range side, and will buy or sell near the bottom or top of it.
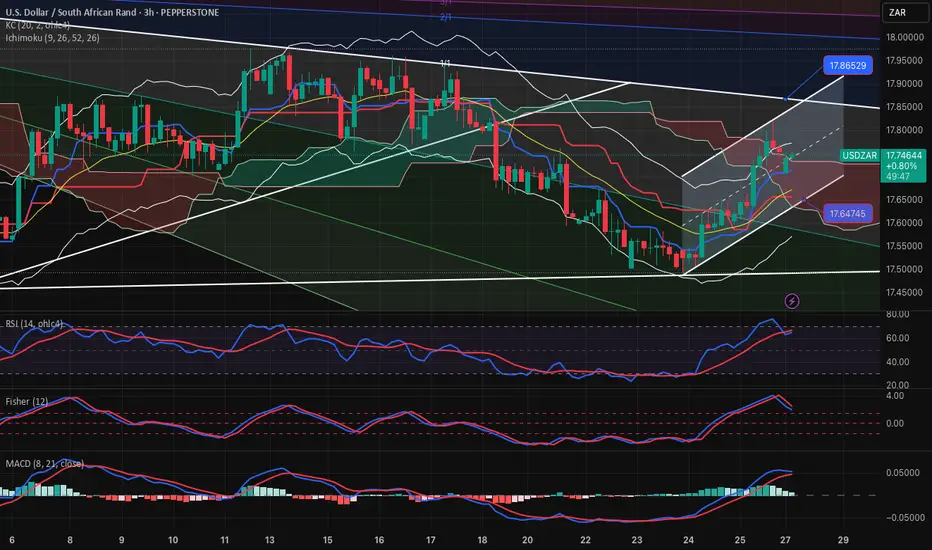
USDZAR-SELL strategy 3 hourly chart GANNThe pair has upward pressure and I suspect we will see little higher. Perhaps we may touch near 18.0500-18.0975 area, before selling pressure may set in. Since we have established 17.8500 area, it is wise to wait for the SELL. We are approaching overbought levels.
Strategy SELL @ 18.0650-18.1150 a
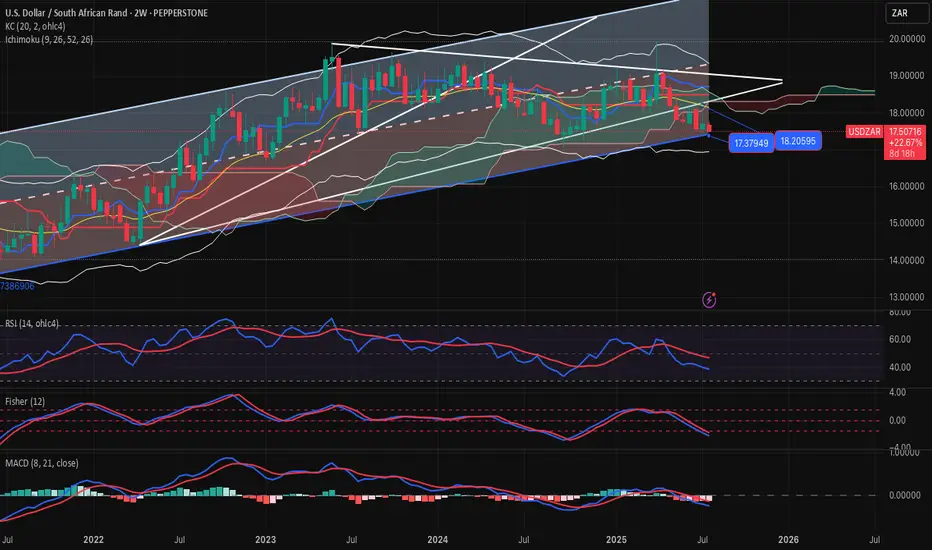
USDZAR-BUY strategy 2-weekly chart Reg. ChannelThe pair is overall on negative mode long-term basis. However, judging the bottom of the channel 17.3700 area or slightly below, BUY entry might look interesting for a recovery medium-term.
Gold is under pressure4 again and medium-term is is overbought, considering that, the pair may find benefit m
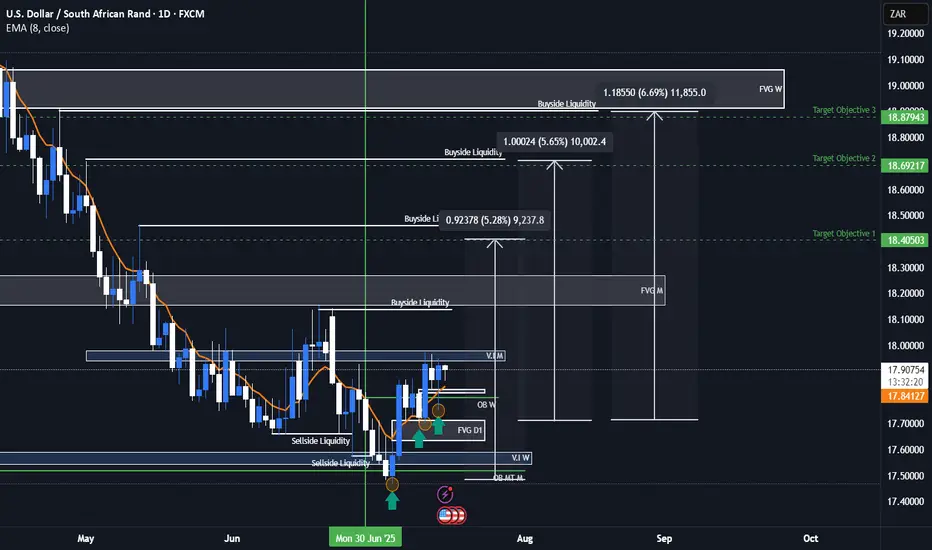
USDZAR Bullish ideaAs we can see this is our USDZAR quarterly shift idea were we are anticipating price to rally to the upside toward our draw on liquidity objectives. We had a weekly volume imbalance and monthly mean threshold order block show us support after we took out major liquidity points. We also showed more s

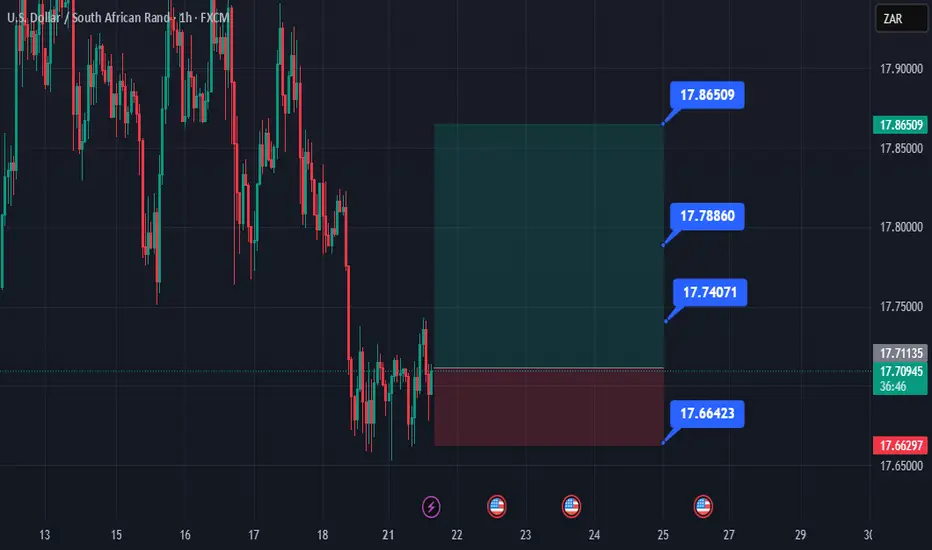
A bullish reversal , price broke structure to the upside Price is currently at premium price on a bigger TF and on H4 we see bearish trend violated and retraced back to premium price range

See all ideas
Summarizing what the indicators are suggesting.
Oscillators
Neutral
SellBuy
Strong sellStrong buy
Strong sellSellNeutralBuyStrong buy
Oscillators
Neutral
SellBuy
Strong sellStrong buy
Strong sellSellNeutralBuyStrong buy
Summary
Neutral
SellBuy
Strong sellStrong buy
Strong sellSellNeutralBuyStrong buy
Summary
Neutral
SellBuy
Strong sellStrong buy
Strong sellSellNeutralBuyStrong buy
Summary
Neutral
SellBuy
Strong sellStrong buy
Strong sellSellNeutralBuyStrong buy
Moving Averages
Neutral
SellBuy
Strong sellStrong buy
Strong sellSellNeutralBuyStrong buy
Moving Averages
Neutral
SellBuy
Strong sellStrong buy
Strong sellSellNeutralBuyStrong buy
Displays a symbol's price movements over previous years to identify recurring trends.
Frequently Asked Questions
The current rate of USDZAR is 18.02740 ZAR — it has decreased by −0.99% in the past 24 hours. See more of USDZAR rate dynamics on the detailed chart.
The value of the USDZAR pair is quoted as 1 USD per x ZAR. For example, if the pair is trading at 1.50, it means it takes 1.5 ZAR to buy 1 USD.
The term volatility describes the risk related to the changes in an asset's value. USDZAR has the volatility rating of 1.98%. Track all currencies' changes with our live Forex Heatmap and prepare for markets volatility.
The USDZAR showed a 2.37% rise over the past week, the month change is a 2.67% rise, and over the last year it has decreased by −1.06%. Track live rate changes on the USDZAR chart.
Learn how you can make money on rate changes in numerous trading ideas created by our community.
Learn how you can make money on rate changes in numerous trading ideas created by our community.
Currencies are usually traded through forex brokers — choose the one that suits your needs and go ahead. You can trade USDZAR right from TradingView charts — just log in to you broker account. Check out the list of our integrated brokers and find the best one for your needs and strategy.
When deciding to buy or sell currency one should keep in mind many factors including current geopolitical situation, interest rates, and other. But before plunging into a deep research, you can start with USDZAR technical analysis. The technical rating for the pair is neutral today, but don't forget that markets can be very unstable, so don't stop here. According to our 1 week rating the USDZAR shows the neutral signal, and 1 month rating is neutral. See more of USDZAR technicals for a more comprehensive analysis.