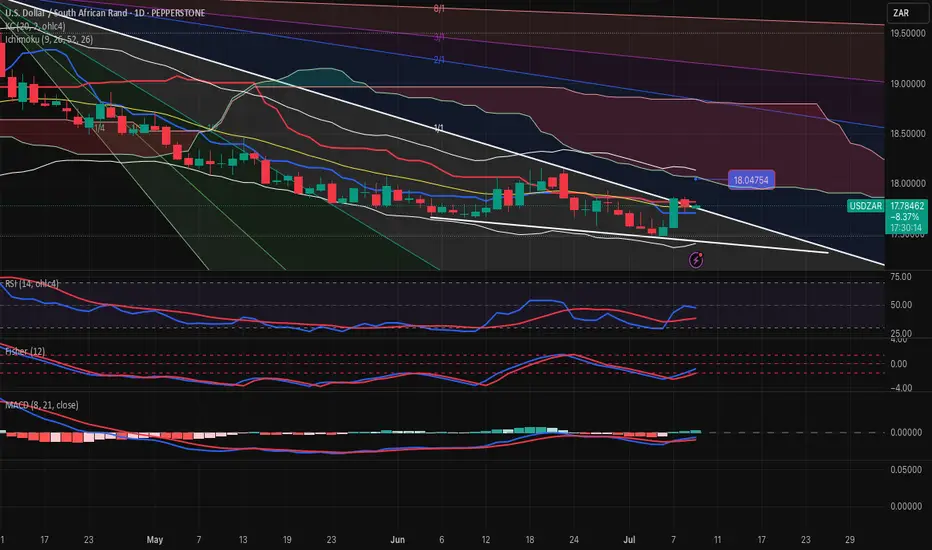
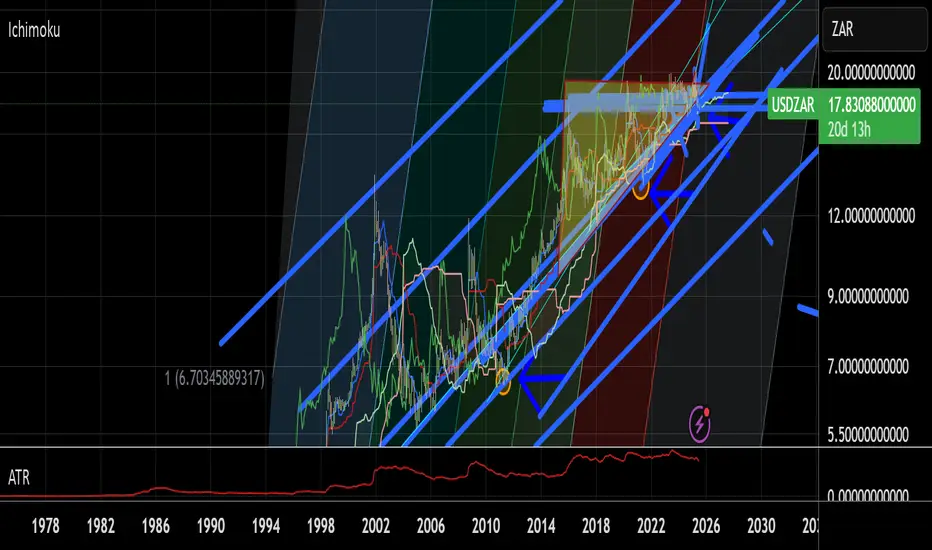
USDZAR-BUY strategy Daily chart GANNThe short-term shows some weakness, but some of the models I use, provide support for higher levels. The daily chart shows we may see a move back towards 18.0400 CLOUD area.
Strategy BUY @ 17.7350-17.7650 and take profit @ 18.0250 for now.
USDZAR trade ideas
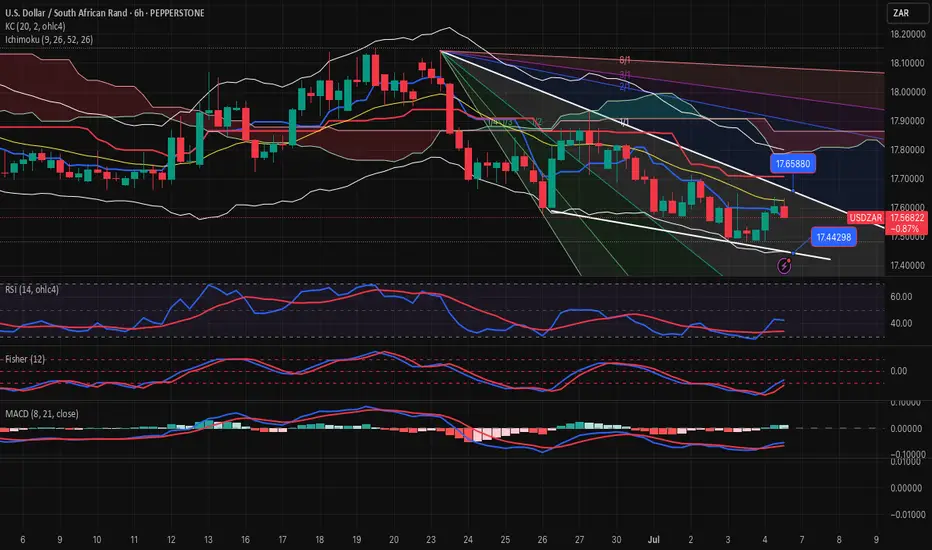
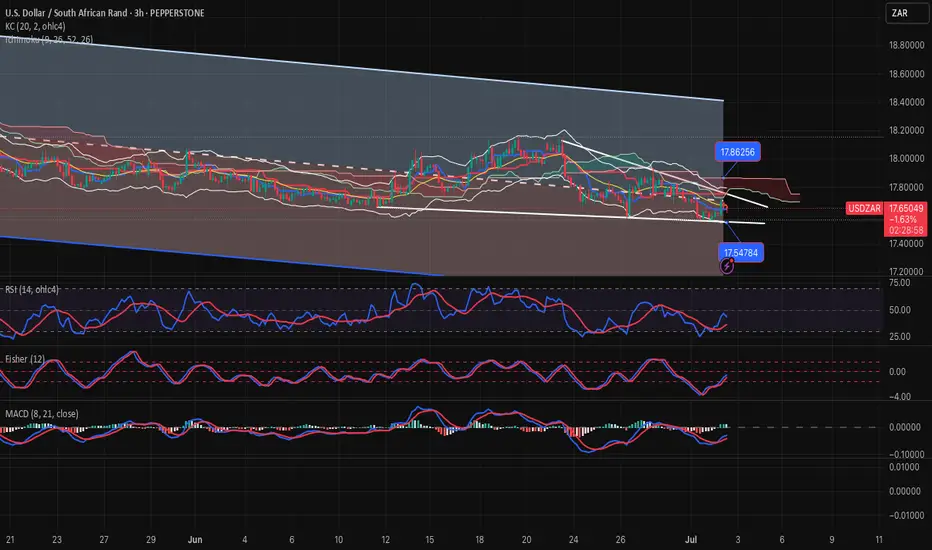
USDZAR-SELL strategy 6 hourly chartThere is selling pressure within a descending wedge, which means over-time we will see recovery. For now though short-term time frames are negative and likely we may see 17.4500 test.
Strategy SELL @ 17.5500-17.5975 and take profit near 17.4500.
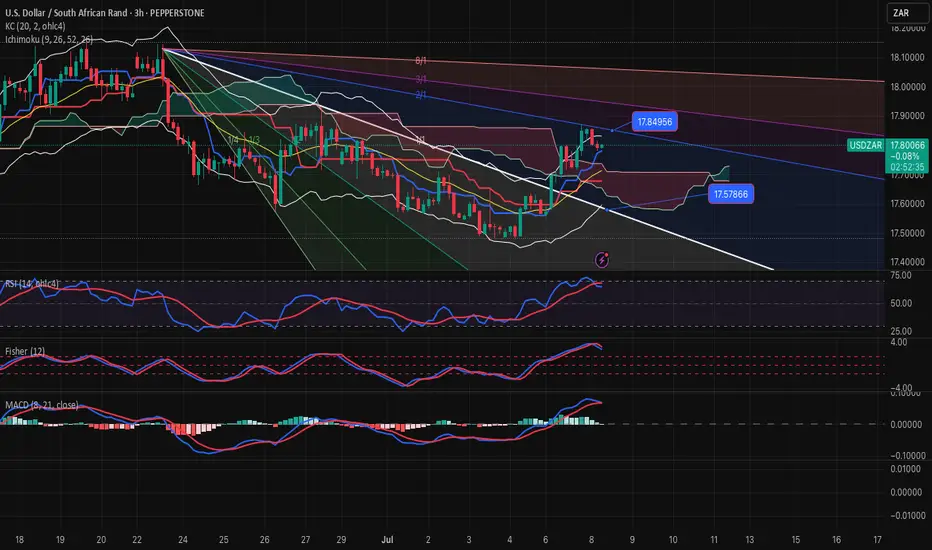
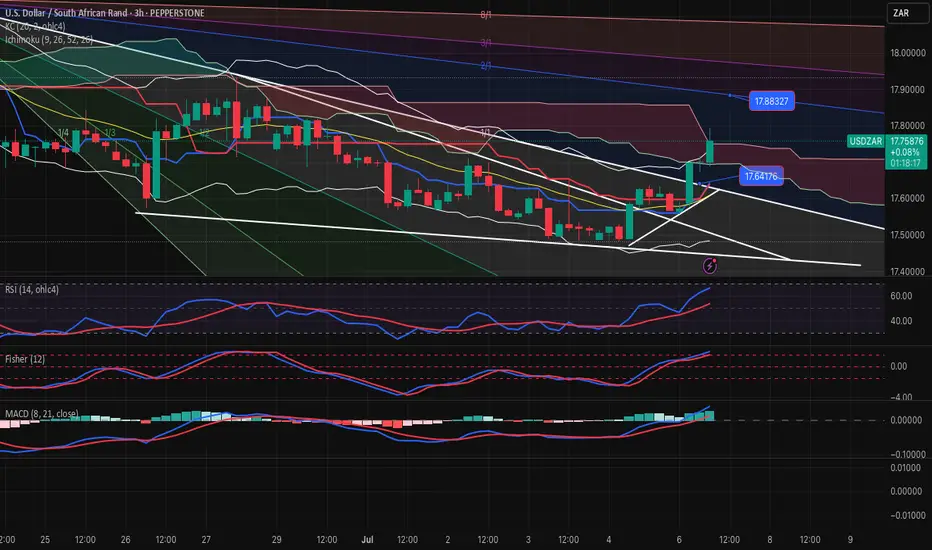
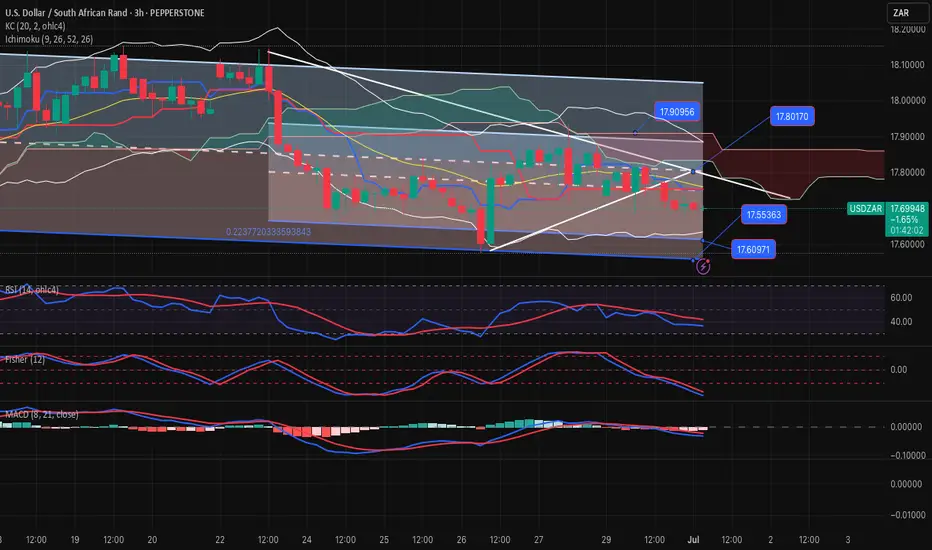
USDZAR-SELL strategy 3 Hourly chart GANNThe pair has some resistance near 17.8500 area, and we are little negative for some indicators. The move lower will be minor and should not carry high expectation of large decline. I think we are building towards sharper move higher in the medium0term.
Strategy sell @ 17.7850-17.8350 and take profit near 17.6750.
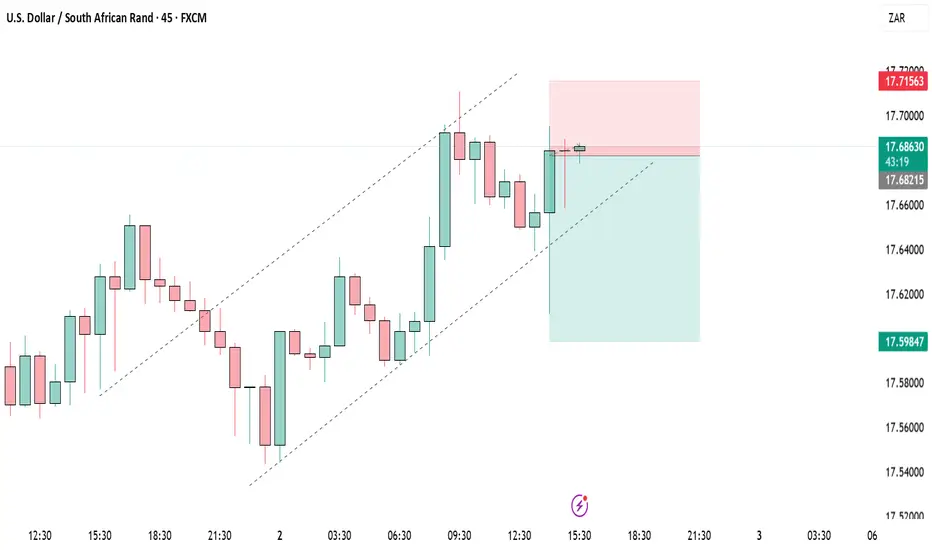
USDZAR-BUY strategy 3 hourly chartThe pair was not able to move lower, and broke 17.6400 area instead. The issue was negative environment, and a descending wedge warning of move higher over-time. The move lower did not happen within the wedge. Gold also moved lower helping weakening of the ZAR.
Now the picture is near overbought state, but we should keep focus on BUY side lower. I feel maybe near 17.6750 -17.6900 is the buying zone for now.
Strategy BUY @ 17.6450-17.6900 and take profit near 17.8250 for now.
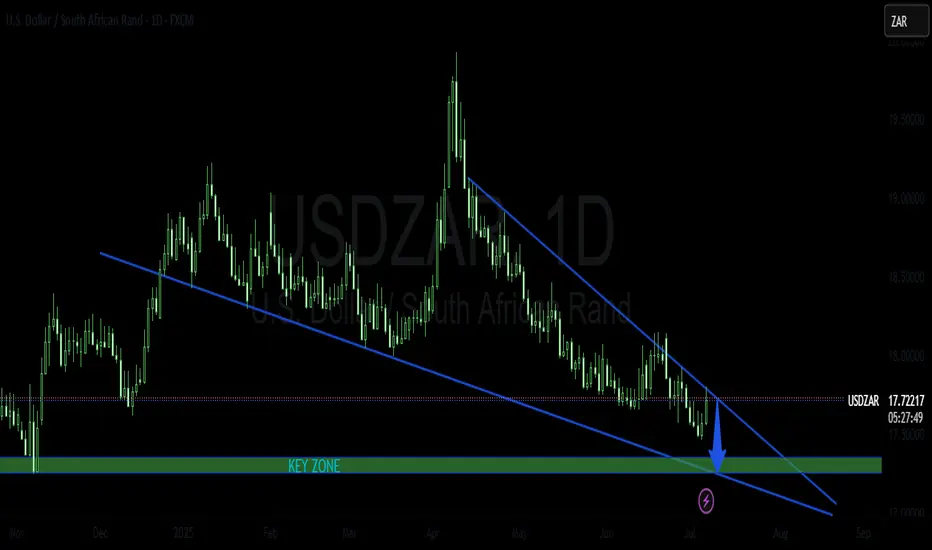
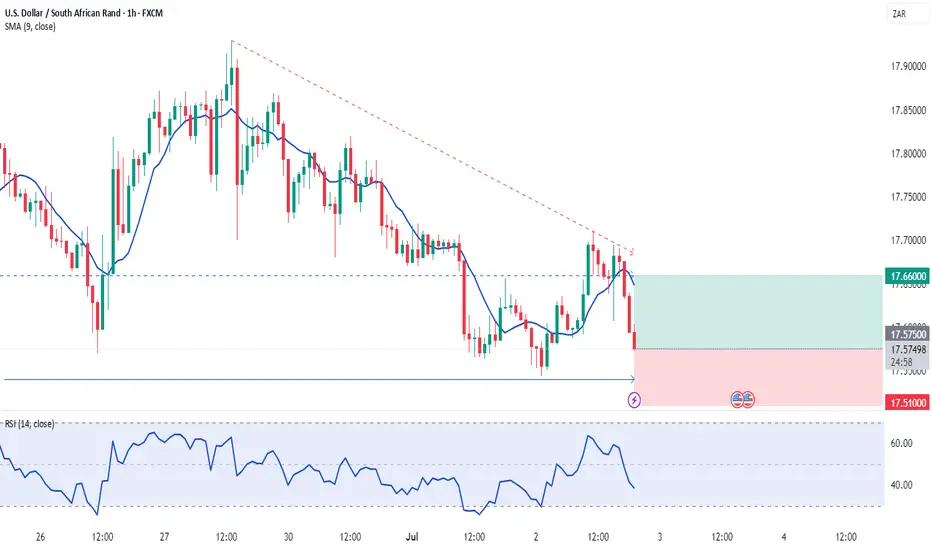
USDZAR SHORT TRADE PLANThe pair has been trading inside a bearish trend. It recently tested the boarder of the descending wedge pattern and from this point I will be looking for the reversal.
Please do your own analysis before placing any trades.
Cheers and Happy Trading !!!
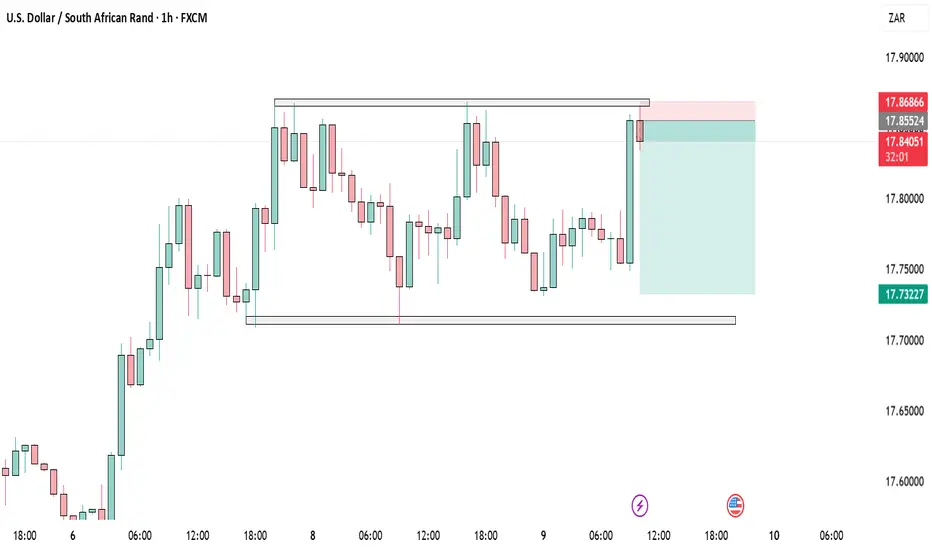
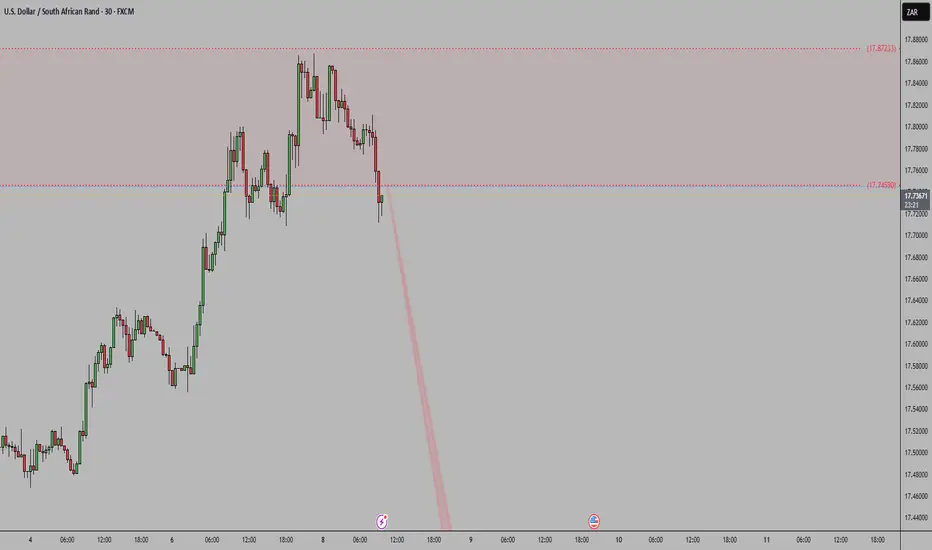
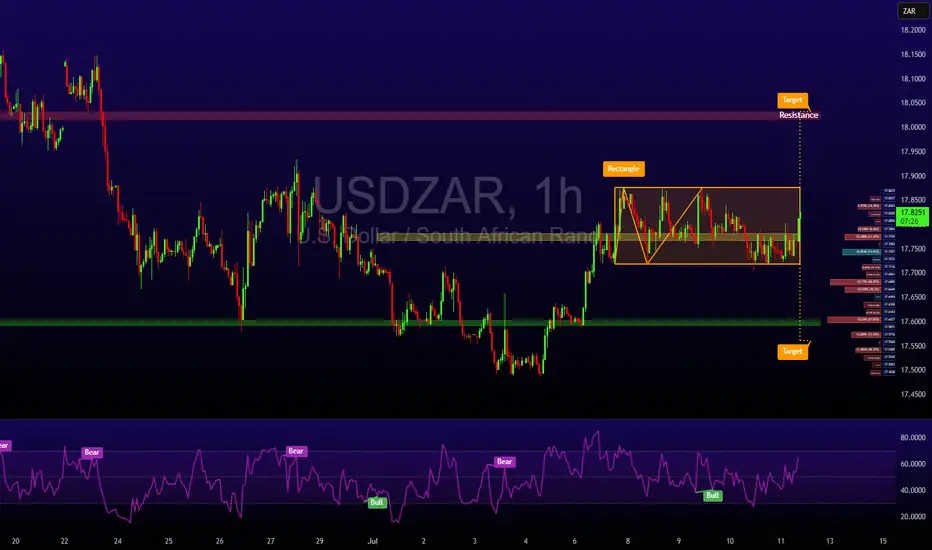
USDZAR SELLSUSDZAR price is stuck in consolidation. Price action has printed a triple top pattern indicating a strong sell signal towards the support at 17,74
USDZAR-BUY strategy 3 houely chart Reg. ChannelThe pair seems to show some strength, and think we have a chance to test 17.9150 again in the short-term. The indicators provide support as long as 17.6900 is not violated on a close.
Strategy BUY @ 17.7350-17.7550 and take profit near 17.8875.
USDZAR Long trading opportunity(swing-trading) 4I expect a swing of about 50cents-75cents all the way up to R18.10+- per dollar, expecting the ZAR to weaken in the short term within a month to a few months(maybe more than a month not more than 3 months) to 18.10+-
I am risking money.
USDZAR-BUY strategy 3 hourly chart Reg., ChannelIt feels we are in a slight buying mode today. The indicators are somewhat positive, and we have made some ground before.
Strategy BY @ 17.5875-17.6350 and take profit near 17.7875
USDZAR-NEUTRAL SELL strategy 3 hourly chart Reg. ChannelI am cautiously SELL since the trend is not strong, but likely it feels seeing lower levels. We need to retest 17.60s - 17.55s before it may become oversold short-term. GOD is firmer and this helps to support this theory for now.
Strategy SELL @ 17.7500-17.7850 and take profit near 17.6000.
SELL USDZARUSDZAR to short to nearest pivot just below the fresh low at 17,60. New York session closed negative and price will revisit that low. Enter now and when the channel breaks
USDZARSince USD is bearish and ZAR is bullish,
The USD/ZAR pair has a downward bias.
Traders are betting against the U.S. Dollar and in favor of the South African Rand so USD/ZAR may move lower (ZAR appreciation).
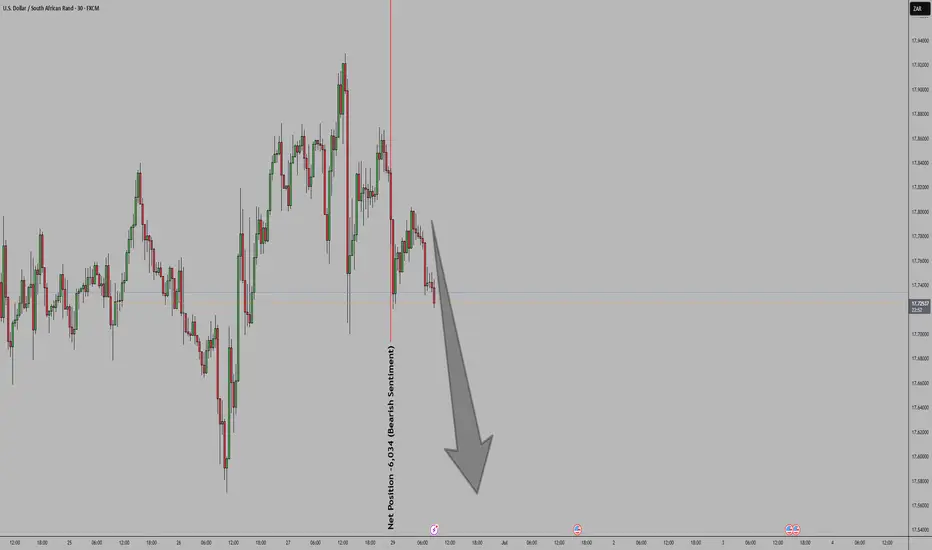
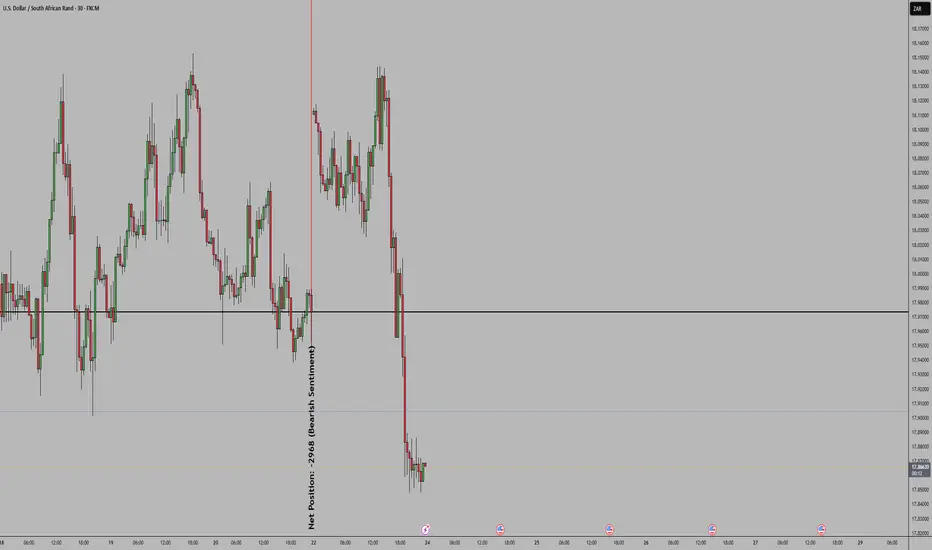
USDZARSpeculators are still net-long USDZAR, but the position is shrinking.
This suggests weakening bullish conviction → early bearish shift.
Broad USD weakness across markets (possible Fed dovishness, softer inflation, etc.).
mproved sentiment for emerging markets.
Possible support from commodities and local rate differentials. So we very bearish.
This is what 30 years of ANC government gets youWhile the ANC fills its pockets, the electorate are either too dumb or too desperate to notice. Corruption cover-up after corruption cover-up continues to blight the country.
Expect 26-28 USDZAR by 2028.
Rand Pressured but Potential Recovery on the HorizonThe U.S. Dollar Index (DXY) strengthened to 97.80 following President Trump’s announcement of sweeping new trade tariffs, including a 35% levy on Canadian imports set to begin August 1, and additional blanket duties on several other nations. This added to bullish dollar sentiment already supported by yesterday’s labour market data showing a seven-week low in U.S. unemployment claims.
With no immediate pressure on the Federal Reserve to cut interest rates, the greenback remains the currency of choice for risk-off flows. This renewed strength is placing emerging market currencies under strain, particularly the South African rand.
USD/ZAR climbed sharply, touching the 17.80 handle as investors reacted to the potential for South Africa to be included in the next wave of U.S. tariffs, possibly as high as 40%. However, local fundamentals suggest a possible reversal.
Recent South African manufacturing data beat expectations, and diplomatic engagements between President Cyril Ramaphosa and U.S. officials are providing a counterweight to the tariff headlines.
Technical View (USD/ZAR):
The currency pair is currently range-bound in a sideways channel. A breakout above resistance at 18.05 would likely extend dollar gains, while a move below 17.60 could open the door to a short-term rand recovery. Traders should be cautious and watch for clear directional confirmation.
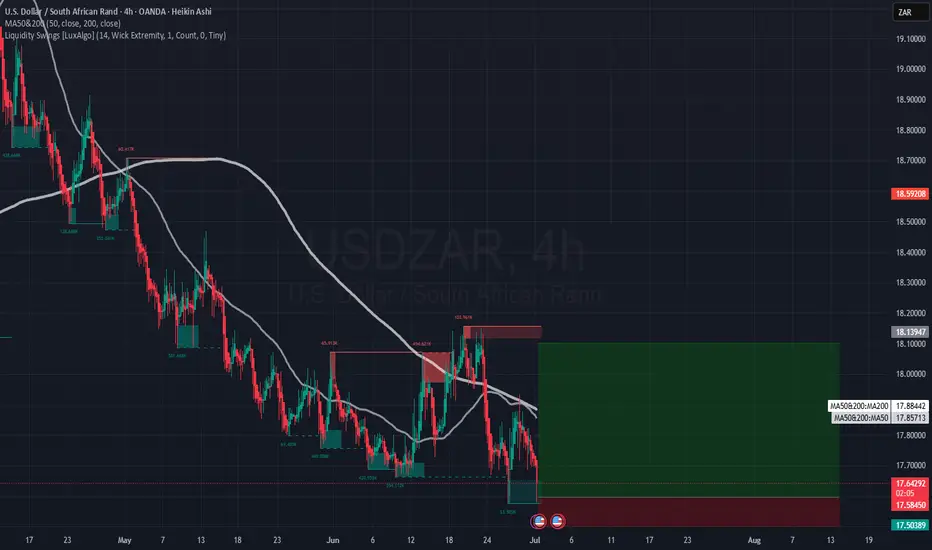
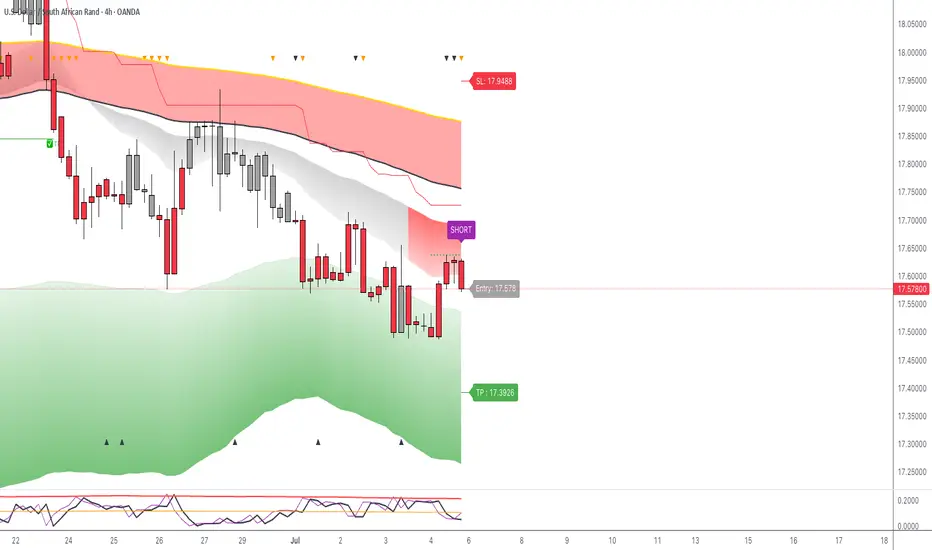
USDZAR: Sell Trigger on 4HGood morning and happy weekend everyone,
today I bring the chart of the UsdZar pair which shows a sell trigger via my LuBot Ultimate indicator which goes in favor of the short-term trend and the bearish market structure, both on the 4H and on the Daily, highlighted by the color of the candles in red.
The signal is also confirmed by the reversal signals shown above and a close below the previous 2 candles.
The indicator automatically shows exit levels that I will follow for my trade as the stop loss is far enough away to give the market room to breathe if it needs it and to avoid unnecessary stops. Stop which will subsequently be approached if the market moves in the direction of the trade.
The take profit is at the right distance given that we are close to a support zone indicated by the green area of the indicator.
Finally, the EVE indicator below has not shown any major excesses of volatility so we could still expect a strong movement before a possible reversal.
FX:USDZAR FOREXCOM:USDZAR SAXO:USDZAR FX_IDC:USDZAR OANDA:ZARJPY OANDA:EURZAR OANDA:GBPZAR OANDA:CHFZAR SAXO:AUDZAR SAXO:NZDZAR
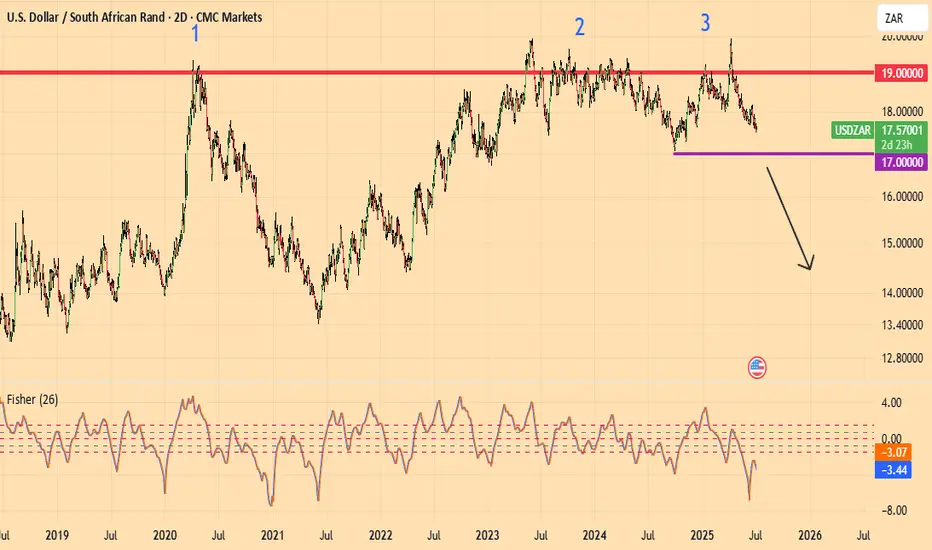
SOUTH AFRICAN RAND : bullishA triple top has formed at 19
When USDZAR falls below 17, ZAR is definitely bullish
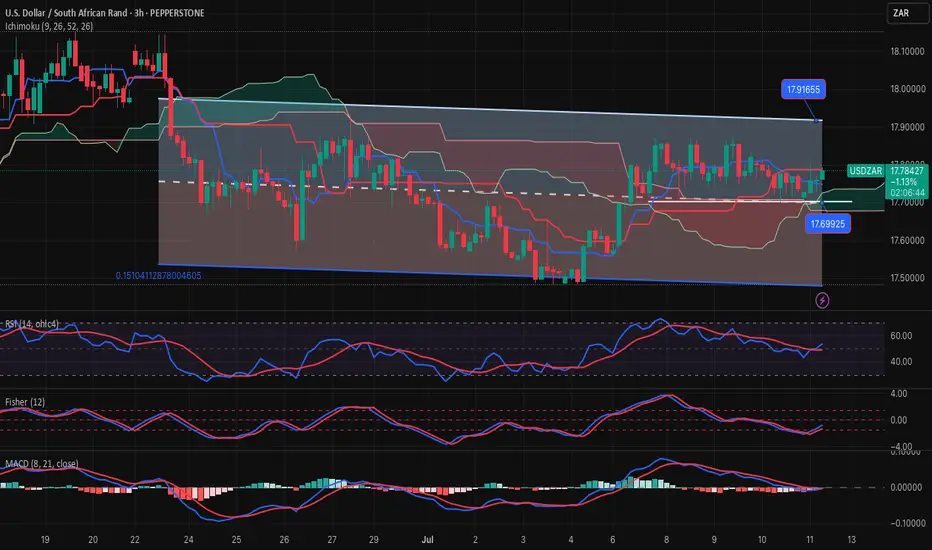
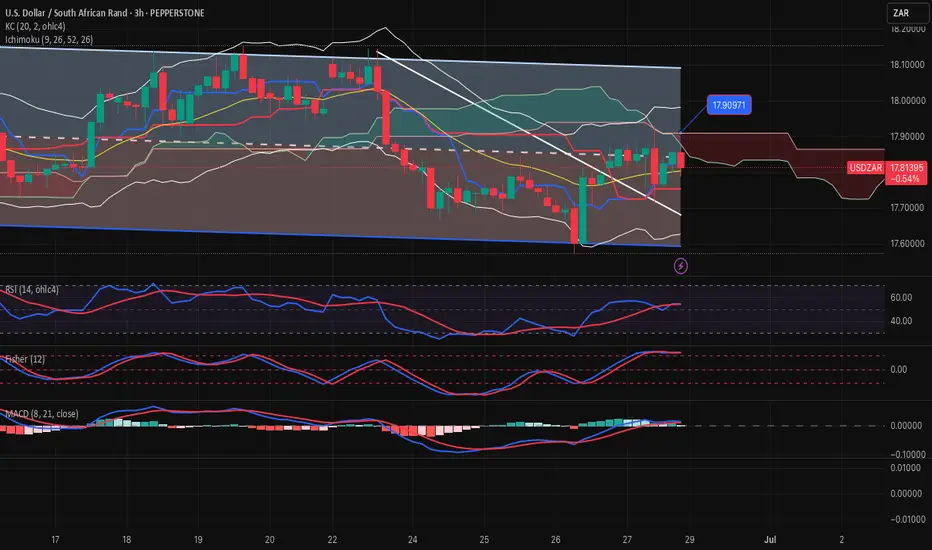
USDZAR-SELL strategy 3 hourly chart Reg.ChannelThe pair does not show a clear direction at current levels, but considering Ichimoku cloud resistance, which is important for direction, we still have downside pressure short-term.
The key resistance lies around 17.9000-17.9300.
Strategy SELL @ 17.8250-17.8650 area and tak profit near 17.6350.
Price actionUsdzar price has already broken above came back to sweep the low presented its self as a false breakout

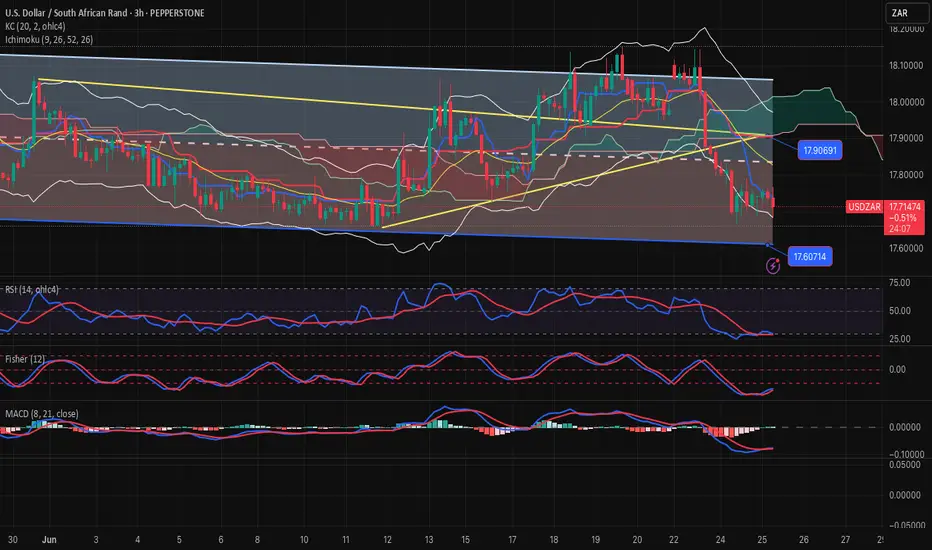
USDZAR-BUY strategy 3 Hourly chart Reg. ChannelThe pair is still under pressure, and certainly not out of negative territory. I suspect we may test down side further, especially we have moved below 17.8750 area. The channel support is 17.60s and near that level would start considering BUY entry. The indicators are slightly positive, so if one is brave enough perhaps BUY even sooner, but I prefer to BUY lower end.
Strategy BUY @ 17.5975-17.6350 and take profit near 17.9000.
For those wishing to SELL ...SELL @ 17.7500-17.8000 area and take profit near 17.6350.
USDZARCOT Report: Shows net shorts on the USD, indicating a bearish bias for USD/ZAR as institutional traders expect the ZAR to strengthen. Bias: The bearish bias