Crude oil is gaining volatilityCrude oil accelerates the momentum as the geopolitical situation escalates. Volatility is high, so trading might be dangerous both for longs and shorts, especially for day or short-term traders.
So, it would make sense to wait for a while until the “smoke goes down” and the price would establish a temporary trading range, which would later be broken to any direction.
The price currently is above the 20-day moving average for $12 in terms of asset price, which is more than 5 times greater than the average daily volatility. It either points to the “overheated” situation or potentially a momentum situation, which means the rapid continuation to the upside after a short phase of consolidation (usually 2-3 days).
Don't forget - this is just the idea, always do your own research and never forget to manage your risk!
USOIL.F trade ideas
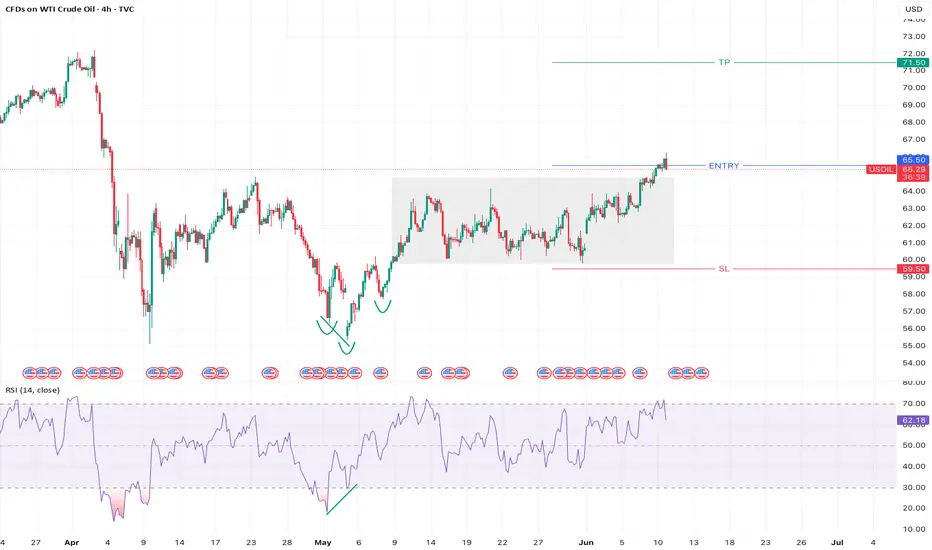
"Go long on crude oil with strong unilateral pullback"The market is weighing the impact of global trade tensions on the global crude oil demand outlook. After two days of intense consultations in London, the Asian giant and the U.S. have reached a framework agreement on restarting trade talks. U.S. Commerce Secretary Howard Lutnick said after the negotiations that the framework still needs review and approval from President Trump. Crude oil continued to rise after a pullback correction, showing a single bearish candlestick retracement pattern on the daily chart. With price supported at the MA5 level, it continues to make new highs, and this rally could target the 67.0 level.
Humans need to breathe, and perfect trading is like breathing—maintaining flexibility without needing to trade every market swing. The secret to profitable trading lies in implementing simple rules: repeating simple tasks consistently and enforcing them strictly over the long term.
Trading Strategy:
buy@64.0-64.5
TP:66.5-67.0

Bulls on the Loose: US Oil Spot/WTI Heist Strategy! 🚨💰 THE OIL VAULT HEIST: US OIL SPOT/WTI TRADING STRATEGY 💸🔫
🌟Hi! Hola! Ola! Bonjour! Hallo! Marhaba!🌟
Dear Money Makers & Robbers 🤑💰💸✈️
Based on our 🔥Thief Trading style analysis🔥 (both technical and fundamental), here’s the master plan to heist the US Oil Spot/WTI Energy Market. Follow the blueprint carefully—this strategy focuses on long entries, with a daring escape planned near the high-risk Red ATR line Zone where bearish robbers and consolidation traps await. 🏆💸 Take your profit and treat yourself, fellow traders—you earned it! 💪🏆🎉
🕵️♂️ Entry 📈
💥 The vault is wide open! Time to swipe that bullish loot—heist is on!
Place buy limit orders within the 15 or 30-minute timeframe, near swing lows/highs for pullback entries.
🛑 Stop Loss 🛑
📍 Thief’s SL—recent swing low and below the moving average (4H timeframe) for day/swing trades.
📍 Adjust SL based on risk, lot size, and number of orders.
🎯 Target
🏴☠️💥 69.000 (Aim for the big loot!) OR escape before the target
🔥 Market Heist Overview
The UK Oil Spot/Brent market is currently showing bullishness 🐂, driven by key factors—perfect for a day/scalping trade robbery! ☝☝☝
📰 Additional Tools & Analysis
📊 Get the Fundamental, Macro, COT Report, Quantitative Analysis, Sentiment Outlook, Intermarket Analysis, Future Targets—check our bi0 liinks 👉👉👉🔗🔗
⚠️ Trading Alert: News Releases & Position Management
📰 News can rattle the vault! 💥
✅ Avoid new trades during news releases.
✅ Use trailing stop-loss orders to protect profits.
💖 Supporting our heist plan?
💥 Smash the Boost Button 💥 to empower the robbery team.
Let’s make money every day in this market with the Thief Trading Style! 🏆💪🤝❤️🎉🚀
👀 Stay tuned for the next robbery plan, thieves! 🤑🐱👤🤗🤩

Heading into 61.8% Fibonacci resistance?WTI Oil (XTI/USD) is rising towards the pivot which is a pullback resistance and could drop to the 1st support.
Pivot: 66.66
1st Support: 60.10
1st Resistance: 71.18
Risk Warning:
Trading Forex and CFDs carries a high level of risk to your capital and you should only trade with money you can afford to lose. Trading Forex and CFDs may not be suitable for all investors, so please ensure that you fully understand the risks involved and seek independent advice if necessary.
Disclaimer:
The above opinions given constitute general market commentary, and do not constitute the opinion or advice of IC Markets or any form of personal or investment advice.
Any opinions, news, research, analyses, prices, other information, or links to third-party sites contained on this website are provided on an "as-is" basis, are intended only to be informative, is not an advice nor a recommendation, nor research, or a record of our trading prices, or an offer of, or solicitation for a transaction in any financial instrument and thus should not be treated as such. The information provided does not involve any specific investment objectives, financial situation and needs of any specific person who may receive it. Please be aware, that past performance is not a reliable indicator of future performance and/or results. Past Performance or Forward-looking scenarios based upon the reasonable beliefs of the third-party provider are not a guarantee of future performance. Actual results may differ materially from those anticipated in forward-looking or past performance statements. IC Markets makes no representation or warranty and assumes no liability as to the accuracy or completeness of the information provided, nor any loss arising from any investment based on a recommendation, forecast or any information supplied by any third-party.

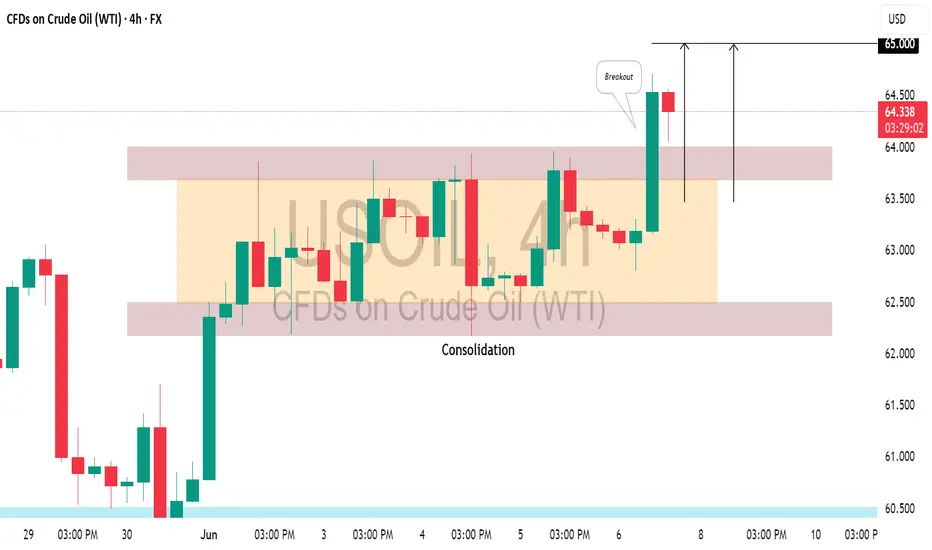
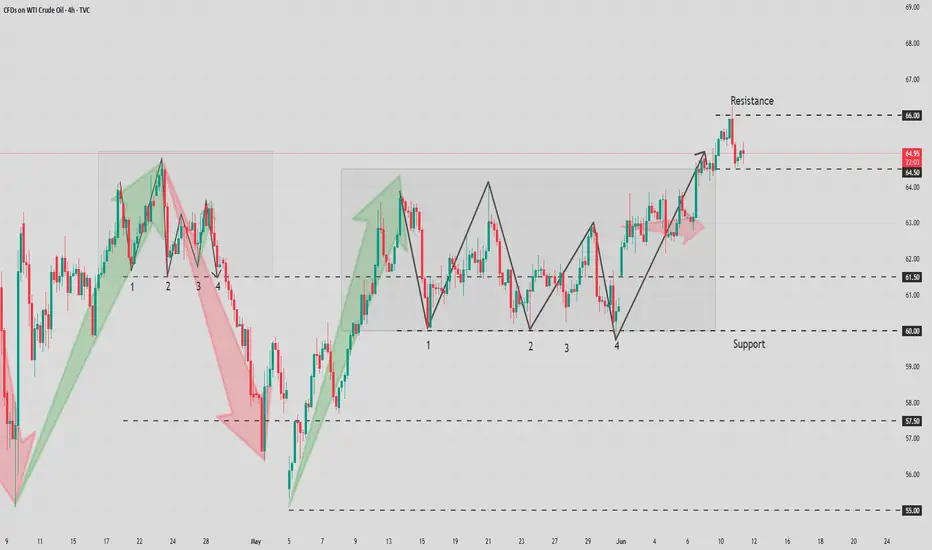
US CRUDE OIL(#WTI) : Bullish Trend Continues📈USOIL is trading in a bullish trend on a 4H time frame.
After a prolonged upward movement, it started to consolidated within a horizontal range for a while.
Recently, the resistance of this range was breached, indicating strong buyer momentum.
I believe the upward movement may persist, potentially leading the market to reach the 65.00 level soon.
Oil sellNow is key level 64.7 if break it down more fall.After all news FA for me show more bearish trend.
Crude oil rose as expected
💡Message Strategy
OPEC’s crude output increase in May was lower than required by the OPEC+ agreement, which had planned to increase production sharply last month.
The five OPEC members that pledged to cut production in the OPEC+ agreement and are now gradually lifting the cuts had to increase production by a combined 310,000 barrels per day, but according to data from oil flow tracking companies and surveys of sources at OPEC, oil companies and consultancies, they only increased production by 180,000 barrels per day.
This was because Iraq cut production to make up for a long period of overproduction, while Saudi Arabia and the UAE increased production by less than their target levels, the survey found.
Saudi Arabia had the largest increase in May compared to April. According to the survey, OPEC's largest producer and de facto leader, as well as the leader of the OPEC+ alliance, increased production by 130,000 barrels per day.
This is also one of the driving forces accelerating gold's rise
📊Technical aspects
WTI crude oil prices finally extended their upward momentum. However, crude oil prices have risen as tensions in the US-China trade war ease and global oil demand recovers from tariff-related pressures.
From the daily chart level, crude oil's medium-term trend is hovering around the moving average system, and the medium-term objective trend is mainly fluctuating and rising. Oil prices gradually rise to the upper edge of the range. From the perspective of momentum, the MACD indicator fast and slow lines cross the zero axis upward, and the bullish momentum begins to warm up. The K line closes with a small positive line continuously. If the oil price breaks through the range resistance in the later period, the medium-term trend is expected to further rise and test the 70 line
The short-term (2H) trend of crude oil continued to rise. The oil price encountered resistance near 65.40, and the K-line crossed the moving average system, and the short-term objective upward trend changed. The second large real negative line formed the main rhythm. It is expected that the crude oil trend will further fall to around 64.50 during the day, and then restart the upward momentum.
💰 Strategy Package
Long Position: 64.50-65.00,65.00-65.30

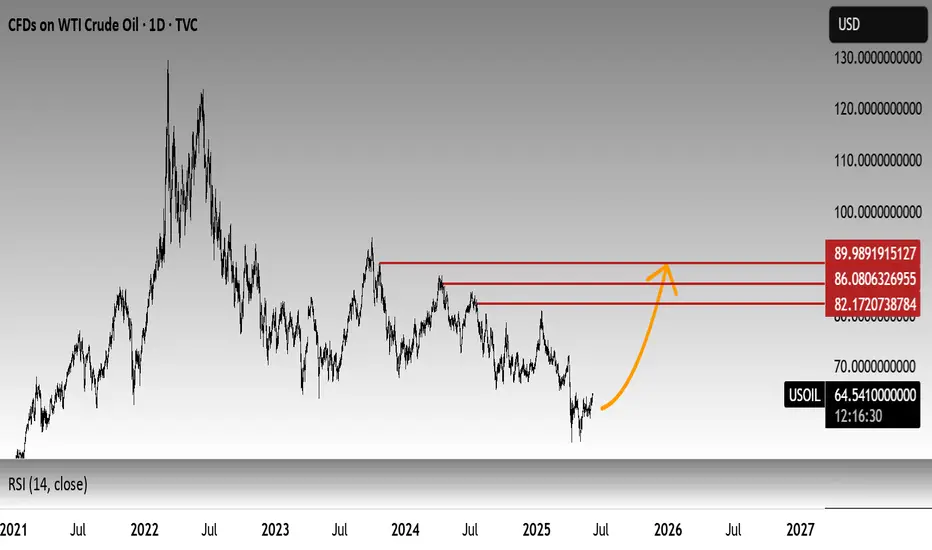
USOIL🛢️ USOIL (WTI Crude Oil) – Technical Outlook & Forecast
Current Price: $64.55
Bias: Bullish Only
Forecast Levels: $82.00 → $85.00 → $90.00+
🔍 Market Overview:
Crude oil (USOIL) is currently trading around $64.55, showing early signs of a potential bullish reversal from multi-month lows. Despite recent volatility and macroeconomic uncertainties, the technical structure indicates the formation of a solid accumulation base, potentially preparing for a significant upward move.
📈 Technical Perspective:
Price Action: Oil is attempting to reclaim key support zones that have held historically during large-scale recoveries.
Momentum: Oscillators (like RSI/MACD) may be turning up from oversold territory (subject to chart confirmation), further supporting the bullish scenario.
Volume Profile: Accumulation at lower levels hints at smart money interest around the $60–$65 zone.
🎯 Bullish Targets:
$82.00 – Psychological and technical resistance
$85.00 – Previous swing high / Fib extension zone
$90.00+ – Medium-term projection if momentum sustains
🧭 Conclusion:
The bias for USOIL remains bullish only while the $60–$62 zone holds firm as support. Breakout above near-term resistances could open the way for a strong move toward $82, $85, and even $90+. Keep an eye on macro events and inventory data for short-term volatility.
🟢 Trade Setup Idea (For Reference Only):
Long bias above $64–$65 support zone, targeting $82–$90 over the coming weeks/months. Use proper risk management.
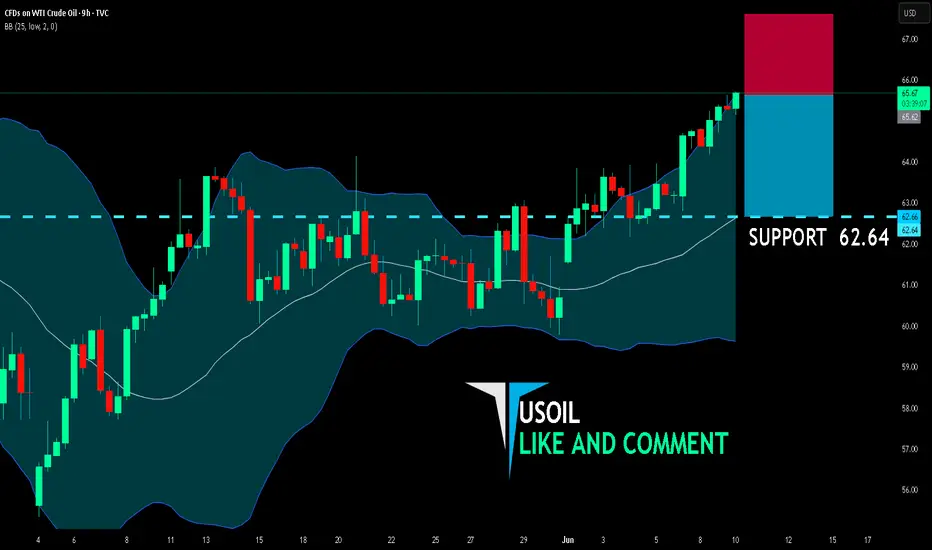
USOIL BEST PLACE TO SELL FROM|SHORT
USOIL SIGNAL
Trade Direction: short
Entry Level: 65.62
Target Level: 62.64
Stop Loss: 67.59
RISK PROFILE
Risk level: medium
Suggested risk: 1%
Timeframe: 9h
Disclosure: I am part of Trade Nation's Influencer program and receive a monthly fee for using their TradingView charts in my analysis.
✅LIKE AND COMMENT MY IDEAS✅
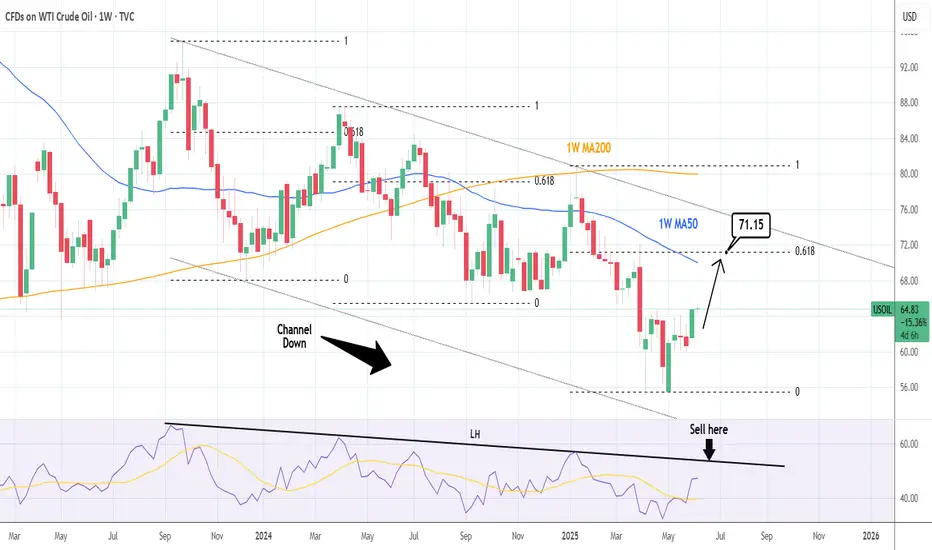
WTI CRUDE OIL: Channel Down needing to fill its top. Bullish.WTI Crude Oil turned bullish on its 1D technical outlook (RSI = 62.137, MACD = 0.740, ADX = 26.844), having completed a very strong 1W candle last week. This is the continuation of the May 5th bottom rebound. All prior such rebounds have filled at least the 1W MA50, having touched the 0.618 Fibonacci retracement level. The 1W RSI LH trendline gives a good sense of where to sell, but since the 0.618 Fib is the guide, the target is TP = 71.15.
## If you like our free content follow our profile to get more daily ideas. ##
## Comments and likes are greatly appreciated. ##
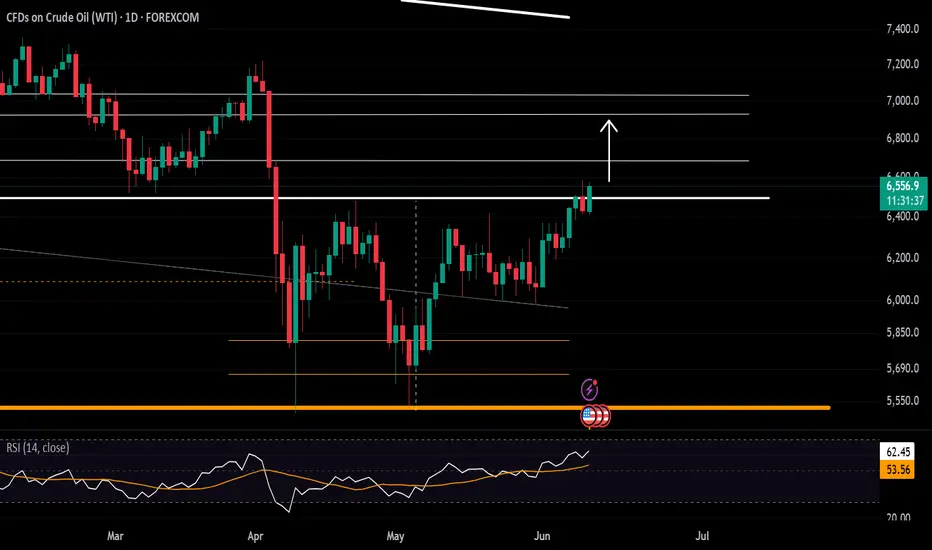
Crude Oil Surges on Summer Demand and Trade OptimismOn the weekly chart, crude oil trades above the mid-range of a descending channel that has been in place since the 2022 highs. The RSI remains just below the neutral zone, suggesting a cautiously bullish-to-neutral outlook while prices hover near the $65 resistance level.
From a daily perspective, oil prices are breaking out above the $65 resistance, and a firm hold could pave the way toward $66 and potentially retest the $71 and $73 levels.
On the downside, the psychological support at $60 remains critical. A break below $60—and more critically, below the $58 moving average—could reintroduce long term bullish positioning from $55 and $49.
- Razan Hilal, CMT
TRADE ALERT: USOIL SELL SETUP ENTRY: 64.50 (Sell)TRADE ALERT: USOIL SELL SETUP
ENTRY: 64.50 (Sell)
🎯 Target 1: 64.00
🎯 Target 2: 63.00
🎯 Target 3: 62.00
🎯 Final Target: 60.00
🛑 STOP LOSS: Always use proper risk management!
⚠️ Risk no more than 1–2% of your capital per trade.
🔍 Setup based on technical analysis and price action.
💡 Breakdown:
• Strong resistance near 64.50
• Bearish momentum building
• Downtrend continuation likely
📊 Monitor volume and market sentiment
🧠 Stay disciplined, don’t chase entries
⏰ Timing is key — watch for confirmation
📅 Short to mid-term outlook
📌 This is not financial advice, just my trading plan.
✅ Stick to your rules
🔁 Trade the plan, not emotions
#USOIL #CrudeOil #TradingSignals #SellSetup #Forex #Commodities #RiskManagement #TradeSmart #TechnicalAnalysis #PriceAction

WTI Cash Bearish Divergence BearishU.S. Iran tensions, U.S. China Talks, U.S. Production capacity down,Inflation high
Techincally: Volume surges, Divergence,
Targets: See the chart.
Entries: 3 approches(red Boxes)
I am short. I stay short. At current level (above 64 risk of being bullish is higher than being short).
Mange risk tightly.

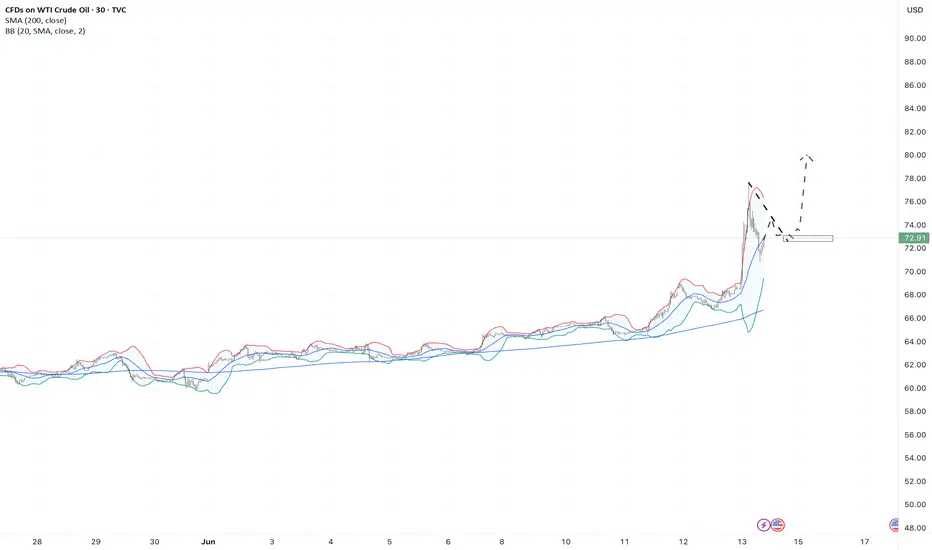
Daily bullish expectations of crude oilDouble bottom structure,
breaking through the neckline.
The bull's first target looks at 74.
WTI OIL Might be close to the end of correction or finished it.there are definetly more than 1 posibilities in this one, 1 more down wave can occur and that is why i have a invalidation level. long term definetly buy but short and mid term is just not very clear, i am thinking it s time to buy. what i am going to do is keep track of it a bit more in short term and if it gives me good buying opportunity near the below i will enter the trade with a stop loss. and if it upbrakes possible impulse wave will occur and i will buy again to mid term target. so for now keep an eye on it and buy if the opportunity arise.

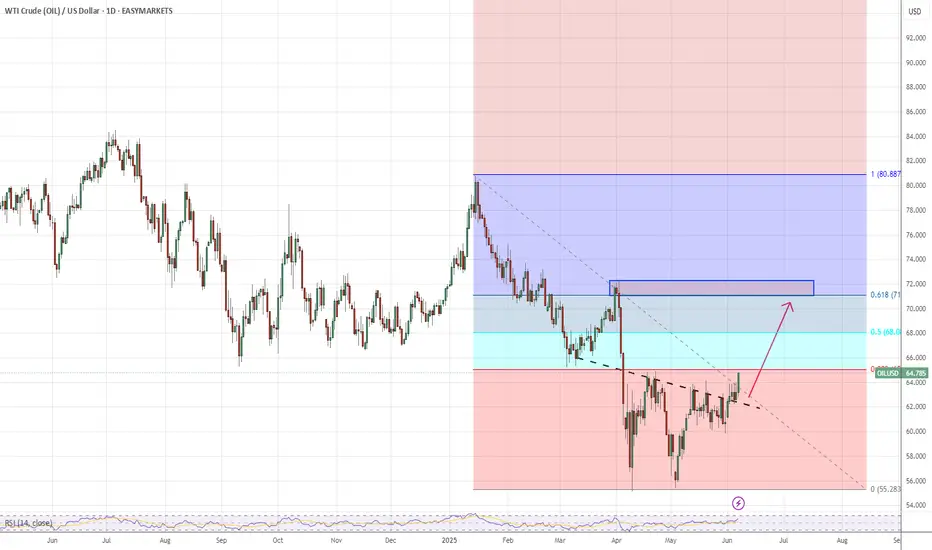
$USOIL & $XLE: Sustainable bull run or short-term bounce?Recently the commodities and the commodity stocks are having a bull run. Oil being one of the largest categories within the Bloomberg Commodity Index Futures is late to the party after the AMEX:GLD rally. In my recent posts I made the case that the TVC:USOIL will remain range bound, and we will see 55 $ in $USOIL. But since then, TVC:USOIL has gone through a small rally with price currently @ 65 $ which has taken it closer to the 0.5 Fib retracement level. AMEX:XLE , which represents the S&P500 energy sector stocks, is also attempting to post a rally.
In the short-term markets have diverged from our last predictions. Let’s be honest in the short term such rallies might be accompanied by short covering and the weakness in TVC:DXY is also helping the Energy rally. But now the question comes where do we go from here?
TVC:USOIL and AMEX:XLE can have a bull rally due to short covering and momentum pushing it across the 0.5 Fib level. If TVC:USOIL breaks above 0.5 then the next stop 0.618 will take us 80 $ indicating a 25% upside form here. And a similar upside in the AMEX:XLE will take us 131 $, which is also 25% up from its current value and the upper range of the upward slopping channel indicative from the chart.
Verdict: Short term probable bounce in TVC:USOIL and $XLE. Long term bearish on TVC:USOIL with target 55 - 60 $.

USOIL Will Go Down From Resistance! Sell!
Here is our detailed technical review for USOIL.
Time Frame: 6h
Current Trend: Bearish
Sentiment: Overbought (based on 7-period RSI)
Forecast: Bearish
The market is trading around a solid horizontal structure 64.869.
The above observations make me that the market will inevitably achieve 63.448 level.
P.S
Please, note that an oversold/overbought condition can last for a long time, and therefore being oversold/overbought doesn't mean a price rally will come soon, or at all.
Disclosure: I am part of Trade Nation's Influencer program and receive a monthly fee for using their TradingView charts in my analysis.
Like and subscribe and comment my ideas if you enjoy them!

USOUL:Go long near 65.5
USOIL:Crude oil broke through the watershed 64.85 after the emergence of strong unilateral bulls, daily cycle relying on short-term average to go even Yang form, rising space has opened, pay attention to the strong will continue at least a few trading days, short-term relying on 65 defense needs to be more, pay attention to 65.5 near the long, see 66.7-67
Trading Strategy:
BUY@65.5
TP: 66.7-67
↓↓↓ More detailed strategies and trading will be notified here ↗↗↗
↓↓↓ Keep updated, come to "get" ↗↗↗

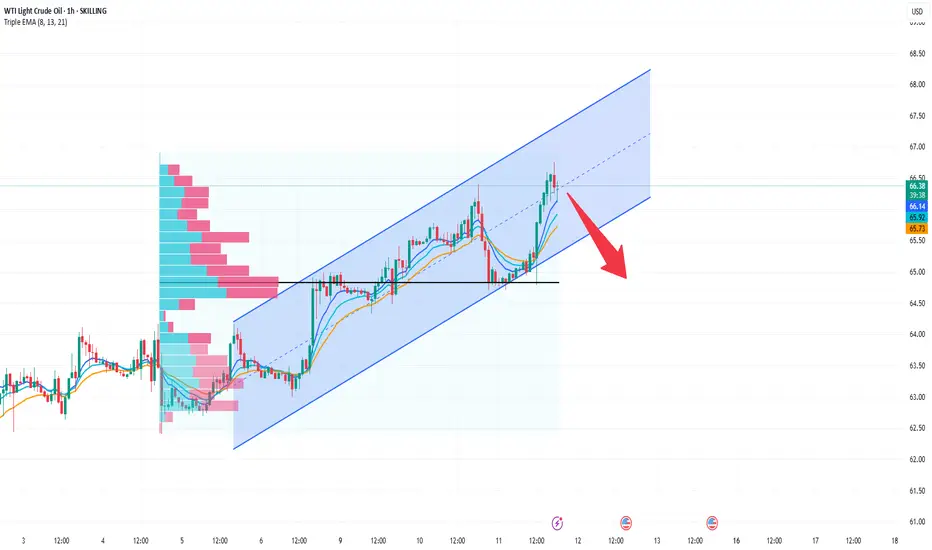
USOIL: Downward Movement in Primary-Secondary AlternationUSOIL's short-term trend is moving downward in a primary-secondary alternating pattern. After hitting $66.2, the moving average system diverges downward, indicating an objectively downward short-term trend. In terms of momentum, the MACD indicator opens downward below the zero axis and coincides with bearish columns, suggesting abundant downward momentum. It is expected that the intraday crude oil trend will continue to fall and seek support below $64.5.
USOIL
sell@65-65.5
tp:64.5-64
I am committed to sharing trading signals every day. Among them, real-time signals will be flexibly pushed according to market dynamics. All the signals sent out last week accurately matched the market trends, helping numerous traders achieve substantial profits. Regardless of your previous investment performance, I believe that with the support of my professional strategies and timely signals, I will surely be able to assist you in breaking through investment bottlenecks and achieving new breakthroughs in the trading field.
USOIL Trade Setup: Watching for a Bullish Break After Pullback 📈 US OIL Trade Plan
Currently, USOIL is in a strong bullish trend 🔥 — price action has pushed into overextended territory, which opens the door for a potential pullback 🌀.
I'm watching for a WTI retracement into equilibrium, ideally aligning with the 50%–61.8% Fibonacci levels from the previous swing low to high 🔍📉. If price corrects into that zone and we find support, followed by a bullish break in market structure 💥 — that would be the confirmation I’m waiting for to consider a long position 🚀.
⚠️ Key Level to Watch: That structure break is the trigger — no confirmation, no trade 🧠.
⚠️ Disclaimer:
This content is for educational and informational purposes only and should not be considered financial advice. Always conduct your own analysis and consult a professional before making trading decisions. Trade responsibly.

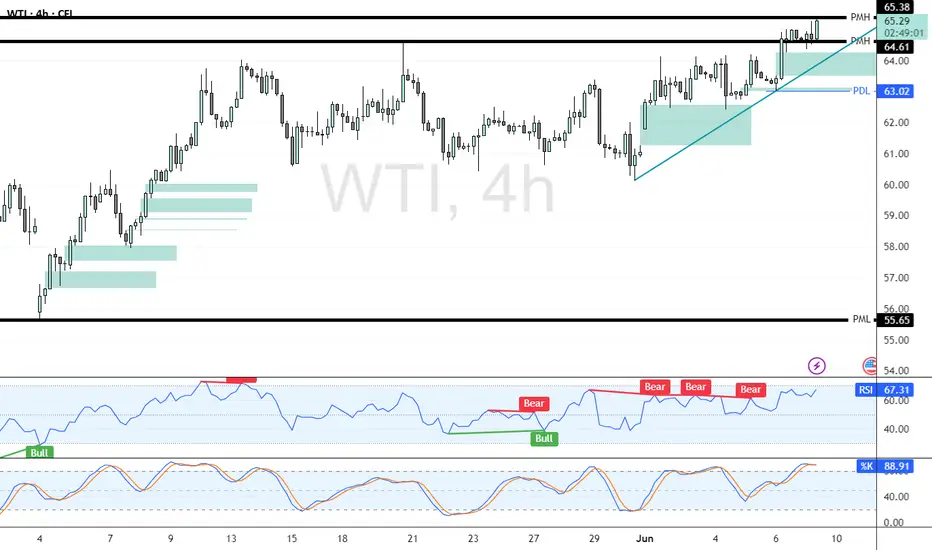
Crude Oil Tests Monthly High—Bullish or Liquidity Grab? FenzoFx—Crude Oil broke above its previous monthly high at $64.61, trading around $65.27. While a bullish trend is indicated by a 23,000 increase in buy-side contracts, technical signals suggest caution.
RSI 14 shows bearish divergence, and the Stochastic Oscillator remains overbought. Oil could consolidate before resuming its uptrend. Buying breakouts isn’t advised. A dip toward $63.02 may offer a discounted entry.
USOIL:Sharing of the Trading Strategy for Next WeekAll the trading signals this week have resulted in profits!!! Check it!!!👉👉👉
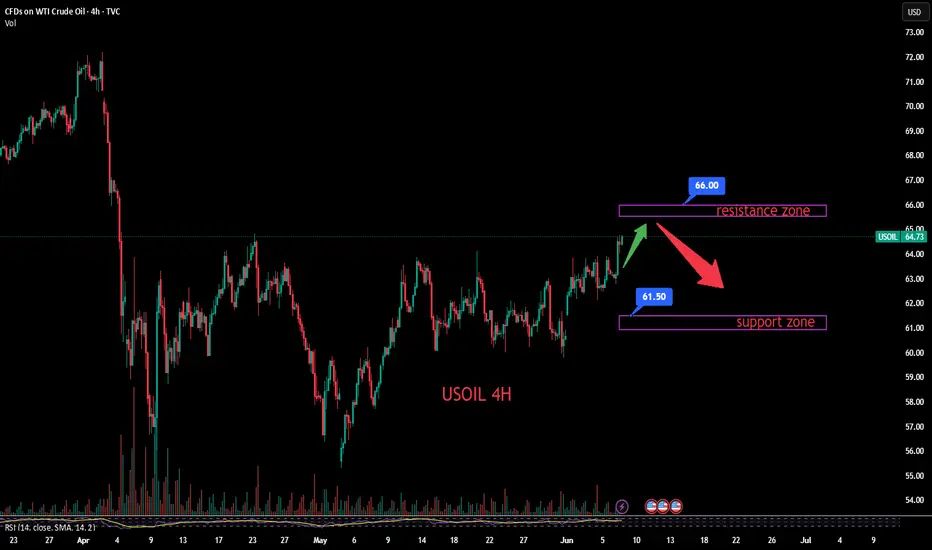
Fundamental Analysis:
OPEC+ plans to increase production by 411K bpd in July, with major producers like Saudi Arabia and the UAE holding ample idle capacity. This expansion could exacerbate global crude oil oversupply, pressuring prices. Concurrently, the U.S. steel import tariff hikes may trigger trade frictions, dampening global economic recovery and curbing industrial crude demand.
Technical Analysis:
The MACD indicator shows expanding green bars (bearish momentum), with short-term moving averages trending toward a bearish crossover of long-term averages. However, recent price retracement from relative highs suggests potential rebound. Key resistance lies at the $66–67/barrel zone, while critical support holds at $61.5–62/barrel.
Trading Recommendation:
Aggressive traders may initiate light short positions near 66 on a confirmed resistance rejection.
Trading Strategy:
Sell@66-65.5
TP:63-62
Share accurate trading signals daily—transform your life starting now!
👇 👇 👇 Obtain signals👉👉👉