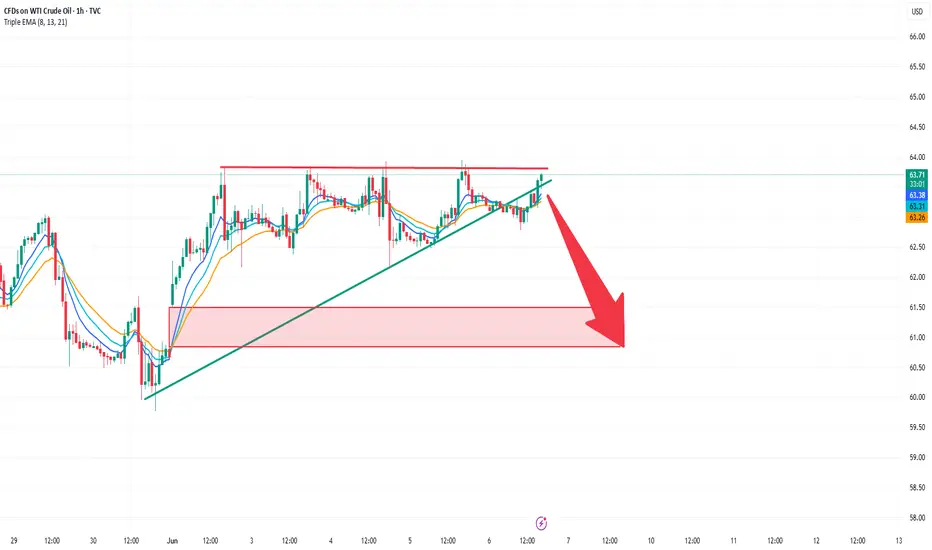
WTI on high time frame , price reach 60$?
"Hello friends, focusing on WTI, the price is currently in a bullish trend on the daily time frame. During the last NY session, the price swept liquidity in the $66 zone and faced a strong rejection. Considering both technical analysis and fundamental news, I believe the price is gearing up for a decline, with the initial target likely around $60."
If you need further clarification or have more details to discuss, feel free to share!
USOIL.F trade ideas

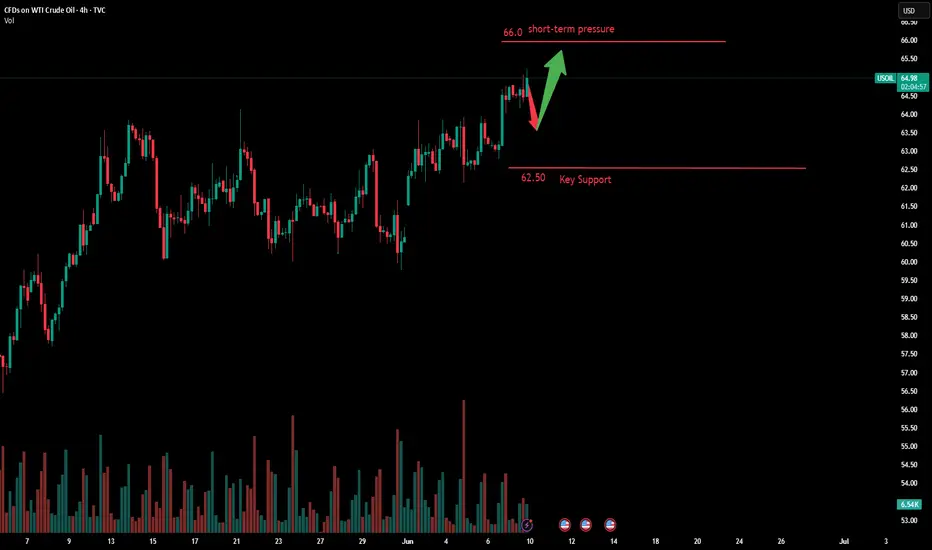
Will Oil Prices Face Downward Pressure After EIA's Forecast?Macro approach:
- The EIA’s latest short-term outlook projects weaker oil prices as rising global inventories weigh on the market. Sluggish demand growth and increased production are expected to push output above consumption, building stockpiles and adding pressure on prices.
- Traders are also monitoring the ongoing US-China trade talks in London. Sentiment remains cautiously optimistic after US Commerce Secretary Lutnick described the negotiations as progressing well.
- On the supply side, Saudi Aramco has reduced its Jul oil shipments to China by 1 million barrels compared to Jun, suggesting that the recent OPEC+ production hike may not translate into substantial new supply.
Technical approach:
- USOIL retested both the descending trendline and resistance near 64.50 before pulling back. The price remains above both EMAs, signaling that bullish momentum is still intact.
- A breakout above 64.50 and the descending trendline could open the door to 68.00–70.00.
- However, failure to clear this resistance may lead to a retreat toward the 60.00 support level.
Analysis by: Dat Tong, Senior Financial Markets Strategist at Exness
Crude Oil Surges StronglyAs market participants await positive outcomes from negotiations between a major Asian economy and the U.S., crude oil prices edge higher modestly. During Tuesday's Asian session, Brent crude oil futures rose by $0.12 to $67.16 per barrel, while U.S. WTI crude oil gained $0.13 to $65.42, briefly hitting a new high since April 4th intraday. In the previous trading day, Brent surged to $67.19, the highest level since April 28th, primarily driven by market expectations of a potential deal between the U.S. and China.
Current oil prices stand at a crossroads of multiple factors. In the short term, the global trade landscape dictates the main thread of market sentiment. If a mitigation plan is reached, it will boost demand expectations. However, the resumption of Iranian exports and OPEC's production increase strategy may lead to a potential supply glut in the second half of the year, emerging as the primary risk suppressing oil prices.
Technically, the K-line has pierced below the moving average system, indicating a shift in the short-term objective upward trend. The formation of a large-bodied bearish candle in the subsequent session establishes the main rhythm, suggesting that oil prices may further decline to around $63.50 today before seeking new support.
Overall, today's trading strategy for crude oil is recommended to focus on rebound shorting as the primary approach and pullback long positions as a supplement. In the short term, monitor resistance at the $67.5-68.0 range, while support lies at the $65.0-64.5 level.
Humans need to breathe, and perfect trading is like breathing—maintaining flexibility without needing to trade every market swing. The secret to profitable trading lies in implementing simple rules: repeating simple tasks consistently and enforcing them strictly over the long term.
The rollover of crude oil contracts leads to price differences.Crude oil is currently in the contract rollover phase, and prices may vary between different brokers. For specific trading strategies, you can contact me directly, and I will provide you with accurate trading strategies accordingly.
I am committed to sharing trading signals every day. Among them, real-time signals will be flexibly pushed according to market dynamics. All the signals sent out last week accurately matched the market trends, helping numerous traders achieve substantial profits. Regardless of your previous investment performance, I believe that with the support of my professional strategies and timely signals, I will surely be able to assist you in breaking through investment bottlenecks and achieving new breakthroughs in the trading field.

The trend after the surge in crude oil prices
💡Message Strategy
Core economic data and event-driven
The US employment report boosted expectations of rate cuts. According to the US Department of Labor, the unemployment rate stabilized at 4.2% in May, and 139,000 new non-farm jobs were added (the previous value was revised down). Phil Flynn, senior analyst at Price Futures Group, pointed out: "The employment data is 'just right', neither too hot nor too cold, but it strengthens the possibility of the Fed's rate cut." The expectation of a rate cut is seen as a potential positive for the crude oil market, as loose policies may stimulate economic recovery and boost oil demand.
OPEC+ moderately increased production to balance market expectations. OPEC+ reached an agreement on Saturday to increase production by 411,000 barrels per day in July, which is lower than Saudi Arabia's proposal, but in line with market expectations. HSBC analysts believe: "Summer oil demand will peak in July-August, matching the increase in OPEC+ supply, and the market supply and demand will tend to balance in the second and third quarters." The decision did not suppress oil prices, but instead eased concerns about oversupply.
📊Technical aspects
WTI crude oil: closed at $64.73 per barrel on Friday, up 2.21% on the day and 6.55% this week. It is about to reach our strategic target of 65.00. When everyone is looking at the decline of crude oil, our strategy is firmly on the rise, and the result is consistent with our direction.
From a technical perspective, the daily chart of US crude oil (WTI) shows that the price is running in a short-term rising channel, with support at around $63, while the upper resistance is concentrated in the $64.50 area. In recent trading days, WTI has received support at the 60-day moving average and successfully broke through the 20-day moving average, indicating that the short-term bullish momentum is gradually increasing.
At the same time, the MACD indicator shows a golden cross signal, and the momentum column continues to expand, indicating that the price is expected to further test the $65 mark. If the resistance level can be effectively broken, the next target may be $67.
💰 Strategy Package
Long Position: 63.50-64.00
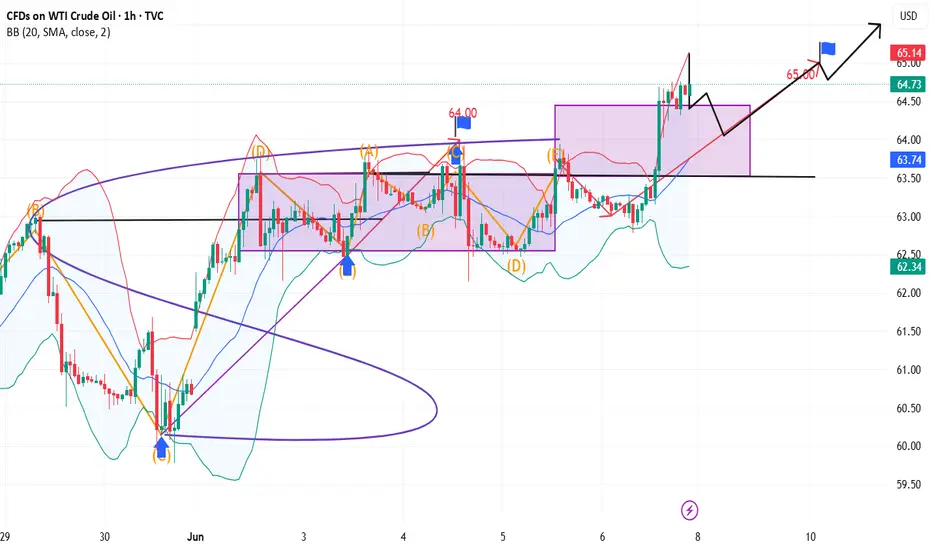
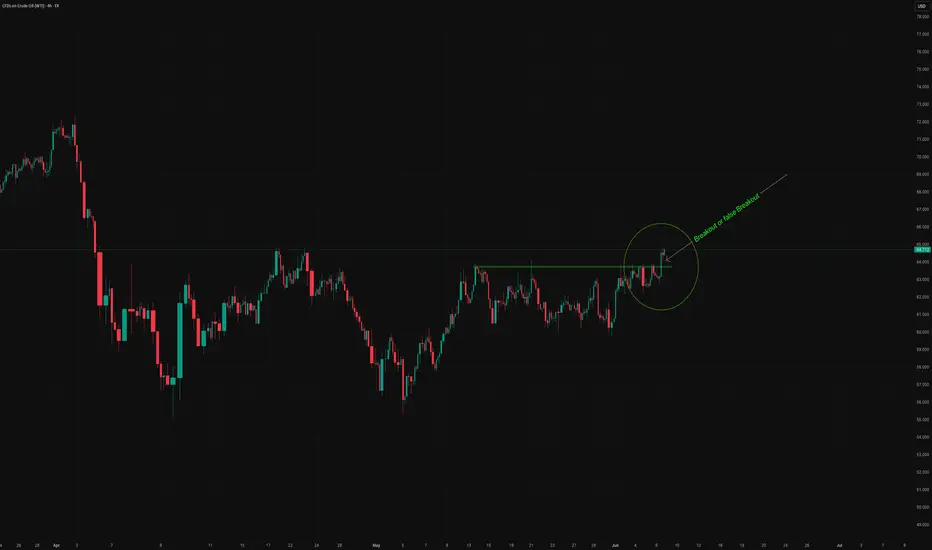
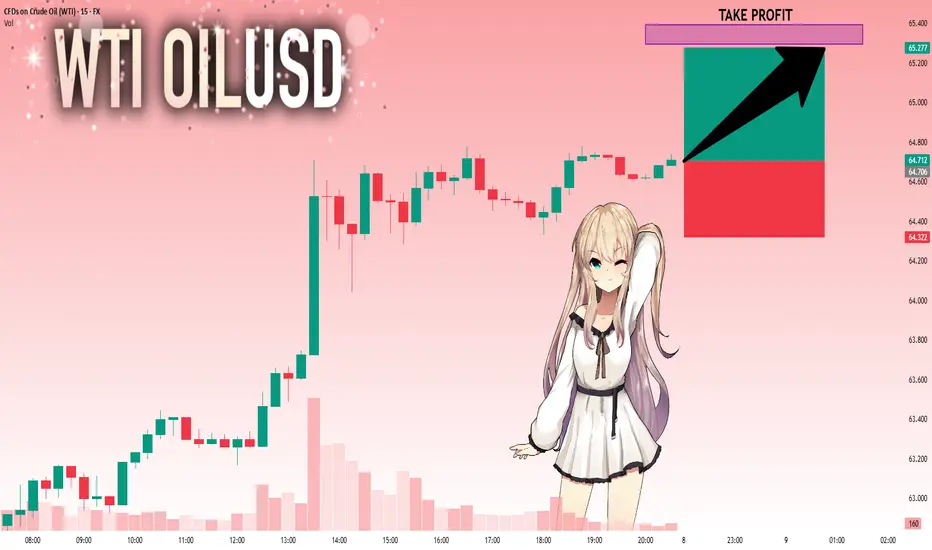
Possible "W Pattern" Initiation After Breaking Through $64.5USOIL surged strongly last Friday, closing with a large bullish candle on the daily chart. Since the sharp decline on April 4th, the $64.5 level has acted as resistance on the chart. The price remained capped at $64.5 for four consecutive trading days (Monday to Thursday) last week, but Friday’s strong bullish candle successfully broke above $64.5, signaling a valid breakout. This breakout suggests the formation of a potential W-bottom pattern, paving the way for further upward movement. Crude oil is expected to continue rising to new highs in today's trading.
USOIL
buy@63.5-64
tp:64.7-65.2
I am committed to sharing trading signals every day. Among them, real-time signals will be flexibly pushed according to market dynamics. All the signals sent out last week accurately matched the market trends, helping numerous traders achieve substantial profits. Regardless of your previous investment performance, I believe that with the support of my professional strategies and timely signals, I will surely be able to assist you in breaking through investment bottlenecks and achieving new breakthroughs in the trading field.

Crude oil breaks through strongly.On the daily chart of crude oil, the upper Bollinger Band is opening upward, and the 64.85 level is basically unable to hold. Once this level is broken, it will open up upward space, and the rally will just be beginning. After the breakout, the market will shift from the previous sustained oscillation to a strong unilateral trend, and the rally will at least continue with a wave of strength. Focus on going long at 63.50/64, or if there is a strong rally in the European session, pullbacks in the US session are also buying opportunities. Now it is about whether there will be a strong breakout.
Humans need to breathe, and perfect trading is like breathing—maintaining flexibility without needing to trade every market swing. The secret to profitable trading lies in implementing simple rules: repeating simple tasks consistently and enforcing them strictly over the long term.
Trading Strategy:
buy@63.5-64.0
TP:65.5-66.0
USOIL:Wait 63.6-64 to go long
Affected by last week's data, crude oil directly broke through the short-term pressure 64, technical point of view of the daily track upward opening, 64.8 position basically can not hold, and once the break open the space for rise, the rise has just begun;
After breaking from the early continuous shock to a strong unilateral, the market will at least continue a wave of strength, pay attention to 63.6-64 range to do more, or the European market force to rise, the United States is also more, now is to see a strong break.
Trading Strategy:
BUY@63.6-64
TP: 65-65.2
↓↓↓ More detailed strategies and trading will be notified here ↗↗↗
↓↓↓ Keep updated, come to "get" ↗↗↗

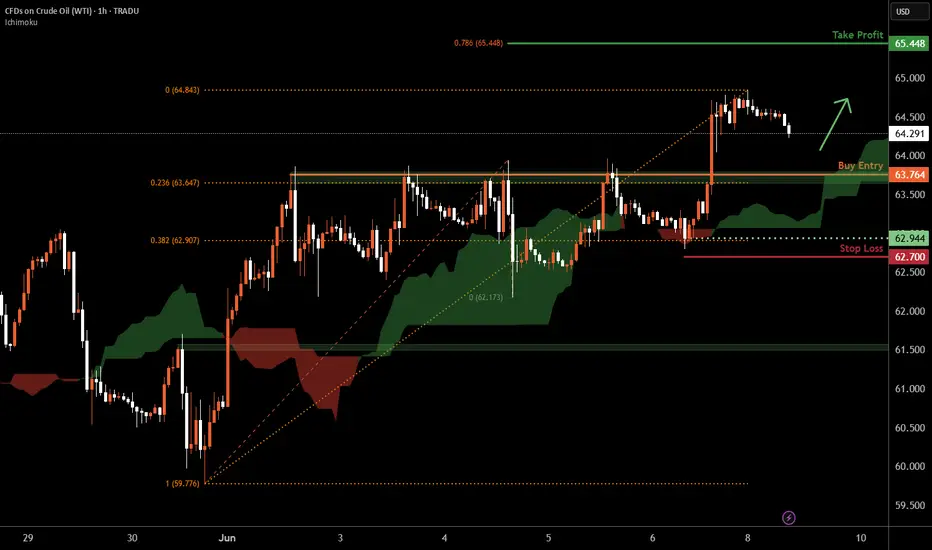
WTI Oil H1 | Falling toward a pullback supportWTI oil (USOIL) is falling towards a pullback support and could potentially bounce off this level to climb higher.
Buy entry is at 63.76 which is a pullback support that aligns with the 23.6% Fibonacci retracement.
Stop loss is at 62.70 which is a level that lies underneath a swing-low support and the 38.2% Fibonacci retracement.
Take profit is at 65.44 which is a resistance that aligns with the 78.6% Fibonacci projection.
High Risk Investment Warning
Trading Forex/CFDs on margin carries a high level of risk and may not be suitable for all investors. Leverage can work against you.
Stratos Markets Limited (tradu.com ):
CFDs are complex instruments and come with a high risk of losing money rapidly due to leverage. 63% of retail investor accounts lose money when trading CFDs with this provider. You should consider whether you understand how CFDs work and whether you can afford to take the high risk of losing your money.
Stratos Europe Ltd (tradu.com ):
CFDs are complex instruments and come with a high risk of losing money rapidly due to leverage. 63% of retail investor accounts lose money when trading CFDs with this provider. You should consider whether you understand how CFDs work and whether you can afford to take the high risk of losing your money.
Stratos Global LLC (tradu.com ):
Losses can exceed deposits.
Please be advised that the information presented on TradingView is provided to Tradu (‘Company’, ‘we’) by a third-party provider (‘TFA Global Pte Ltd’). Please be reminded that you are solely responsible for the trading decisions on your account. There is a very high degree of risk involved in trading. Any information and/or content is intended entirely for research, educational and informational purposes only and does not constitute investment or consultation advice or investment strategy. The information is not tailored to the investment needs of any specific person and therefore does not involve a consideration of any of the investment objectives, financial situation or needs of any viewer that may receive it. Kindly also note that past performance is not a reliable indicator of future results. Actual results may differ materially from those anticipated in forward-looking or past performance statements. We assume no liability as to the accuracy or completeness of any of the information and/or content provided herein and the Company cannot be held responsible for any omission, mistake nor for any loss or damage including without limitation to any loss of profit which may arise from reliance on any information supplied by TFA Global Pte Ltd.
The speaker(s) is neither an employee, agent nor representative of Tradu and is therefore acting independently. The opinions given are their own, constitute general market commentary, and do not constitute the opinion or advice of Tradu or any form of personal or investment advice. Tradu neither endorses nor guarantees offerings of third-party speakers, nor is Tradu responsible for the content, veracity or opinions of third-party speakers, presenters or participants.
Oil up or downAll says that must be dump good NFP data to dollar TA is 50/50 for me.But price still going up,now is very risky enter to market.Best wait monday.Share you opinion.
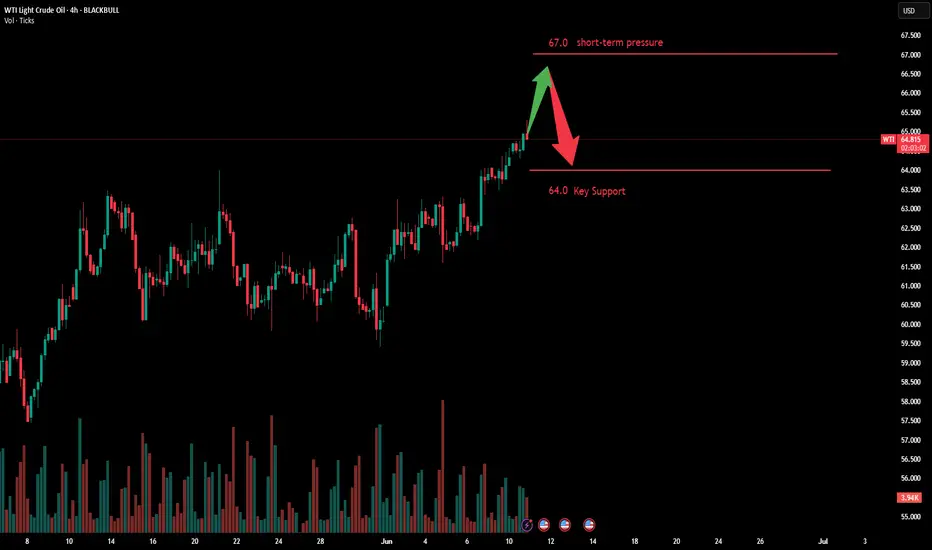
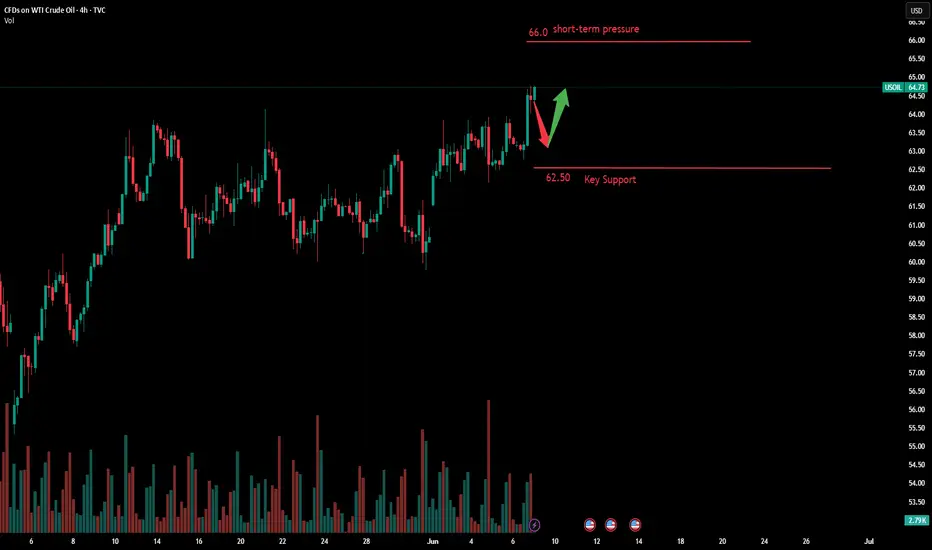
Analysis of Upward/Downward Trends in Monday's Opening MarketBoosted by the telephone conversation between leaders of the world's two largest economies, oil prices maintained their upward momentum on Friday. Brent crude stabilized at around $65 per barrel, notching its first weekly rebound since mid-May; WTI crude also held near $63. "Against the backdrop of gradually easing macro uncertainties, the risk of panic selling in the market has significantly diminished," analysts said. "With the arrival of the summer peak demand season and the superimposition of geopolitical tensions in the Middle East and Russia, the downside for oil prices has been notably constrained."
The recent steady rebound in oil prices indicates that the market has gradually digested macro uncertainties, though the underlying supporting factors remain fragile. While trade concerns have temporarily subsided, whether OPEC+ will continue to release capacity as expected by the market will be key to determining whether oil prices can sustain their rebound. Meanwhile, the options market reflects expectations of a year-end supply glut, which will test the coordination capabilities of oil-producing countries.
Overall, for next week's crude oil trading strategy, it is recommended to prioritize buying on dips and supplement with shorting on rebounds. In the short term, monitor resistance at the $66.0-$67.0 level, while short-term support lies at the $63.5-$62.5 level.
Humans need to breathe, and perfect trading is like breathing—maintaining flexibility without needing to trade every market swing. The secret to profitable trading lies in implementing simple rules: repeating simple tasks consistently and enforcing them strictly over the long term.
Trading Strategy:
buy@62.0-62.5
TP:64.5-65.0
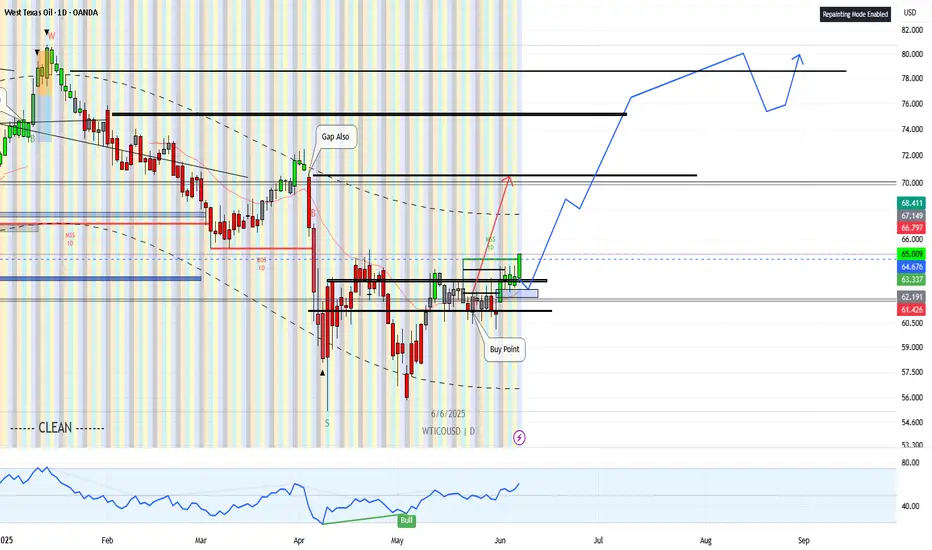
WTICOUSD - BULLISH
Typical Wycoff
Break Re-Test
Slight Tap of FV Gap
Bullish Engulfing Candle
Usually signifies "In a Hurry".
Best Analysis i think was Perplexity Ai
Bullish Case for Oil
US Jobs Data: Stronger-than-expected US jobs numbers have pushed prices higher, with algos covering short bets
Geopolitical Risks: Ongoing tensions in Ukraine and Iran, plus Canadian wildfires, are supporting prices due to potential supply disruptions
OPEC+ Supply Increase Smaller Than Feared: OPEC+ is raising output, but by less than the market expected, which has helped limit downside pressure and even sparked price gains
Recent Price Action: Oil has rebounded to around $64–$65 (Brent) after several weeks of losses, suggesting some stabilization and potential for a technical bounce
Deep Ai
Probability of bullish continuation: 75/100
Technical s indicate a relatively high likelihood that the current bullish trend will continue toward the identified resistance zone above, provided no major fundamental shifts occur. However, caution remains due to potential pullbacks or consolidation near resistance levels.
This is the safest place to enter usually
Cost average in not stops they suck !
imho
Lets See : )
.
USOIL: Strong Bullish Sentiment! Long!
My dear friends,
Today we will analyse USOIL together☺️
The recent price action suggests a shift in mid-term momentum. A break above the current local range around 64.706 will confirm the new direction upwards with the target being the next key level of 65.295. and a reconvened placement of a stop-loss beyond the range.
❤️Sending you lots of Love and Hugs❤️
OIL PRICE MAY RISE!!I anticipate oil price to rise after the resistance level of $64 got broken. technically i expect a rise in price further to $64
Therefore, a buy opportunity is envisaged

USOIL Will Go Up! Long!
Here is our detailed technical review for USOIL.
Time Frame: 9h
Current Trend: Bullish
Sentiment: Oversold (based on 7-period RSI)
Forecast: Bullish
The market is approaching a significant support area 61.359.
The underlined horizontal cluster clearly indicates a highly probable bullish movement with target 64.395 level.
P.S
We determine oversold/overbought condition with RSI indicator.
When it drops below 30 - the market is considered to be oversold.
When it bounces above 70 - the market is considered to be overbought.
Disclosure: I am part of Trade Nation's Influencer program and receive a monthly fee for using their TradingView charts in my analysis.
Like and subscribe and comment my ideas if you enjoy them!

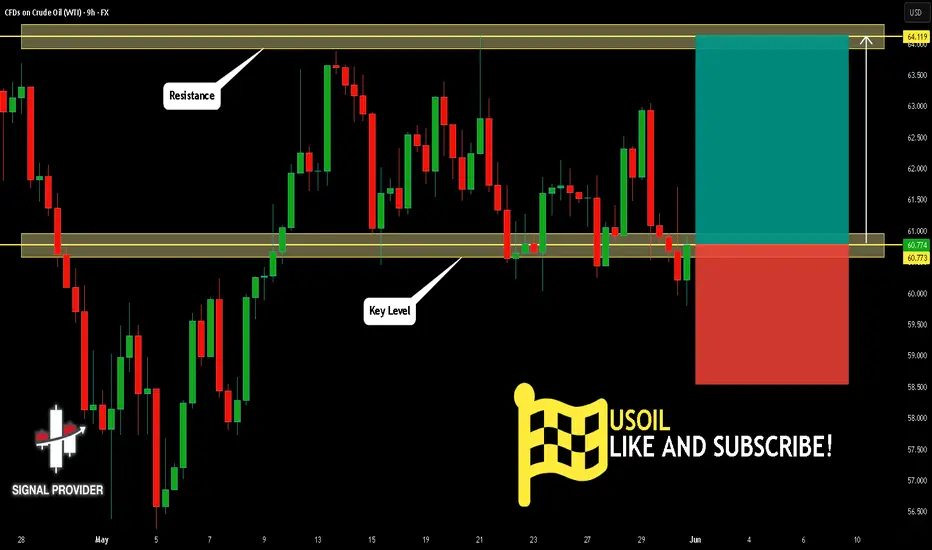
USOIL Will Go Higher From Support! Buy!
Take a look at our analysis for USOIL.
Time Frame: 9h
Current Trend: Bullish
Sentiment: Oversold (based on 7-period RSI)
Forecast: Bullish
The market is testing a major horizontal structure 60.773.
Taking into consideration the structure & trend analysis, I believe that the market will reach 64.119 level soon.
P.S
Overbought describes a period of time where there has been a significant and consistent upward move in price over a period of time without much pullback.
Disclosure: I am part of Trade Nation's Influencer program and receive a monthly fee for using their TradingView charts in my analysis.
Like and subscribe and comment my ideas if you enjoy them!
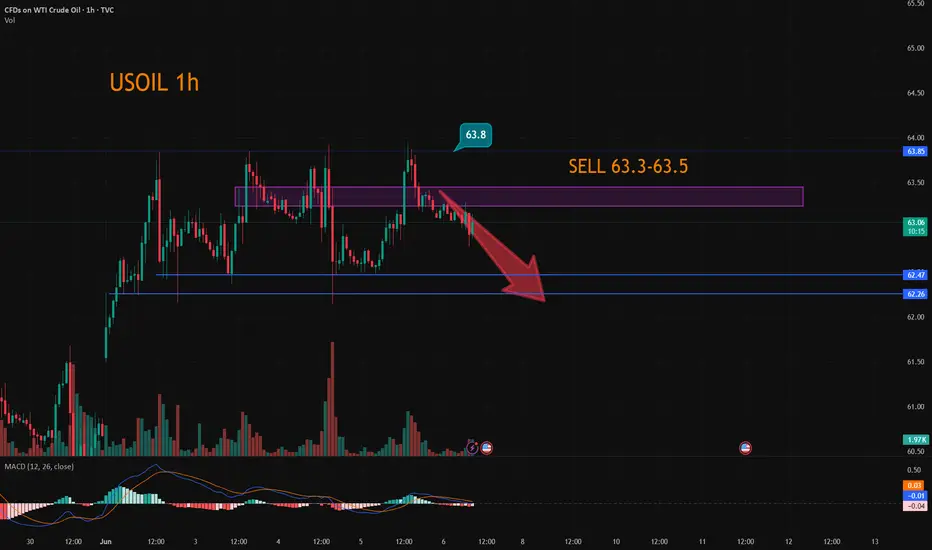
USOIL:The strategy of going short
USOIL: Same thinking, still maintain the short strategy. Friends with short orders at 63.3-63.5 continue to wait, can increase short orders near 63.8, the target is 62.5-62.3 unchanged
↓↓↓ More detailed strategies and trading will be notified here ↗↗↗
↓↓↓ Keep updated, come to "get" ↗↗↗
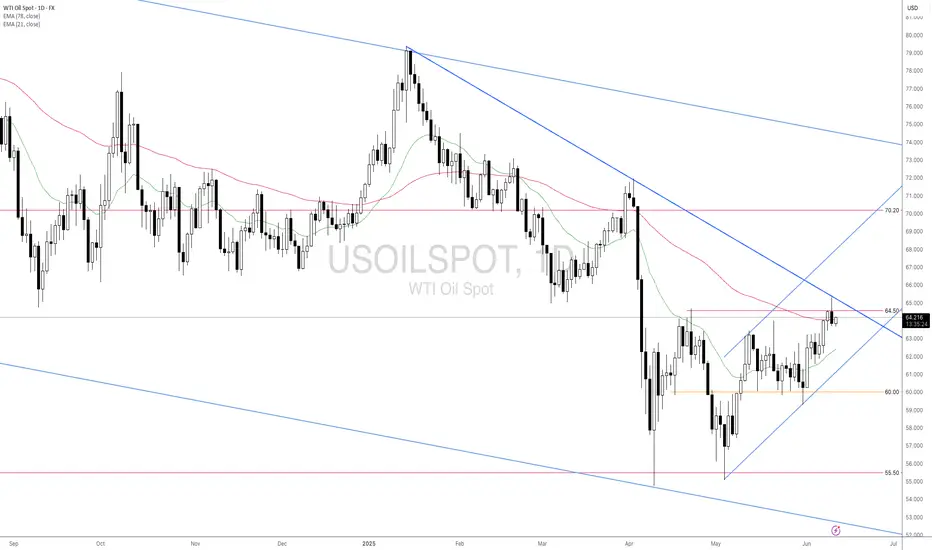
Crude Oil (WTI) Daily Chart AnalysisCrude Oil (WTI) Daily Chart Analysis
Pattern Formed:
A Symmetrical Triangle formation is clearly visible.
Context:
The prior trend leading into the triangle was bearish.
Typically, in technical analysis, a triangle after a downtrend is considered a continuation pattern — meaning there is a higher probability that the price will break downward.
The triangle appears to have completed its 5-wave internal structure (ABCDE), a classical behavior of contracting triangles.
Breakout Expectation:
After a completed 5-wave triangle, a breakout is imminent.
Directional Bias: Since this triangle is forming after a strong downtrend, the higher probability is for a bearish breakout.
However, triangles can break either way, and when they do, the move is often impulsive.
Potential Scenarios:
Bearish Breakdown (High Probability):
A downside break would likely trigger a sharp fall.
Immediate support levels to watch post-breakout:
$60.00
$56.50
$46.75 (measured move — target derived from the height of the triangle projected downward)
Bullish Breakout (Low Probability but Possible):
In case of an upside breakout, resistance zones are:
$72.00 (supply zone + previous highs)
$78.00
Upside could see sharp momentum but is less likely unless there is strong fundamental support (e.g., geopolitical tensions, production cuts).
Volume Confirmation:
Volume typically contracts during triangle formation. Post-breakout, volume expansion is essential to confirm the breakout direction.
Indicators (Suggested Additional Confirmations):
Watch for RSI — if divergence forms, could signal weakness.
Monitor MACD for crossovers at breakout zones.
Summary
Triangle Completed: 5-wave structure inside the triangle — ready for breakout.
Bias: Bearish continuation pattern — higher probability of a downward move.
Trigger: Breakout of the triangle boundary with volume expansion will confirm the next move.
Targets (Post-Breakout):
Downside: $60 ➔ $56.5 ➔ $46.75
Upside (less probable): $72 ➔ $78
⚠️ Disclaimer:
This analysis is based purely on technical chart patterns and historical price action. Trading and investing involve substantial risk. Always perform your own due diligence or consult a financial advisor.

Crude Oil is Building Momentum for a BreakoutDuring the U.S. trading session on Thursday, international oil prices fluctuated higher, with U.S. crude oil currently trading near $63.55 per barrel. Despite the intraday volatility, international oil prices remain under downward pressure, primarily influenced by two key factors.
First, data from the U.S. Energy Information Administration (EIA) showed that as of last week, U.S. gasoline and distillate inventories increased more than expected, signaling weakening refined product demand in the world’s largest economy. This development has sparked investor concerns about whether the U.S. summer driving season can sustain demand growth, leading to a ~1% decline in oil prices on Wednesday.
The current crude oil market is caught between supply and demand headwinds:
Supply-side pressures: OPEC+’s production increase plan and Saudi Arabia’s strategic price cuts have created short-term bearish sentiment.
Demand-side uncertainties: The unexpected rise in U.S. refined product inventories has amplified market doubts about the vigor of global consumption recovery.
Additionally, the escalation of international trade frictions has further dampened risk appetite, exacerbating downward pressure on prices.
In the short term, oil prices are likely to continue oscillating within the $60–$65 per barrel range. Market participants should closely monitor U.S. macroeconomic data and OPEC+’s compliance with its production policies for directional cues.
Humans need to breathe, and perfect trading is like breathing—maintaining flexibility without needing to trade every market swing. The secret to profitable trading lies in implementing simple rules: repeating simple tasks consistently and enforcing them strictly over the long term.
Trading Strategy:
buy@61.5-62.0
TP:63.0-63.5

USOIL SELL SIGNAL Entry Point: 62.60USOIL SELL SIGNAL
Entry Point: 62.60
🎯 Target 1: 62.00
🎯 Target 2: 61.00
🎯 Final Target: 60.00
⚠️ Risk Management Matters!
– Always set a stop-loss
– Never risk more than 1–2% per trade
– Stick to your strategy, not emotions
📊 Technical Outlook:
– Resistance zone near 62.60
– Bearish pressure increasing
– Potential trend reversal forming
✅ Lock profits step by step
✅ Use trailing stops when in profit
✅ Avoid overtrading or revenge trading
📌 Stay consistent and patient
📌 The goal is longevity, not luck
📌 Trust your analysis – not the noise
📢 For educational purposes only – trade responsibly!

USOIL:Go short first today
USOIL: Crude oil downward momentum gradually stronger, the day's trend is weak, trading ideas first short.
Trading Strategy:
SELL@63.3-63.5
TP: 62.5-62.3
↓↓↓ More detailed strategies and trading will be notified here ↗↗↗
↓↓↓ Keep updated, come to "get" ↗↗↗

US OIL SHORT POSITION Oil price is currently in a Bearish trend, especially after it got rejected thrice from the supply zone, Also left a Gap over the weekend close and open which is another confluence for me taking the short is.
So let's see how it Goes.💪
